Plug Power's Green Hydrogen Plant Ignites Investor OptimismThe stock of hydrogen fuel cell company Plug Power (NASDAQ: NASDAQ:PLUG ) has been on a remarkable ascent, surging over 25% in the past five trading days alone. This impressive rally is attributed to several catalysts, including today's surge of 19.3% . Amidst a challenging period marked by a "going concern" warning in its third-quarter report, Plug Power ( NASDAQ:PLUG ) seems to be staging a remarkable comeback, fueled by a significant development: the operation of its new green hydrogen plant in Georgia, now touted as the largest liquid green hydrogen facility in the U.S.
Green Hydrogen Plant: A Financial Turning Point
After weathering a storm of financial uncertainty and a plunge in its stock value, Plug Power ( NASDAQ:PLUG ) provided a business update last week that breathed new life into the company. The cornerstone of this update was the successful commencement of operations at its green hydrogen plant in Georgia. The plant not only signifies a pivotal step towards sustainability but also a potential financial turning point for the company.
Cutting Costs and Boosting Revenue:
Plug Power ( NASDAQ:PLUG ) has faced financial challenges, including cash burn due to delays in its hydrogen production plans, leading to the purchase of hydrogen on the open market. However, the new Georgia plant is poised to be a game-changer, helping the company to cut costs and bolster revenue generation. With the plant now operational, Plug Power ( NASDAQ:PLUG ) is positioning itself to harness the growing demand for green hydrogen, driven by its applications in diverse industries.
Steel Industry Embraces Hydrogen:
The optimism surrounding Plug Power's ( NASDAQ:PLUG ) stock is further fueled by endorsements from industry players, including a notable mention from Cleveland-Cliffs, a leading U.S. steelmaker. In a recent fourth-quarter conference call, Cliffs CEO Lourenco Goncalves emphasized that "hydrogen is the real game-changing event in ironmaking and steelmaking." Goncalves's statement highlighted the transformative potential of hydrogen in these industries, positioning the United States as a frontrunner in adopting competitively priced green hydrogen for a true green industrial revolution.
The Road Ahead:
While Plug Power's ( NASDAQ:PLUG ) recent achievements have fueled optimism, it's essential for investors to remain cautious. The company is still on a journey toward realizing profits from its hydrogen production plans. As the new production facility ramps up, challenges and risks remain. Investors should carefully monitor Plug Power's ( NASDAQ:PLUG ) progress and be mindful of the evolving landscape in the hydrogen sector.
Conclusion:
Plug Power's ( NASDAQ:PLUG ) recent surge in stock value is indicative of a renewed optimism, driven by the successful launch of its green hydrogen plant in Georgia. With the potential to cut costs, boost revenue, and tap into the burgeoning demand for green hydrogen, Plug Power ( NASDAQ:PLUG ) is positioning itself at the forefront of the hydrogen revolution. As the company digs out of its financial hole, investors should tread carefully, mindful of the risks involved, even as Plug Power's ( NASDAQ:PLUG ) new production facility promises to be a catalyst for the company's future success in the evolving green energy landscape.
Plugpower

Plug Power Surges on Green Hydrogen Production and DOE LoanPlug Power Inc. (NASDAQ: NASDAQ:PLUG ) is making headlines as it announces the commencement of operations at its groundbreaking green hydrogen plant in Georgia – the largest of its kind in the U.S. This development, coupled with a significant financial lifeline from the Department of Energy (DOE), has sent the company's stock soaring, marking a potential comeback for the hydrogen industry leader.
Green Hydrogen Plant in Georgia:
The inauguration of Plug Power's green hydrogen plant in Georgia is a milestone moment for the company and the renewable energy sector. With a staggering production capacity of 15 tons of liquid electrolytic hydrogen per day, this facility is poised to be a game-changer, not only boosting Plug Power's bottom line but also setting a new standard for sustainable energy production in the United States.
The Georgia plant's production capacity is noteworthy, as it has the potential to power 15,000 forklifts daily, showcasing the practical applications of green hydrogen in the industrial sector. This move aligns with Plug Power's commitment to providing clean energy solutions and could be a crucial step in overcoming the industry's growth hurdles related to high costs.
Financial Resilience Through DOE Loan:
Plug Power's recent struggles with cash flow prompted a "going concern" warning and a significant stock dip in 2023. However, the company seems to have turned the tide with a game-changing $1.6 billion loan from the Department of Energy. This injection of capital is a much-needed lifeline that not only addresses immediate operational needs but also fuels the company's ambitious growth projects.
The financial infusion is expected to fund Plug Power's ( NASDAQ:PLUG ) ongoing projects, including the development and construction of at least six hydrogen plants. While the market has responded positively to this news, investors are keenly awaiting the company's next quarterly earnings call and management's outlook for 2024 to assess the long-term impact on Plug Power's financial health.
Challenges and Caution:
Despite the positive developments, Plug Power ( NASDAQ:PLUG ) faces challenges, evident in its lower-than-expected fourth-quarter revenue projection of $200 million – a significant shortfall from the anticipated $378 million. Additionally, the company foresees a non-cash goodwill impairment charge of up to $250 million. To counter these challenges, Plug Power is planning to cut cash spending by 70% from 2023, implementing reductions in capital expenditure and inventory investments.
Investor Advice:
While the recent announcements have undoubtedly rejuvenated investor confidence, prudent investors may consider exercising caution. Waiting until the next quarterly earnings call and examining management's outlook for 2024 could provide a clearer picture of Plug Power's trajectory. The company's commitment to cost-cutting measures and the successful implementation of its growth strategy will be crucial factors to monitor.
Conclusion:
Plug Power's recent surge on the back of green hydrogen production and a substantial DOE loan paints a resilient comeback story for the company. The green hydrogen plant in Georgia symbolizes a step towards sustainability, while the financial infusion addresses immediate concerns. As investors eagerly await further guidance from management, Plug Power's trajectory in 2024 will undoubtedly be closely watched, shaping the narrative for this key player in the renewable energy sector.

PLUG POWER - DAILY KEYLEVELSPLUG POWER - DAILY KEYLEVELS
These are my new keylevels to watch on daily tf.
i dont like this rising wedge , also beceause he is in a downtrend.

PLUG POWER - READY FOR THE PUMP?PLUG POWER - READY FOR THE PUMP?
As you can see, on weekly Time Frame we have a beautiful falling wedge, if this pattern will be broken with a broken resistance confirmation, there is a potential 10x in play.
I have an average between 3-4 USD so in my case 30-32 area will be an 8x

PLUG POWER - 2W - UPDATEThese are my keylevels for Plug Power.
As you can see, the price is stopped at the support zone and also it is in a 0.5fib area from entire structure so, it is an important level.
I will add more shares tomorow in my portofolio to increase my average buy


PLUG Short IdeaFirst stock idea I've shared... *gasp*
For the past 8 years, my strategy has mostly just been to hold a bunch of tech and green energy stocks forever, and that worked quite well, until recently.
Now that I'm a little more tuned in to Macro, markets, etc, I see nothing bullish right now, and would rather be in cash to set buys at lower levels. I also want to concentrate my portfolio (diversifying is how you save money, not make money - also, I care more about crypto anyway)
Nothing against PLUG - it's been one of my biggest gainers over the years... I just wish I took profit sooner...
Honestly it's just the technicals that makes me wanna short this. It's failing to break resistance as the rest of the market is puking.
On the one hand, it's bullish that PLUG hasn't dumped with tech stocks. On the other... maybe it's just late.
I definitely intend to buy all my PLUG back as I think it's a great company doing good work to transition us to green transportation :3

PLUG POWER - GREAT OPPORTUNITYThese are my Keylevels for PLUG.
Just look how beauty it is.
I love price action and that one gives me the possibilty to make and have an amazing chart = opportunity.
I starting to acumulate PLUG.
As you can see, there is an upptrend on 2W and a falling wedge on DAILY.

PLUG Plug Power Options Ahead of EarningsAnalyzing the options chain and the chart patterns of PLUG Plug Power prior to the earnings report this week,
I would consider purchasing the 6usd strike price in the money Calls with
an expiration date of 2023-11-10,
for a premium of approximately $0.54.
If these options prove to be profitable prior to the earnings release, I would sell at least half of them.
Looking forward to read your opinion about it.

Does history repeat itself?The previous correction cycle, after breaking the local low, ended with a cup and a nice bounce came.
The current situation is reminiscent of the previous one.
However, if there is a similar volume of short closing now, the down trend of about two years can easily be broken.
I also see signs of this on a larger time plane, on a weekly chart.

Strong bullish MACD divergence
Strong bullish MACD divergence on a weekly chart.
I think we are close to the breakout.

Plug Power -> Another 10.000% PumpMy name is Philip, I am a German swing-trader with 4+ years of trading experience and I only focus on price action and market structure 🖥️
I am trading the higher timeframes because this allows me to massively capitaliz e on the major market swings and cycles without getting caught up in the short term noise.
This is how you build real long term wealth!
In today's anaylsis I want to take a look at the bigger picture on Tesla.
Looking at Plug Power stock you can see that after the recent -90% correction Plug Power is now retesting a cluster of support zones from which we could see a decent move higher. Keep in mind that this is a very risky stock so keep your risk small on this trade.
- - - - - - - - - - - - - - - - - - - -
When the market moves where, and how, and if - these are all unknown.
The only thing which you can control is your risk.
- Philip Basic Trading -
Keep the long term vision🫡

PLUG | Buy zones | Hydrogen risingGeneral
Looking at 2 zones where i will buy equally amounts of PLUG for longterm hold.
First buy zone is based on the support zone that generated the recent swing high (red circle).
Main buy zone is a resistance level that gave support after it was broken for the big upswing.
Target: Correlation between 50% of the weekly range and top of the last swing.
Stop-Loss: None (Long term investment)
Good luck
Disclaimer:
- This information does not constitute as financial advice and is only for educational purposes. I am not your financial advisor.
- You trade entirely at your own risk
- Make your own research
- Finance and trading is evil, capitalism is bad, duh ;)

HYLN SHORTComparing to Companies Like Plug And Daimler Trucking I just don't see hyliion trending up anytime soon.
2.7 or lower for NYSE:HYLN
$27/$25 Target For NASDAQ:PLUG
HShort

PLUG My We can see price has been trading within the 10.75 and the 9.25 zones since the middle of March. Today we saw a strong push upwards that may continue and end up breaking to the outside towards the 12.25 zone. We'll keep an eye on this stock and react accordingly.

PLUG SHORT OVER Bought Over bought. Plug Plower, although promising company & tech, NASDAQ:PLUG still has a long way to go, long term 30$ might be a steal for a company as promising as this but for now I expect a correction down to $25.

Plug PowerThis is a 2-month chart (each candle represents a 2-month period) of Plug Power (PLUG). For those who are not already familiar, PLUG is an alternative energy company that develops and manufactures hydrogen fuel cell systems.
I recently added PLUG to my portfolio as a long-term investment. In my opinion, it has one of the best long-term charts of any stock right now in terms of the potential for outsized gains in the future. I will explain my reasoning below.
Chart Analysis
The 2-month chart below shows the entire price history of PLUG.
Throughout much of its history, PLUG was resisted by the EMA ribbon (yellow and red lines). The EMA ribbon is a collection of exponential moving averages that act as resistance when price reaches it from below and support when price reaches it from above.
If we zoom in (see below), we can see that the EMA has tightened together and PLUG's price is now sitting right on the ribbon. When moving averages tighten like this, they can act as fairly strong support when the price falls to the moving averages from above.
Each time PLUG's price has fallen below these moving averages buyers have stepped in, thus causing lower wicks to form. This suggests the market is validating the support of these moving averages.
We can see in the chart below that the moving averages held as support even as the Stochastic RSI oscillated down. This is bullish.
Indeed, PLUG is forming a bull flag pattern on the log-scale, higher-timeframe chart. A bull flag of this nature can signal a potentially lucrative investment opportunity.
For those who read my post on using the money supply to gauge whether an asset is wealth-building, you would know that before entering a long-term investment position in PLUG one should first analyze the asset's chart relative to the money supply. (I've linked to this post in the related ideas below)
In the above chart, we see the performance of PLUG relative to the money supply (M2SL). This chart tells us that throughout much of its history, PLUG was a wealth-losing investment asset since the stock's price moved down over time relative to the money supply. The EMA ribbon largely acted as resistance.
However, the chart above shows that the moving averages are tightening together and that PLUG's price is consolidating within these tightening moving averages. This is a quite bullish sign. If a breakout occurs, an investment in PLUG could prove to be quite lucrative.
In the chart below, I apply Fibonacci levels to the length of the pole that forms the bull flag. We can see a perfect Fibonacci retracement is occurring, as price is finding support at the 0.618 level on the log-adjusted chart.
If the bull flag breaks out and a full Fibonacci spiral occurs, PLUG's price can move dramatically higher in the months and years to come.
In the below chart, I construct the Fibonacci levels using the all-time peak to all-time low. I drew projection arrows to show two plausible growth possibilities.
On a more complex, mathematical analysis, PLUG appears to be priming itself to "jump S-curves".
For a more in-depth analysis on what "jumping S-curves" means, you can read my post on the topic linked below. In short, I explain that price action can be graphically represented as a logistic function. Jumping an S-curve occurs when an inflection point is reached whereafter price begins to explode higher at a nearly exponential rate.
When the price of a company's stock jumps S-curves, there is usually some major impetus with regard to its earnings or profitability that occurs. For PLUG, that impetus could be hydrogen finally becoming a cost-effective form of energy. Hydrogen power is poised to benefit from multiple tailwinds in the years ahead: (1) Higher energy costs are driving capital into the development of alternative energy forms; (2) The transition to sustainable energy will drive investment capital into alternative forms of energy, including hydrogen fuel cells; (3) As hydrogen fuel cells gain massive adoption hydrogen power will become more cost-competitive.
My strategy with PLUG is to accumulate shares in my brokerage and retirement accounts up to a certain defined percentage. I can only ever lose 100% of that defined percentage of my portfolio if I am wrong, but if my analysis is right, the gains may reach as much as 8,000% over the course of years. I know most people on here trade on much shorter timeframes than years, but my opinion is that the greatest wealth-building occurs by staying invested over the long term.
Below are some interesting comparable charts. PLUG's current chart looks similar to Monster's chart in 2000 and AMD's chart in 2018.
What's remarkable about these charts is how little of an effect even recessions had on the stocks' price movements. In the case of Monster, its price remained generally flat, despite the S&P 500 experiencing major declines during the early 2000s recession. In the case of AMD, one of the worst stock market crashes in history (March 2020) is barely apparent on its chart. This lends hope that even if the U.S. or global economy experiences a recession in the years ahead and the S&P 500 declines, perhaps stocks like PLUG will be less affected.
To learn more about hydrogen energy including its advantages and disadvantages, you can check out this video from Bloomberg Quicktake:
www.youtube.com
As always, trade at your own risk. Anything can happen and my analysis can prove completely wrong. Feel free to leave constructive thoughts in the comments below. Thank you.

Time to pull the PLUG?Plug Power - Short Term - We look to Sell at 14.94 (stop at 16.92)
The medium term bias remains bearish. A break of the recent low at 13.68 should result in a further move lower. The sequence for trading is lower lows and highs. The continuation lower in prices through support has been impressive with strong momentum and shows no signs of slowing. Preferred trade is to sell into rallies.
Our profit targets will be 8.01 and 7.50
Resistance: 13.68 / 14.96 / 18.26
Support: 12.70 / 11.90 / 10.92
Please be advised that the information presented on TradingView is provided to Vantage (‘Vantage Global Limited’, ‘we’) by a third-party provider (‘Signal Centre’). Please be reminded that you are solely responsible for the trading decisions on your account. There is a very high degree of risk involved in trading. Any information and/or content is intended entirely for research, educational and informational purposes only and does not constitute investment or consultation advice or investment strategy. The information is not tailored to the investment needs of any specific person and therefore does not involve a consideration of any of the investment objectives, financial situation or needs of any viewer that may receive it. Kindly also note that past performance is not a reliable indicator of future results. Actual results may differ materially from those anticipated in forward-looking or past performance statements. We assume no liability as to the accuracy or completeness of any of the information and/or content provided herein and the Company cannot be held responsible for any omission, mistake nor for any loss or damage including without limitation to any loss of profit which may arise from reliance on any information supplied by Signal Centre.

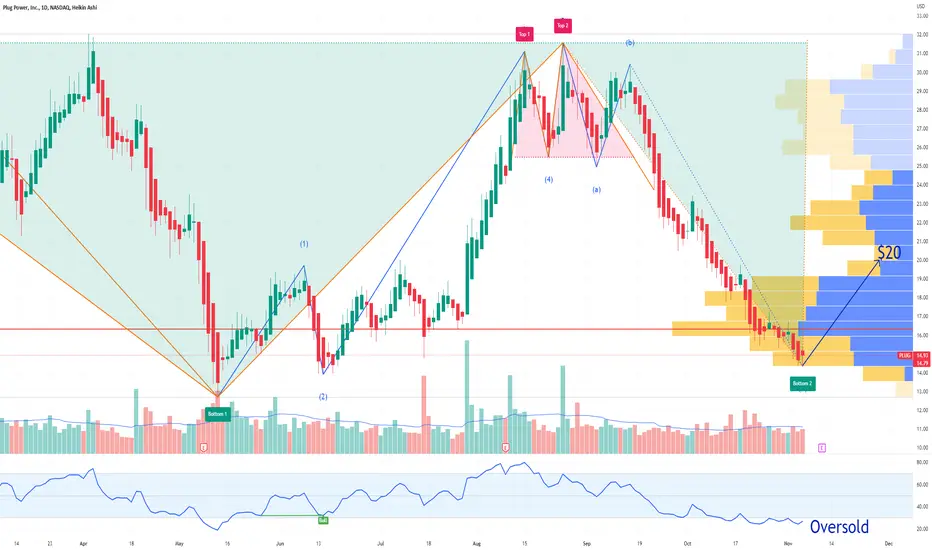
PLUG struggling after a break from IH&S.Plug Power - 30d expiry - We look to Sell at 19.18 (stop at 20.73)
Broken out of the Head and Shoulders formation to the downside.
Our short term bias remains negative.
Bespoke resistance is located at 19.00.
Preferred trade is to sell into rallies.
Daily signals are bearish.
We are trading at oversold extremes.
Our profit targets will be 15.31 and 15.01
Resistance: 16.80 / 18.25 / 19.00
Support: 14.80 / 14.33 / 12.7
Disclaimer – Saxo Bank Group.
Please be reminded – you alone are responsible for your trading – both gains and losses. There is a very high degree of risk involved in trading. The technical analysis , like any and all indicators, strategies, columns, articles and other features accessible on/though this site (including those from Signal Centre) are for informational purposes only and should not be construed as investment advice by you. Such technical analysis are believed to be obtained from sources believed to be reliable, but not warrant their respective completeness or accuracy, or warrant any results from the use of the information. Your use of the technical analysis , as would also your use of any and all mentioned indicators, strategies, columns, articles and all other features, is entirely at your own risk and it is your sole responsibility to evaluate the accuracy, completeness and usefulness (including suitability) of the information. You should assess the risk of any trade with your financial adviser and make your own independent decision(s) regarding any tradable products which may be the subject matter of the technical analysis or any of the said indicators, strategies, columns, articles and all other features.
Please also be reminded that if despite the above, any of the said technical analysis (or any of the said indicators, strategies, columns, articles and other features accessible on/through this site) is found to be advisory or a recommendation; and not merely informational in nature, the same is in any event provided with the intention of being for general circulation and availability only. As such it is not intended to and does not form part of any offer or recommendation directed at you specifically, or have any regard to the investment objectives, financial situation or needs of yourself or any other specific person. Before committing to a trade or investment therefore, please seek advice from a financial or other professional adviser regarding the suitability of the product for you and (where available) read the relevant product offer/description documents, including the risk disclosures. If you do not wish to seek such financial advice, please still exercise your mind and consider carefully whether the product is suitable for you because you alone remain responsible for your trading – both gains and losses.


PLUG Plug Power Options Ahead of Earnings Looking at the PLUG Plug Power options chain ahead of earnings, i would buy the $20 strike price Calls with
2023-3-17 expiration date for about
$1.18 premium.
If the options turn out to be profitable Before the earnings release, i would sell at least 50%.
Looking forward to read your opinion about it.
Another opportunity to PLUG the rally?Short Term
We look to Sell at 29.61 (stop at 33.45)
Preferred trade is to sell into rallies. Prices expected to stall near trend line resistance. In line with the possible early stages of a head & shoulders pattern and the strong rejection of gains, we look to set shorts in anticipation of a swing lower. The medium term bias remains bearish. The reaction higher is positive, however, we view this as an opportunity to set shorts in line with the overall bearish move lower.
Our profit targets will be 17.27 and 14.78
Resistance: 32.00 / 46.60 / 73.40
Support: 20.00 / 16.50 / 12.74
Disclaimer – Saxo Bank Group. Please be reminded – you alone are responsible for your trading – both gains and losses. There is a very high degree of risk involved in trading. The technical analysis , like any and all indicators, strategies, columns, articles and other features accessible on/though this site (including those from Signal Centre) are for informational purposes only and should not be construed as investment advice by you. Such technical analysis are believed to be obtained from sources believed to be reliable, but not warrant their respective completeness or accuracy, or warrant any results from the use of the information. Your use of the technical analysis , as would also your use of any and all mentioned indicators, strategies, columns, articles and all other features, is entirely at your own risk and it is your sole responsibility to evaluate the accuracy, completeness and usefulness (including suitability) of the information. You should assess the risk of any trade with your financial adviser and make your own independent decision(s) regarding any tradable products which may be the subject matter of the technical analysis or any of the said indicators, strategies, columns, articles and all other features.
Please also be reminded that if despite the above, any of the said technical analysis (or any of the said indicators, strategies, columns, articles and other features accessible on/through this site) is found to be advisory or a recommendation; and not merely informational in nature, the same is in any event provided with the intention of being for general circulation and availability only. As such it is not intended to and does not form part of any offer or recommendation directed at you specifically, or have any regard to the investment objectives, financial situation or needs of yourself or any other specific person. Before committing to a trade or investment therefore, please seek advice from a financial or other professional adviser regarding the suitability of the product for you and (where available) read the relevant product offer/description documents, including the risk disclosures. If you do not wish to seek such financial advice, please still exercise your mind and consider carefully whether the product is suitable for you because you alone remain responsible for your trading – both gains and losses.

ENTRY OPPORTUNITY POTENTIAL - NASDAG - PLUG - WEEKLYThan k you for your likes and support - Really appreciate that!
________________________________________________________
The red line horizontal line is a solid historical price support.
The orange horizontal line is the intermediary one and we have seen the market evolving around it and marking important moves from it/to it.
The closer to the red line the better long entry point.
We can see that surge in the price happened followed with a step decrease and some failure in the way down to get out of the pattern.
The energy crisis will potentially find investors looking for alternatives still viable.
What about Hydrogen to become THE alternative of ally of energy consumption alternatives ?
Hydrogen is probably a big buy at the moment.
