PNUTUSDT UPDATEPNUT
UPDATE
PNUT Technical Setup
Pattern: Falling Wedge Pattern
Current Price: $0.0944
Target Price: $0.1616
Target % Gain: 70.20%
Technical Analysis: PNUT is showing a breakout from the falling wedge pattern on the 4h chart, indicating potential bullish momentum. The price has surged above the resistance trendline, supported by an increase in trading volume. This setup is becoming more reliable as the price approaches key resistance areas.
Time Frame: 1D
Risk Management Tip: Always apply proper risk management.
Pnut

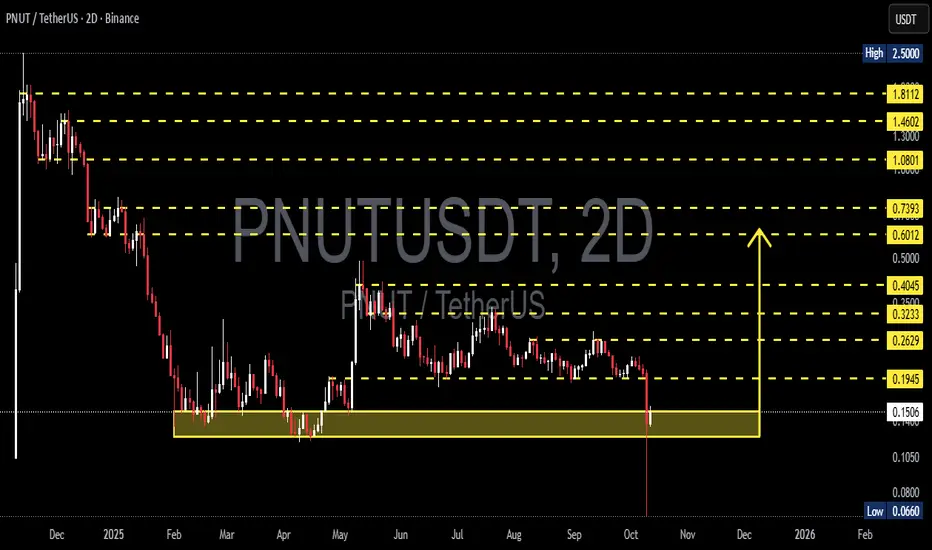
PNUTUSDT — That the Bottom? Liquidity Grab at Key Support Zone?📊 Overview
The PNUT/USDT (2D) chart is entering a critical phase after a long downtrend followed by a retest of a strong demand zone (yellow box). Current price stands at 0.1503 USDT, after forming an extreme wick down to 0.0660, then pulling back strongly — a clear sign of aggressive buyer reaction (liquidity sweep) from the same demand area seen in March–May earlier this year.
This structure often represents a major market turning point: it could either be a temporary bounce or the early stage of a medium-term reversal, depending on how price reacts within this zone.
---
📐 Structure and Key Pattern
1. Formed Pattern:
A potential Double Bottom is developing around 0.11–0.15.
The long lower wick indicates strong absorption of selling pressure.
Price remains in a horizontal accumulation phase after a sharp decline since late 2024.
2. Main Zone (Yellow Box):
Area between 0.11–0.17 serves as macro support and historical demand base.
It has been tested multiple times without a major breakdown candle.
This means buyers are still defending this level aggressively.
3. Key Signal:
Volume spiked during the liquidity sweep, followed by a strong close above support — a sign of a false breakdown or liquidity grab.
Such setups often become the early stage of an impulsive bullish move if confirmed by structure and volume.
---
🚀 Bullish Scenario (Potential Reversal)
Main condition: price must stay inside or above the yellow box and form a higher low on the 2D structure.
A 2D close above 0.1945 would confirm early reversal signs.
Momentum will strengthen if price breaks above 0.2629–0.3233, opening the path toward 0.4045–0.5000.
A breakout beyond these levels would mark the start of a new expansion phase after prolonged accumulation.
🎯 Bullish Targets:
1. 0.1945 → 0.2629 (minor breakout)
2. 0.3233 → 0.4045 (mid-term rally zone)
3. 0.5000+ (macro reversal confirmation)
Note: Strongest confirmation occurs when a 2D candle closes with full body and high volume above the first resistance.
---
⚠️ Bearish Scenario (Extended Breakdown)
If price fails to hold the yellow box, the bearish case remains valid.
A 2D close below 0.110 signals a loss of structural demand.
Downside targets lie at the 0.0660 wick low, with further risk toward 0.05 psychological zone if selling continues.
This would extend the downtrend and potentially lead to a final capitulation phase.
🎯 Bearish Targets:
1. 0.110 (breakdown confirmation)
2. 0.066 (wick low retest)
3. <0.05 (macro capitulation zone)
---
🧭 Conclusion
Currently, PNUT sits at a historical turning point.
Selling pressure appears exhausted, as shown by the deep wick and rapid buyer reaction.
However, without a confirmed breakout above 0.1945, a reversal cannot yet be declared.
The yellow zone remains the line between survival and collapse for the macro structure.
In other words:
> If PNUT holds the yellow zone, the market could witness one of the sharpest mid-cap altcoin rebounds.
But if this support fails, the next drop could be brutal — and fast.
---
🔖 Key Technical Levels
Current Price: 0.1503
Demand Zone (Strong Support): 0.11 – 0.17
Resistance 1: 0.1945
Resistance 2: 0.2629
Resistance 3: 0.3233
Resistance 4: 0.4045
Extreme Low: 0.0660
Historical High: 2.5000
---
#PNUT #PNUTUSDT #CryptoAnalysis #Altcoin #TechnicalAnalysis #SupportAndResistance #LiquiditySweep #ReversalZone #SwingTrade #CryptoTrading #MarketStructure #PriceAction #CryptoSetup
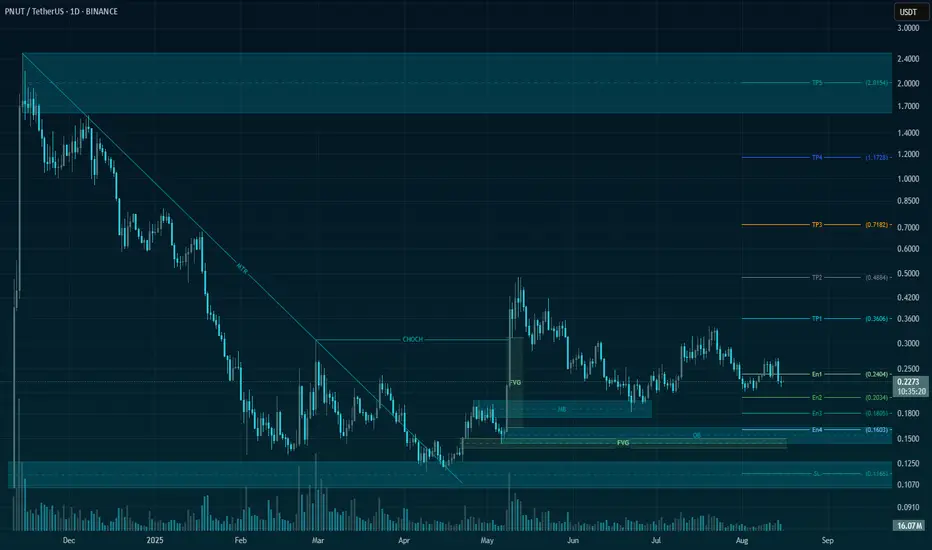
PNUT/USDT – Ready for Takeoff? Bullish Setup Ahead!🚀 Trade Setup Details:
🕯 #PNUT/USDT 🔼 Buy | Long 🔼
⌛️ TimeFrame: 1D
--------------------
🛡 Risk Management:
🛡 If Your Account Balance: $1000
🛡 If Your Loss-Limit: 1%
🛡 Then Your Signal Margin: $25.38
--------------------
☄️ En1: 0.2404 (Amount: $2.54)
☄️ En2: 0.2033 (Amount: $8.88)
☄️ En3: 0.1805 (Amount: $11.42)
☄️ En4: 0.1602 (Amount: $2.54)
--------------------
☄️ If All Entries Are Activated, Then:
☄️ Average.En: 0.1924 ($25.38)
--------------------
☑️ TP1: 0.3606 (+87.42%) (RR:2.22)
☑️ TP2: 0.4884 (+153.85%) (RR:3.9)
☑️ TP3: 0.7182 (+273.28%) (RR:6.94)
☑️ TP4: 1.1731 (+509.72%) (RR:12.94)
☑️ TP5: 2.0164 (+948.02%) (RR:24.06)
☑️ TP6: Open 🔝
--------------------
❌ SL: 0.1166 (-39.4%) (-$10)
--------------------
💯 Maximum.Lev: 1X
⌛️ Trading Type: Swing Trading
‼️ Signal Risk: 🙂 Low-Risk! 🙂
🔎 Technical Analysis Breakdown:
This technical analysis is based on Price Action, Elliott waves, SMC (Smart Money Concepts), and ICT (Inner Circle Trader) concepts. All entry points, Target Points, and Stop Losses are calculated using professional mathematical formulas. As a result, you can have an optimal trade setup based on great risk management.
📊 Sentiment & Market Context:
PNUT, the native token of the Peanut DeFi ecosystem, is showing signs of a potential reversal after a prolonged downtrend. As a micro-cap DeFi project focused on yield farming and liquidity provision, PNUT remains under the radarmaking it a high-risk, high-reward opportunity.
With the overall crypto market regaining bullish momentum and small-cap tokens starting to catch up, PNUT is positioned well for a possible breakout. Low liquidity means sharp moves are possible, and current price action suggests accumulation at key support zones.
This technical setup aligns with a bullish swing trade, targeting a strong upside while maintaining disciplined risk management.
⚠️ Disclaimer:
Trading involves significant risk, and past performance does not guarantee future results. This analysis is for informational purposes only and should not be considered financial advice. Always conduct your research and trade responsibly.
💡 Stay Updated:
Like this technical analysis? Follow me for more in-depth insights, technical setups, and market updates. Let's trade smarter together!
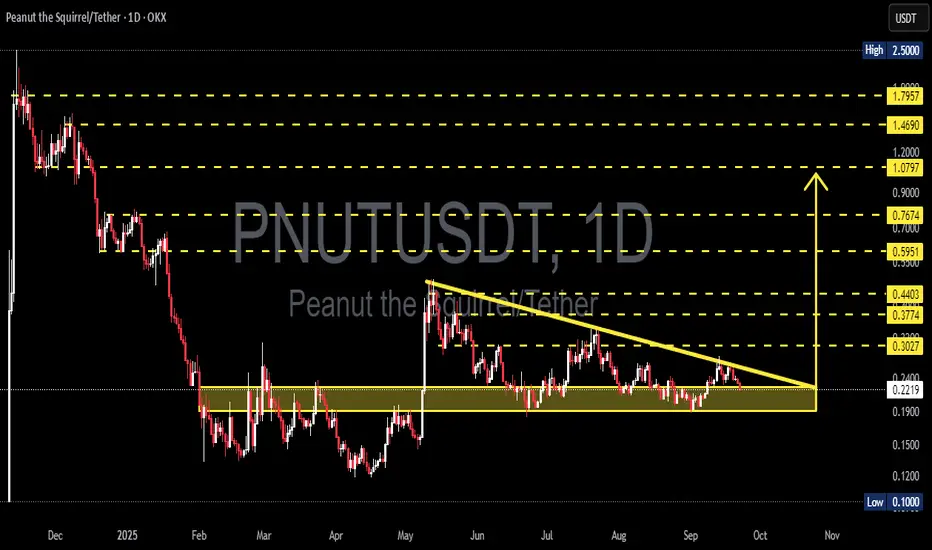
PNUUSDT — Descending Triangle Accumulation Zone: Major Breakout?🔎 Full Analysis
The PNU/USDT (1D) chart shows a clear Descending Triangle pattern that has been forming since May 2025. Price is currently trading around 0.2216 USDT, moving closer to the apex of the pattern — a sign that a big move is likely approaching.
⚙️ Pattern Details
Strong Support (Accumulation Zone): 0.19 – 0.24
This area has been tested multiple times and continues to attract buyers.
Descending Resistance: A downward sloping trendline from May’s high is pressing price lower, forming consecutive lower highs.
Characteristics: While this pattern is typically seen as a bearish continuation, it can also turn into an accumulation base if buyers step in with strong volume.
---
🚀 Bullish Scenario
Confirmation: Daily close above 0.3027 with strong volume.
Step-by-step targets:
First breakout level: 0.3027
Next targets: 0.3774 → 0.415 → 0.4403
Extended target if momentum accelerates: 0.5951
Measured Move Potential: A confirmed breakout projects a move toward 0.415 – 0.44 USDT.
Bullish Narrative: A breakout above the descending trendline could signal the start of a major reversal from long-term accumulation. Buyers regaining control may drive PNU/USDT back toward the 0.40 – 0.60 zone.
---
📉 Bearish Scenario
Confirmation: Daily close below 0.19 with high volume.
Step-by-step targets:
Conservative target: 0.10 USDT (chart low label)
Aggressive measured move target: 0.08 USDT
Bearish Narrative: If 0.19 fails as support, the descending triangle would act as a continuation pattern of the previous downtrend, potentially triggering a deeper breakdown toward 0.10 or even lower.
---
📌 Conclusion
PNU/USDT is at a critical decision point:
Bullish case: Breakout above the trendline could unlock a reversal and rally toward 0.40+.
Bearish case: Breakdown below 0.19 could extend the downtrend to 0.10 or lower.
With price approaching the apex, volatility is expected soon. Traders should wait for daily close + volume confirmation before committing to a position and apply strict risk management to avoid false breakouts.
---
⚡ Key Levels to Watch
Support zone: 0.19 – 0.24
Critical resistance: 0.3027
Breakout targets: 0.3774 → 0.415 → 0.4403 → 0.5951
Breakdown targets: 0.10 – 0.08
---
#PNUT #PNUTUSDT #PeanutTheSquirrel #TechnicalAnalysis #DescendingTriangle #CryptoAnalysis #Altcoin #Breakout #BearishOrBullish #CryptoTrading
PNUT/USDT – On the Edge of Rebound or Breakdown?📌 Overview:
PNUT/USDT is currently at a major inflection point, following a prolonged downtrend and months of consolidation. The price is once again testing the key demand zone that has acted as a solid support since February 2025. Will this be the beginning of a strong bullish reversal, or the start of a deeper breakdown?
---
🧠 Price Action & Market Structure:
Since peaking around $2.50, PNUT has undergone a sharp decline, now hovering near the critical support area of $0.21–$0.23.
This zone has repeatedly acted as a historical accumulation zone, providing strong bounce reactions in the past.
A potential double bottom pattern is forming – if confirmed, it could ignite a bullish trend.
Multiple resistance levels lie ahead, creating a clear roadmap for staged recovery if momentum shifts.
---
🔼 📈 Bullish Scenario – Potential Reversal in Sight:
If the support holds and bullish structure forms (e.g., bullish engulfing, morning star, or higher high breakout), we could see:
1. A strong rebound from the demand zone ($0.21–$0.23), signaling buyer strength.
2. Upside targets:
$0.3027 (initial resistance and trend reversal confirmation)
$0.4403
$0.5951 (strong historical resistance)
$0.7674 to $1.0797 (major psychological zones)
3. A breakout with strong volume and MA crossover (if used) would further validate the trend change.
---
🔽 📉 Bearish Scenario – Breakdown Risk:
If the support zone fails and price breaks below $0.21, the bearish trend could continue:
1. A clear breakdown below the demand zone opens room to:
$0.1700 (minor support)
$0.1300
$0.1000 (historical low and key psychological level)
2. This would invalidate the potential reversal and reinforce the broader distribution phase.
---
📊 Identified Patterns:
Range-Bound / Accumulation Phase: Price has moved sideways between $0.21–$0.44 since February, suggesting accumulation by long-term players.
Potential Double Bottom: Still forming – confirmation needed via a breakout of the neckline.
Descending Trendline Resistance: Remains overhead and may act as a strong barrier if price attempts to climb.
---
🧭 Key Things Traders Should Watch:
Monitor price reaction in the current demand zone over the next few candles.
Look for volume confirmation on any breakout.
Stay aware of Bitcoin’s trend and macro sentiment, as it may influence volatility in altcoins like PNUT.
---
📝 Conclusion:
PNUT/USDT is now trading at a crucial technical level. The price reaction here will determine the mid- to long-term direction of this asset. Traders should prepare for either a strong reversal or a significant breakdown. This area offers a strategic opportunity to assess both risk and reward potential.
#PNUTUSDT #CryptoBreakout #TechnicalAnalysis #AltcoinSetup #CryptoReversal #PriceAction #SupportAndResistance #CryptoUpdate #BullishVsBearish

Peanut the Squirrel 1315% Profits Potential · Technical AnalysisI noticed that most of the memecoins have a strong growth potential. Here we have PNUTUSDT and the potential goes easily beyond 1,300%. An easy target is set to 467% so you can imagine. The chart looks strong and you know we focus only on TA.
Good evening my fellow Cryptocurrency trader, I hope you are having a wonderful day.
Peanut the Squirrel. Who am I to judge? RWA, Layer 1, POW, Gaming, DeFi, Infrastructure, NFT, AI... The choice is yours.
Here we have the classic and more than classic higher low. The bottom low and the bullish breakout ending its retrace higher is as easy and simple as it goes. The beauty of TA. You can know where the market is headed based on how the candles behave.
And then, we are back to the EMAs. Notice the blue one because it is the main one I'll be using on the daily timeframe. The huge big candle happens to break above this level. Once this level is conquered as resistance we know the bulls are on. Now the market can rest but it can also move ahead. We have a higher low, PNUTUSDT, and the action happening above EMA89, EMA55 and EMA13; in short, the bulls win.
The next higher high and first target is $1.03. This is followed by $1.59, 467% potential for growth and then the market can continue higher, easily, because we are entering the strongest ever Cryptocurrency bull market.
Namaste.

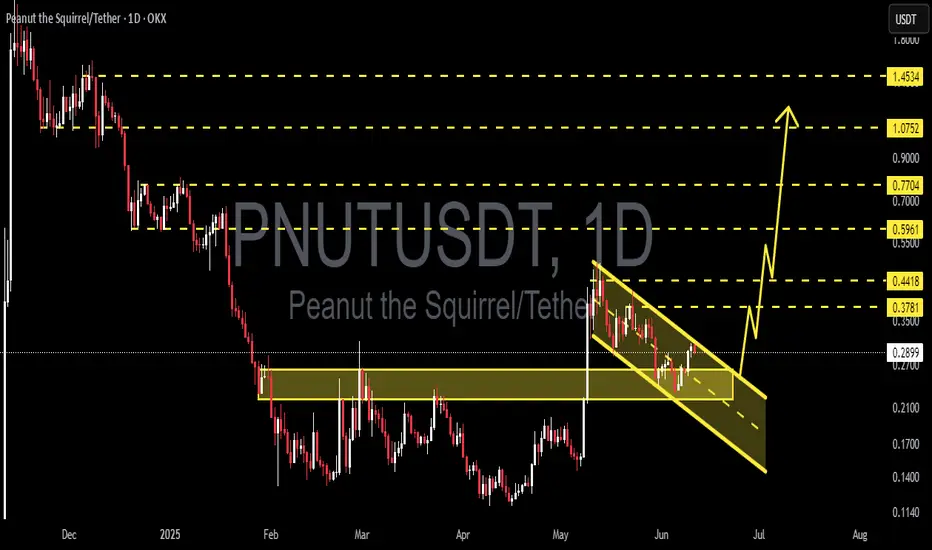
Falling Channel Breakout on PNUT/USDT – Next Stop: $0.76?📊 Pattern Analysis:
Falling Channel (Descending Channel): PNUT formed a clear falling channel from early May to late June 2025. This pattern typically signals a potential bullish reversal once a breakout occurs.
Confirmed Breakout: The price has successfully broken above the upper boundary of the falling channel, which is an early sign of a potential bullish trend.
Strong Support Zone: The horizontal zone around $0.20 – $0.26 USDT has acted as a solid demand base, as seen multiple times from March to June.
✅ Bullish Scenario:
If the breakout continues with momentum, the price could move upward gradually, aiming for the following resistance levels:
1. Target 1: $0.2986 – Minor resistance
2. Target 2: $0.3774 – Previous consolidation area
3. Target 3: $0.4403 – Major historical resistance
4. Target 4: $0.5951 to $0.7674 – Recovery zone from the falling channel
5. Extended Target (Long-Term): $1.0797 to $1.7957 (if a full rally occurs with strong bullish sentiment)
❌ Bearish Scenario:
If the price fails to hold the breakout and re-enters the channel:
Potential drop back to the support zone of $0.2000 - $0.1600
A breakdown below this range may lead to further downside toward $0.1300 to $0.1000 (previous historical low)
🔍 Summary:
The chart displays a classic bullish reversal pattern with a confirmed breakout from the falling channel.
The $0.26–$0.29 area now acts as a key confirmation zone. If the price holds above it and completes a successful retest, the bullish continuation is likely.
However, traders should stay cautious of false breakouts.
#PNUTUSDT #CryptoBreakout #AltcoinSeason #ChartAnalysis #BullishReversal #TechnicalAnalysis #BreakoutTrading #CryptoSignals #DescendingChannel

PNUTUSDT 1D Analysis PNUT ~ 1D Analysis
#PNUT Buy when retesting this support block or buy after successfully breaking this resistance line with a short-term target of at least 15%++
PNUT/USDT – Bullish Breakout from Falling Channel!PNUT Breakout Alert – 200% Potential on the Table
Hey Traders — if you're into high-conviction setups with real momentum, this one’s for you.
PNUT has officially broken out of a textbook falling channel after a healthy consolidation. This pattern often signals trend reversal and renewed bullish momentum — and PNUT looks ready to move.
🔹 Pattern: Falling Channel
🔹 Breakout Confirmation: Clear candle close above resistance
🔹 Previous Move: +204% before entering the channel
🔹 Current Setup: Long entry with defined risk-to-reward
🔹 Target: ~0.85
🔹 Stop: Just below the breakout zone
🧠 Technical Perspective:
Volume uptick during breakout confirms buyer strength
Strong support retest zone around 0.28–0.29
Holding above this range could fuel a significant leg higher
📌 This setup offers a clean structure with a high R:R potential. PNUT has proven it can move fast — now it’s about following the breakout with tight risk management.
📥 Add to your watchlist and let price action lead the way.

PNUTUSDTA Falling Wedge (Bearish) pattern has breakout the resistance, and it is targeting $0.45 with a profit of 65% on the 4-hour chart.

PNUT projects to a Dollar.TWO Clear patterns
Double bottom
and a Bull Flag.
Two respective Log Projections for you to consider.
This suggest strong Solana performance is incoming and another round of #Memecoin frenzy.

PNUTUSDT – Breakout Brewing from Bullish Pennant!PNUT Bullish pennant Formation – 200%+ Potential Incoming?! 👀🔥
Hey Traders! If you're all about high-conviction plays and real alpha, smash that 👍 and tap Follow for more setups that actually deliver!
PNUT is consolidating inside a bull pennant after a massive 200%+ rally earlier this month. Currently, it's sitting near the lower support zone, forming higher lows—a sign of growing pressure for an upside move.
🔍 Setup Highlights:
Bull Pennant forming
Strong bounce zone (green box)
Potential breakout path marked in projection
📌 Trade Idea:
Entry: $0.31–$0.28 support zone
Targets: $0.39 / $0.46 / $0.55 / $0.72
SL: Below $0.27
Leverage: 5x–10x (only for experienced traders)
Keep a close eye—once PNUT clears the triangle resistance, things could move fast.
What are your thoughts?

PNUTUSDT 12H AnalysisPNUT ~ 12H Analysis
#PNUT Buy after breaking this resistance line with a short term target of at least 15%+ and a long term target of $1.07++

PNUT Reversal Arc: From Panic Low to 120% Rebound Potentia
The PNUT/TetherUS daily chart from May 10, 2025, presents a compelling case for a powerful recovery rally, despite today's sharp correction (-12.87% on 364.19M volume). While current price action appears bearish at first glance, the broader technical structure reveals an exceptional buying opportunity forming.
--- The Macro Technical Framework ---
The chart shows PNUT has been trading within a well-defined ascending channel (white boundaries) since the January 2025 low. What makes this pattern particularly significant is the recent development:
1. Major Breakout + Pullback Scenario - After breaking out from months of consolidation, PNUT has experienced a sharp pullback, creating the classic "shakeout before the breakout" pattern that often precedes major moves
2. Historical Supply/Demand Zone (purple rectangle) - The 0.55-0.60 region that previously acted as strong support before the late 2024 breakdown
3. Structural Support Level (gray horizontal line) - Additional confirmation of support around the 0.22 level
--- Technical Analysis: The Pendulum Swing Setup ---
The recent price action follows a textbook reversal pattern:
Phase 1: Accumulation & Breakout - The extended consolidation from January through April 2025, followed by the explosive green candle breaking above the channel's midline
Phase 2: Current Shakeout - Today's sharp 12.87% decline represents a classic shakeout move, designed to clear out weak hands before the next leg up
Phase 3: Projected Recovery (blue pathway) - The anticipated price movement shows:
- Pullback to the 0.2213 entry zone (confluence of channel support and horizontal support)
- Series of higher lows and higher highs as the pattern develops
- Ultimate target at 0.4671, representing a 111% gain from the projected entry
--- Why This Pattern Is Particularly Compelling ---
Three key factors make this setup exceptionally attractive:
1. Volume Profile Analysis - Despite today's negative price action, the volume signature shows characteristics of a selling climax rather than distribution, indicating potential exhaustion of sellers
2. Channel Integrity - The lower boundary of the ascending channel has held on multiple tests since January, establishing its significance as structural support
3. Historical Precedent - Similar pattern formations in PNUT during 2024 resulted in significant rallies after comparable shakeout moves
--- Strategic Entry Approach ---
The optimal strategy for this opportunity involves:
1. Waiting for the projected pullback to the 0.22 level, which provides both technical confluence and an excellent risk-reward ratio
2. Using a stop loss below the channel boundary (approximately 0.19) for clear invalidation
3. Taking partial profits at the mid-channel area (around 0.33) before allowing the remainder to run toward the 0.46 target
4H VIEW HERE
This technical setup suggests PNUT is preparing for a significant recovery rally over the coming weeks, offering a well-defined opportunity with precise entry, target, and invalidation levels.
HELP US WITH LIKE AND FOLLOW GUYS .. THANK YOU

#PNUT/USDT#PNUT
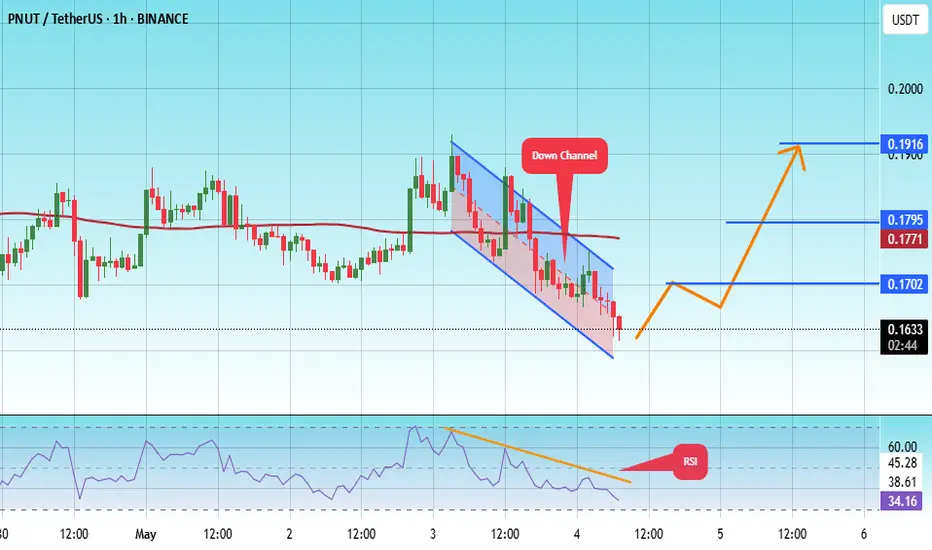
The price is moving within a descending channel on the 1-hour frame, adhering well to it, and is on its way to breaking it strongly upwards and retesting it.
We are seeing a bounce from the lower boundary of the descending channel, which is support at 0.1595.
We have a downtrend on the RSI indicator that is about to break and retest, supporting the upward trend.
We are looking for stability above the 100 Moving Average.
Entry price: 0.1633
First target: 0.1700
Second target: 0.1771
Third target: 0.1916
PNUT/USDT: FALLING WEDGE BREAKOUT ALERT!!🚀 PNUT Breakout Alert – 100%+ Potential Incoming?! 👀🔥
Hey Traders! If you're all about high-conviction plays and real alpha, smash that 👍 and tap Follow for more setups that actually deliver! 💹💯
PNUT has officially broken out of a falling wedge structure — a bullish reversal pattern we've been eyeing for weeks! After weeks of consolidation and pressure along the wedge resistance, the price has now made a clean breakout with increasing volume.
🔹 Last time it broke out from this zone, we witnessed a massive 109% move.
🔹 Currently, it’s showing a similar breakout structure with room for a big upside move.
🔵 Entry Zone: $0.158–$0.162
🎯 Targets:
• Target 1: $0.21
• Target 2: $0.27
• Target 3: $0.31+
🛑 Stop-loss: $0.142
📊 Leverage: 3x–5x (low to moderate risk)
⚠️ As always, manage your risk and don’t chase pumps. Setup looks strong as long as the breakout holds and we don’t see a fakeout candle back inside the wedge.
📍Let me know what you think — will PNUT fly again?

FIO is ready for the trendLarge-cap coins showed growth yesterday following the tops, and memcoin bullying is subsiding today, followed by a high probability of bullying in the remaining altcoin market. I expect the main day of growth tomorrow until Sunday afternoon, then the probability of a major pullback prevails until the middle of the new week.
Today, fio, which I considered for work in the first place, continues to accelerate growth. The main goal is to retest the key level of 0.025, which will open the way up to 0.50-75. We can see a repeated breakdown and consolidation above today. If the second half of the month opens above the level by June, the fio may move into the range of 0.045-60. With sufficient volatility, a test of this range is likely tomorrow.
After working fio and chess up to 60-90% from current levels as the most undervalued assets in finance today, quick adx pivx can be additionally considered for scalping. There is also a high probability of a new blizzard on atm city acm fantokens with new hays.

Testing Red Resistance – Breakout Potential!🚀 $PNUT Testing Red Resistance – Breakout Potential! 📈
$PNUT is currently testing the red resistance zone. If the price breaks through, the first target could be the green line level! 📊
Let’s catch this breakout together! 💼💸

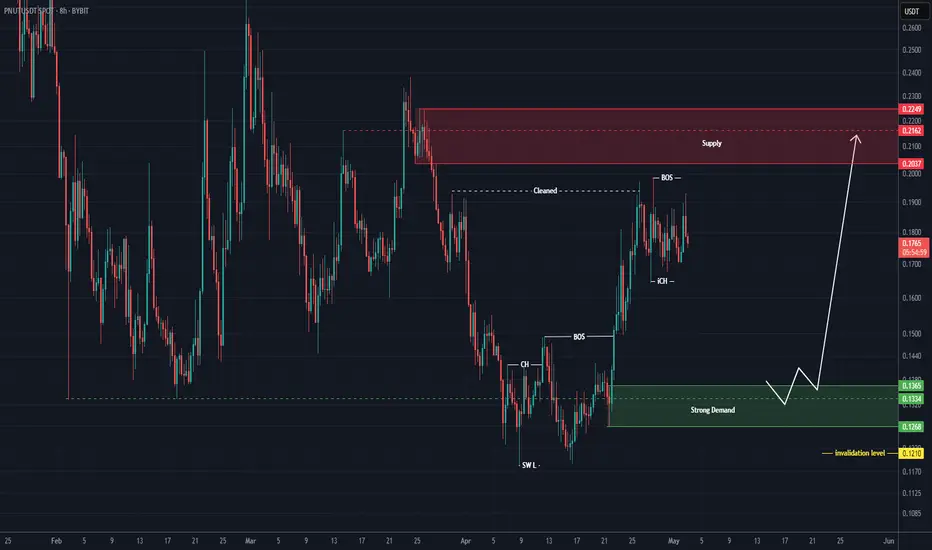
Strong rebuy setup for PNUT (8H)Note: This is not a sell/short setup | it is a buy/long setup.
After clearing resistance order blocks and a strong bullish move, buyers seem to have exhausted their momentum and may need a retracement for price to return to their base.
We are looking for a rebuy within the green zone. The price is likely to move from this area toward the red box.
A daily candle closing below the invalidation level will invalidate this analysis.
For risk management, please don't forget stop loss and capital management
Comment if you have any questions
Thank You
PNUTUSDT Analysis D1PNUTUSDT Building Up For Solid Breakout, Test Descending Trendline & On Verge Of Solid Breakout, usually This Type Consolidation Under Resistance Lead Massive Breakout, Expecting 2x After Breakout.

PNUTUSDT Ready to Rally!PNUTUSDT Technical analysis update
PNUTUSDT is breaking out of a wedge pattern on the daily chart after three months of formation. We also observed a bullish RSI divergence in the daily timeframe, along with a MACD bullish crossover a few days ago. A 50–100% move could be seen in the mid-term.

PNUTUSDT 1D AnalysisPNUT ~ 1D Analysis
#PNUT Buy gradually from here with a short -term target of at least 10%+ from here.

PNUT / USDT – Daily AnalysisBullish divergence spotted!
Price is printing lower lows, but RSI is making higher lows — a classic bullish divergence pattern. This signals potential trend exhaustion on the downside.
#PNUT is holding above a horizontal support level around 0.12–0.13 USDT, aligning with the divergence signal.
Volume is tapering off, indicating decreasing selling pressure.
RSI is currently around 37–38 and showing a higher low structure.
Key levels to watch:
Support: 0.1220–0.1300 USDT (current demand zone).
Resistance: 0.1650 USDT (local high), followed by stronger resistance at 0.2000–0.2200 USDT.
Scenario ideas:
If PNUT can hold above support and RSI continues climbing, we might see a relief rally towards the next resistance zones.
A breakdown below 0.1220 would invalidate this bullish setup and could lead to continuation of the downtrend. Still... bullish divergence then will become even more obvious....
Bias:
bullish short-term, watching for confirmation.
⚠️ Not financial advice. Always manage your risk!
#PNUT #Crypto #Altcoins #BullishDivergence #RSI #TradingView
