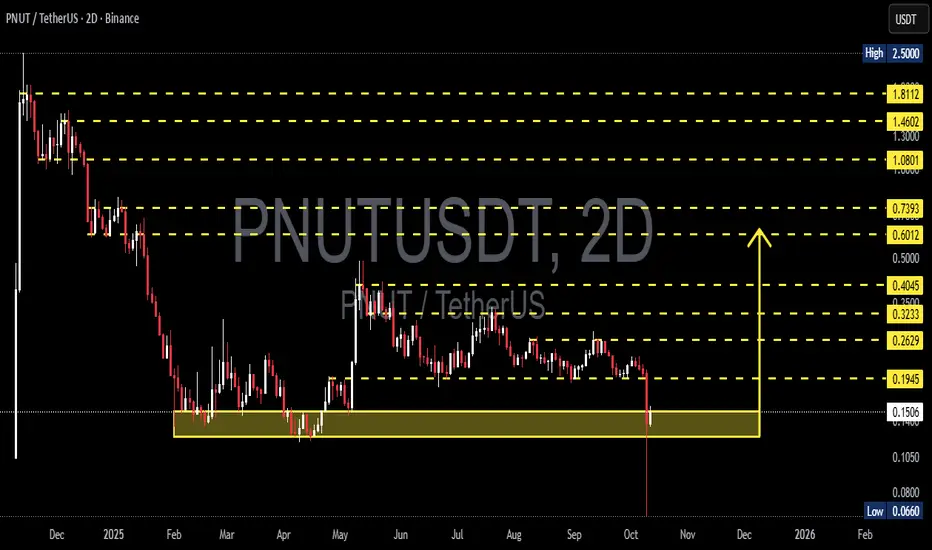
PNUTUSDT — That the Bottom? Liquidity Grab at Key Support Zone?📊 Overview
The PNUT/USDT (2D) chart is entering a critical phase after a long downtrend followed by a retest of a strong demand zone (yellow box). Current price stands at 0.1503 USDT, after forming an extreme wick down to 0.0660, then pulling back strongly — a clear sign of aggressive buyer reaction (liquidity sweep) from the same demand area seen in March–May earlier this year.
This structure often represents a major market turning point: it could either be a temporary bounce or the early stage of a medium-term reversal, depending on how price reacts within this zone.
---
📐 Structure and Key Pattern
1. Formed Pattern:
A potential Double Bottom is developing around 0.11–0.15.
The long lower wick indicates strong absorption of selling pressure.
Price remains in a horizontal accumulation phase after a sharp decline since late 2024.
2. Main Zone (Yellow Box):
Area between 0.11–0.17 serves as macro support and historical demand base.
It has been tested multiple times without a major breakdown candle.
This means buyers are still defending this level aggressively.
3. Key Signal:
Volume spiked during the liquidity sweep, followed by a strong close above support — a sign of a false breakdown or liquidity grab.
Such setups often become the early stage of an impulsive bullish move if confirmed by structure and volume.
---
🚀 Bullish Scenario (Potential Reversal)
Main condition: price must stay inside or above the yellow box and form a higher low on the 2D structure.
A 2D close above 0.1945 would confirm early reversal signs.
Momentum will strengthen if price breaks above 0.2629–0.3233, opening the path toward 0.4045–0.5000.
A breakout beyond these levels would mark the start of a new expansion phase after prolonged accumulation.
🎯 Bullish Targets:
1. 0.1945 → 0.2629 (minor breakout)
2. 0.3233 → 0.4045 (mid-term rally zone)
3. 0.5000+ (macro reversal confirmation)
Note: Strongest confirmation occurs when a 2D candle closes with full body and high volume above the first resistance.
---
⚠️ Bearish Scenario (Extended Breakdown)
If price fails to hold the yellow box, the bearish case remains valid.
A 2D close below 0.110 signals a loss of structural demand.
Downside targets lie at the 0.0660 wick low, with further risk toward 0.05 psychological zone if selling continues.
This would extend the downtrend and potentially lead to a final capitulation phase.
🎯 Bearish Targets:
1. 0.110 (breakdown confirmation)
2. 0.066 (wick low retest)
3. <0.05 (macro capitulation zone)
---
🧭 Conclusion
Currently, PNUT sits at a historical turning point.
Selling pressure appears exhausted, as shown by the deep wick and rapid buyer reaction.
However, without a confirmed breakout above 0.1945, a reversal cannot yet be declared.
The yellow zone remains the line between survival and collapse for the macro structure.
In other words:
> If PNUT holds the yellow zone, the market could witness one of the sharpest mid-cap altcoin rebounds.
But if this support fails, the next drop could be brutal — and fast.
---
🔖 Key Technical Levels
Current Price: 0.1503
Demand Zone (Strong Support): 0.11 – 0.17
Resistance 1: 0.1945
Resistance 2: 0.2629
Resistance 3: 0.3233
Resistance 4: 0.4045
Extreme Low: 0.0660
Historical High: 2.5000
---
#PNUT #PNUTUSDT #CryptoAnalysis #Altcoin #TechnicalAnalysis #SupportAndResistance #LiquiditySweep #ReversalZone #SwingTrade #CryptoTrading #MarketStructure #PriceAction #CryptoSetup
Pnutlong
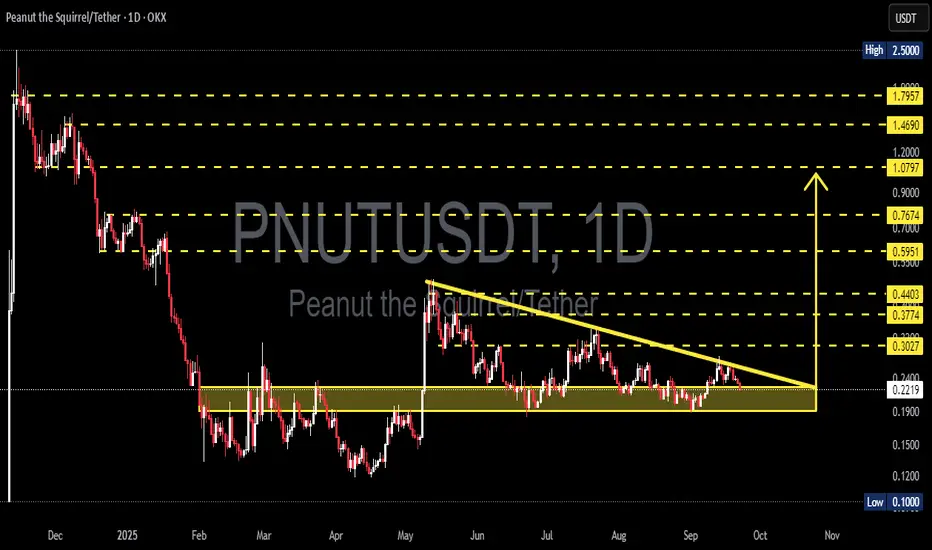
PNUUSDT — Descending Triangle Accumulation Zone: Major Breakout?🔎 Full Analysis
The PNU/USDT (1D) chart shows a clear Descending Triangle pattern that has been forming since May 2025. Price is currently trading around 0.2216 USDT, moving closer to the apex of the pattern — a sign that a big move is likely approaching.
⚙️ Pattern Details
Strong Support (Accumulation Zone): 0.19 – 0.24
This area has been tested multiple times and continues to attract buyers.
Descending Resistance: A downward sloping trendline from May’s high is pressing price lower, forming consecutive lower highs.
Characteristics: While this pattern is typically seen as a bearish continuation, it can also turn into an accumulation base if buyers step in with strong volume.
---
🚀 Bullish Scenario
Confirmation: Daily close above 0.3027 with strong volume.
Step-by-step targets:
First breakout level: 0.3027
Next targets: 0.3774 → 0.415 → 0.4403
Extended target if momentum accelerates: 0.5951
Measured Move Potential: A confirmed breakout projects a move toward 0.415 – 0.44 USDT.
Bullish Narrative: A breakout above the descending trendline could signal the start of a major reversal from long-term accumulation. Buyers regaining control may drive PNU/USDT back toward the 0.40 – 0.60 zone.
---
📉 Bearish Scenario
Confirmation: Daily close below 0.19 with high volume.
Step-by-step targets:
Conservative target: 0.10 USDT (chart low label)
Aggressive measured move target: 0.08 USDT
Bearish Narrative: If 0.19 fails as support, the descending triangle would act as a continuation pattern of the previous downtrend, potentially triggering a deeper breakdown toward 0.10 or even lower.
---
📌 Conclusion
PNU/USDT is at a critical decision point:
Bullish case: Breakout above the trendline could unlock a reversal and rally toward 0.40+.
Bearish case: Breakdown below 0.19 could extend the downtrend to 0.10 or lower.
With price approaching the apex, volatility is expected soon. Traders should wait for daily close + volume confirmation before committing to a position and apply strict risk management to avoid false breakouts.
---
⚡ Key Levels to Watch
Support zone: 0.19 – 0.24
Critical resistance: 0.3027
Breakout targets: 0.3774 → 0.415 → 0.4403 → 0.5951
Breakdown targets: 0.10 – 0.08
---
#PNUT #PNUTUSDT #PeanutTheSquirrel #TechnicalAnalysis #DescendingTriangle #CryptoAnalysis #Altcoin #Breakout #BearishOrBullish #CryptoTrading
PNUT/USDT – On the Edge of Rebound or Breakdown?📌 Overview:
PNUT/USDT is currently at a major inflection point, following a prolonged downtrend and months of consolidation. The price is once again testing the key demand zone that has acted as a solid support since February 2025. Will this be the beginning of a strong bullish reversal, or the start of a deeper breakdown?
---
🧠 Price Action & Market Structure:
Since peaking around $2.50, PNUT has undergone a sharp decline, now hovering near the critical support area of $0.21–$0.23.
This zone has repeatedly acted as a historical accumulation zone, providing strong bounce reactions in the past.
A potential double bottom pattern is forming – if confirmed, it could ignite a bullish trend.
Multiple resistance levels lie ahead, creating a clear roadmap for staged recovery if momentum shifts.
---
🔼 📈 Bullish Scenario – Potential Reversal in Sight:
If the support holds and bullish structure forms (e.g., bullish engulfing, morning star, or higher high breakout), we could see:
1. A strong rebound from the demand zone ($0.21–$0.23), signaling buyer strength.
2. Upside targets:
$0.3027 (initial resistance and trend reversal confirmation)
$0.4403
$0.5951 (strong historical resistance)
$0.7674 to $1.0797 (major psychological zones)
3. A breakout with strong volume and MA crossover (if used) would further validate the trend change.
---
🔽 📉 Bearish Scenario – Breakdown Risk:
If the support zone fails and price breaks below $0.21, the bearish trend could continue:
1. A clear breakdown below the demand zone opens room to:
$0.1700 (minor support)
$0.1300
$0.1000 (historical low and key psychological level)
2. This would invalidate the potential reversal and reinforce the broader distribution phase.
---
📊 Identified Patterns:
Range-Bound / Accumulation Phase: Price has moved sideways between $0.21–$0.44 since February, suggesting accumulation by long-term players.
Potential Double Bottom: Still forming – confirmation needed via a breakout of the neckline.
Descending Trendline Resistance: Remains overhead and may act as a strong barrier if price attempts to climb.
---
🧭 Key Things Traders Should Watch:
Monitor price reaction in the current demand zone over the next few candles.
Look for volume confirmation on any breakout.
Stay aware of Bitcoin’s trend and macro sentiment, as it may influence volatility in altcoins like PNUT.
---
📝 Conclusion:
PNUT/USDT is now trading at a crucial technical level. The price reaction here will determine the mid- to long-term direction of this asset. Traders should prepare for either a strong reversal or a significant breakdown. This area offers a strategic opportunity to assess both risk and reward potential.
#PNUTUSDT #CryptoBreakout #TechnicalAnalysis #AltcoinSetup #CryptoReversal #PriceAction #SupportAndResistance #CryptoUpdate #BullishVsBearish

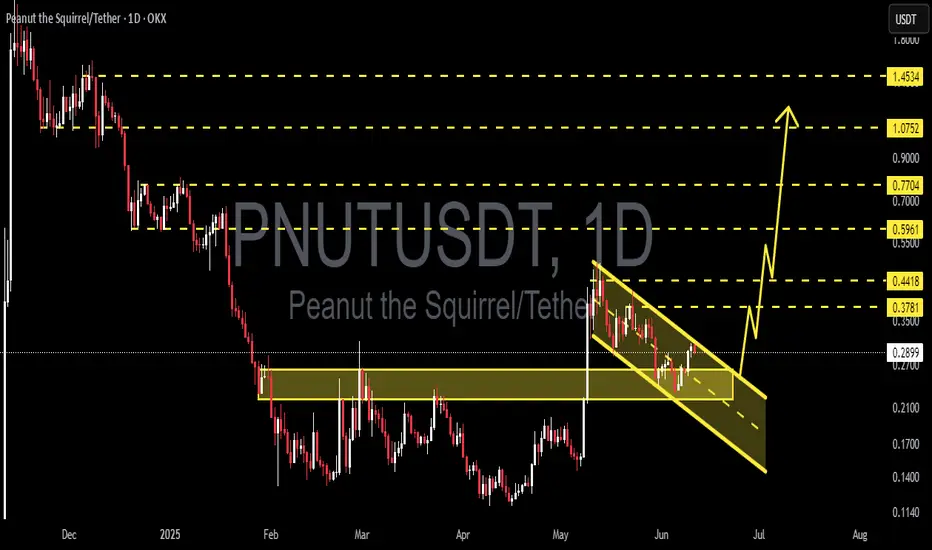
Falling Channel Breakout on PNUT/USDT – Next Stop: $0.76?📊 Pattern Analysis:
Falling Channel (Descending Channel): PNUT formed a clear falling channel from early May to late June 2025. This pattern typically signals a potential bullish reversal once a breakout occurs.
Confirmed Breakout: The price has successfully broken above the upper boundary of the falling channel, which is an early sign of a potential bullish trend.
Strong Support Zone: The horizontal zone around $0.20 – $0.26 USDT has acted as a solid demand base, as seen multiple times from March to June.
✅ Bullish Scenario:
If the breakout continues with momentum, the price could move upward gradually, aiming for the following resistance levels:
1. Target 1: $0.2986 – Minor resistance
2. Target 2: $0.3774 – Previous consolidation area
3. Target 3: $0.4403 – Major historical resistance
4. Target 4: $0.5951 to $0.7674 – Recovery zone from the falling channel
5. Extended Target (Long-Term): $1.0797 to $1.7957 (if a full rally occurs with strong bullish sentiment)
❌ Bearish Scenario:
If the price fails to hold the breakout and re-enters the channel:
Potential drop back to the support zone of $0.2000 - $0.1600
A breakdown below this range may lead to further downside toward $0.1300 to $0.1000 (previous historical low)
🔍 Summary:
The chart displays a classic bullish reversal pattern with a confirmed breakout from the falling channel.
The $0.26–$0.29 area now acts as a key confirmation zone. If the price holds above it and completes a successful retest, the bullish continuation is likely.
However, traders should stay cautious of false breakouts.
#PNUTUSDT #CryptoBreakout #AltcoinSeason #ChartAnalysis #BullishReversal #TechnicalAnalysis #BreakoutTrading #CryptoSignals #DescendingChannel

PNUTUSDT 1D Analysis PNUT ~ 1D Analysis
#PNUT Buy when retesting this support block or buy after successfully breaking this resistance line with a short-term target of at least 15%++
PNUTUSDT 12H AnalysisPNUT ~ 12H Analysis
#PNUT Buy after breaking this resistance line with a short term target of at least 15%+ and a long term target of $1.07++

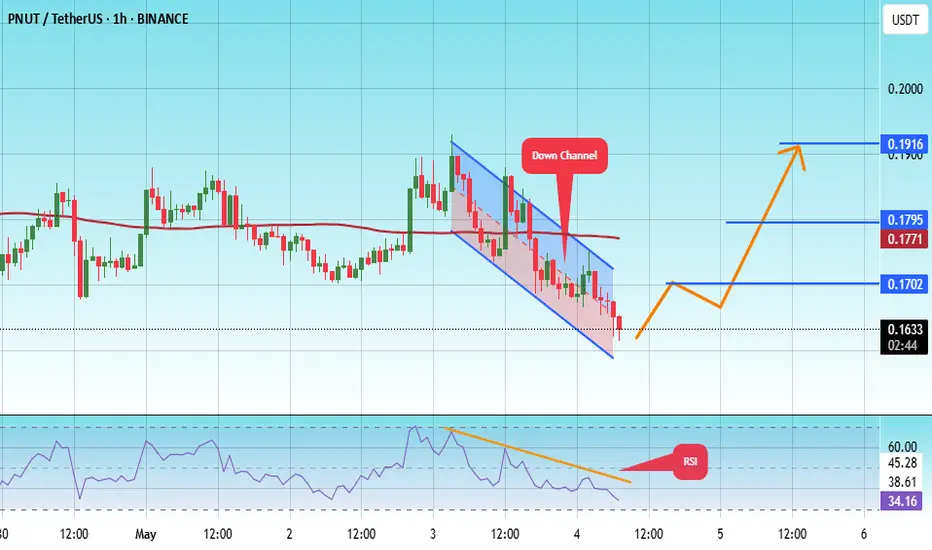
#PNUT/USDT#PNUT
The price is moving within a descending channel on the 1-hour frame, adhering well to it, and is on its way to breaking it strongly upwards and retesting it.
We are seeing a bounce from the lower boundary of the descending channel, which is support at 0.1595.
We have a downtrend on the RSI indicator that is about to break and retest, supporting the upward trend.
We are looking for stability above the 100 Moving Average.
Entry price: 0.1633
First target: 0.1700
Second target: 0.1771
Third target: 0.1916
PNUTUSDT 1D AnalysisPNUT ~ 1D Analysis
#PNUT Buy gradually from here with a short -term target of at least 10%+ from here.

PNUTUSDT 1DPNUT ~ 1D Analysis
#PNUT Buy after successfully penetrating this resistant line or buy after re -testing this support block with a short -term target of at least 15%+.

PNUTUSDT 12HPNUT ~ 12H
#PNUT One of these support blocks will bounce the price for this coin.
If you still have Conviction on this coin,. Buy on retest of this support

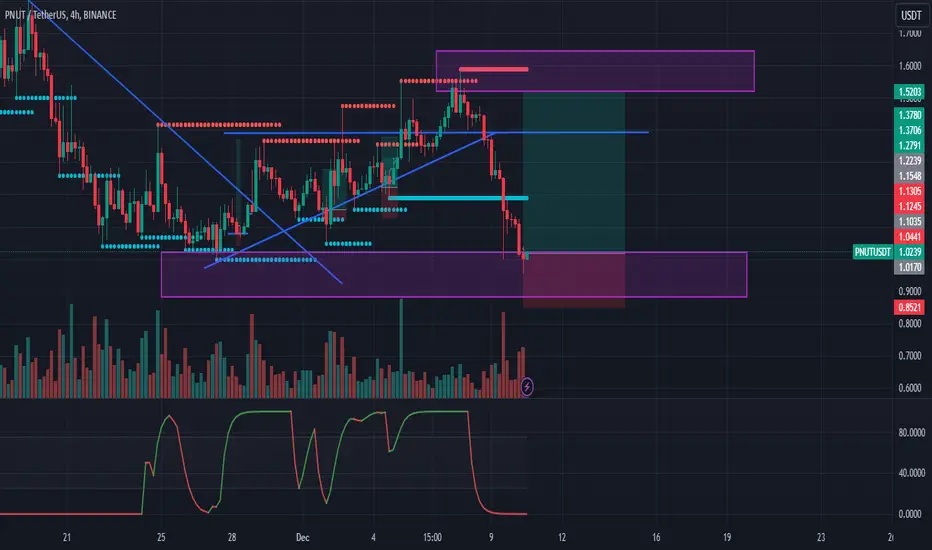
PNUT - LONGRisky but high profit entry. Let's give it another chance to PNUT. Be very careful as it's risky.
TP 1: 1.13
TP 2: 1.38

PNUT/USDT LONG TRADE SETUP !!This is a long trade setup for PNUT/USDT with specific entry, stop-loss, target, and leverage details:
Entry: Current Market Price (CMP) and $0.7230
Stop-Loss: $0.7027
Target: $0.8040
Leverage: 5x to 10x
Let me know if you’d like further assistance or adjustments!
DYOR. NFA

PNUT - LONG - Re-entry*This is a re-entry of my other idea. This trade is quite risky so you should not use too much capital. I even think about closing at target 1 if I see a lot of resistance.
Now we do have a better opportunity to enter (see related publications). We are in a good place to resume and make a reentry of the previous trade.
Until it breaks 1.18 or 1.20, it could remain bearish down to 1.0. So, it’s just speculation right now, but my target is 1.38, where I would take a partial profit of 50% or 75%, or close the position if there is a lot of rejection. But I plan to protect it soon, if it breaks 1.14. Still, nothing is certain yet, it remains bearish. So we have to be very careful.
Targets:
T1: 1.38
T2: 1.55
Stops:
0.98 (4 hours)
0.95 (swing/days)

PNUT - Re-entry - LONG*This is a re-entry of my other idea. This trade is quite risky so you should not use too much capital. I even think about closing at target 1 if I see a lot of resistance.
Now we do have a better opportunity to enter (see related publications). We are in a good place to resume and make a reentry of the previous trade.
T1: 1.38
T2: 1.55

PNUT - Re-entry - LONG - 4 hourNow we do have a better opportunity to enter (see related publications). We are in a good place to resume and make a reentry of the previous trade.
T1: 1.38
T2: 1.52

PNUT - Strong Support - LONG - 4 hour*This is a new setup, better confirmed but very risky with a very tight stop. Be careful.
We are at a strong support level. Get ready for a significant move. If BTC doesn't have an impact, we could reach a favorable price level.
T1: 1.18 - 1.20 (protect trade) - 4 hour
T2: 1.35 (partial or close) - 4 hour
T3: 1.50 (close) - daily

PNUT - Strong Support - LONG We are at a strong support level. Get ready for a significant move. If BTC doesn't have an impact, we could reach a favorable price level.
T1: 1.18 - 1.20 (protect trade) - 4 hour
T2: 1.35 (partial or close) - 4 hour
T2: 1.50 (close) - daily
Stoploss: 0.85 (4 hour) or 0.75 (daily)