POL/USDT — Market StructureThe MATIC → POL rebrand didn’t help: price is down 86% YoY.
During this period, a descending channel formed, and price is now holding below the channel midline.
RSI shows a bullish divergence after extreme oversold conditions.
This is a strong bullish trigger, but it’s important to remember: it can play out with a significant delay.
Last time, the reversal took over two months and only occurred after a double divergence formed.
How to trade it:
• Aggressive: buy at current levels with a stop below the low.
• Safer: wait for a reclaim and hold above the channel midline, then enter with a stop below the low.
🎯 Primary target: the upper boundary of the channel.
Higher targets make sense only after a confirmed breakout above it.
POL

TradeCityPro | POL Near Key Trigger in Ongoing Downtrend👋 Welcome to TradeCity Pro!
In this analysis, I’ll review POL, one of Ethereum’s Layer-2 ecosystem projects, currently ranked 52nd on CoinMarketCap with a market cap of $1.41 billion.
⏳ 4-Hour Timeframe
POL is currently in a downtrend on the 4-hour timeframe and is now moving inside a corrective range within that trend.
🔔 This downtrend continued until the 0.1311 support zone, and after reaching this level, the price began a corrective move upward, retracing up to 0.1391.
📊 Throughout this correction, volume has been decreasing, which is expected and also confirms that sellers still have control of the overall trend.
✨ Given the bearish trend and volume confirmation, opening a short position remains the more logical strategy for now.
💥 On the RSI, we have a support level at 39.60.
A break below this level would be the first sign of a new bearish wave beginning.
📉 The main short trigger on POL is 0.1311.
If this trigger breaks with increasing volume, the downtrend can easily continue.
🧩 For long positions, it’s too early, the market needs to show a clear trend reversal first.
To confirm a reversal, the price must stabilize above 0.1391 and form a higher high and higher low above this zone.
⭐ However, if buying volume begins to increase inside the current range and bullish candles become stronger than the bearish ones, the chances of a trend reversal rise — and in that scenario, a break of 0.1391 can act as an early long trigger.
📝 Final Thoughts
Stay calm, trade wisely, and let's capture the market's best opportunities!
This analysis reflects our opinions and is not financial advice.
Share your thoughts in the comments, and don’t forget to share this analysis with your friends! ❤️

TradeCityPro | POL Faces Crucial Resistance Test👋 Welcome to TradeCity Pro!
In this analysis, I’m going to review POL, one of Ethereum’s Layer 2 projects, currently ranked #48 on CoinMarketCap with a market capitalization of $1.87 billion.
⌛️ 4-Hour Timeframe
On the 4-hour chart, after finding support around 0.1590, this coin formed a high at 0.1724 and has since made its first bullish move after breaking that level.
✔️ Right now, price is facing resistance around 0.1836, a zone it has already tested twice—each time getting rejected.
✨ If 0.1836 breaks, we can look for a long position, with the next resistance area sitting around 0.2046.
📊 یFor short positions, I’ll wait until the structure turns bearish before acting. At the moment, the short trigger is at 0.1724, but the main confirmation of a downtrend would only come after a break below 0.1590.
📝 Final Thoughts
Stay calm, trade wisely, and let's capture the market's best opportunities!
This analysis reflects our opinions and is not financial advice.
Share your thoughts in the comments, and don’t forget to share this analysis with your friends! ❤️

POL📊 Trade Setup: Pakistan Oilfields Limited (POL) – Daily Chart
✅ Trade Bias: Bullish (Trend Continuation)
🟢 Entry Zone (Buy Area):
Price: Between PKR 705 – 715
This is the support retest zone after breakout, aligned with minor support and EMA.
🎯 Target (TP – Take Profit):
First Target (TP1): PKR 748.50 (Immediate resistance)
Second Target (TP2): PKR 790 – 791 (Next major resistance / measured move)
❌ Stop Loss (SL):
Below PKR 688
Ideally, below the confluence of:
Previous structure support
Trendline support
50 EMA
Example: SL at 684
🔁 Risk/Reward Ratio Example:
Entry: 710
SL: 684
TP1: 748.5
TP2: 790
R:R for TP1 = (748.5 - 710) / (710 - 684) = 38.5 / 26 = ~1.48:1
R:R for TP2 = (790 - 710) / (710 - 684) = 80 / 26 = ~3.07:1
⚠️ Additional Notes:
Watch for volume confirmation above 748.
If the trendline breaks, re-evaluate the setup or exit early.
Be cautious of sharp wicks near resistance — they may indicate exhaustion.

POL - Confluence at Demand: Longs on the Trendline?POL BINANCE:POLUSDT has been overall bullish on the daily, moving inside a rising channel. Price is sliding toward the demand zone at $0.19–$0.21, right where the channel’s lower trendline comes in, clean confluence for dip buyers.
This zone is key 🔑. If bulls defend it, I’ll look for a rotation toward $0.25, then $0.29–$0.31 near the channel mid/upper bounds 🚀.
If $0.19 fails on a daily close, I’ll step aside and reassess lower before looking for fresh confirmation.
What’s your move => bid the confluence at $0.19–$0.21, or wait for strength back above $0.25 first? 🤔
⚠️ Disclaimer: This is not financial advice. Always do your own research and manage risk properly.
📚 Stick to your trading plan regarding entries, risk, and management.
Good luck! 🍀
All Strategies Are Good; If Managed Properly!
~Richard Nasr

POLYGON/ex MATIC - Horse pattern, very bullish ?¿*2nd attempt, making it more thrustworthy*
beautiful animal, much power, once the head of the horse is completly finished, we run the green valleys with very yummy grass
orange line is SL, need to close below on daily
target is 0.75
POL LONG IDEAim taking a long position here for BINANCE:POLUSDT.P
This is risky so I'm not responsible for your losses. DYR
Entry SL TP are visible on the chart.

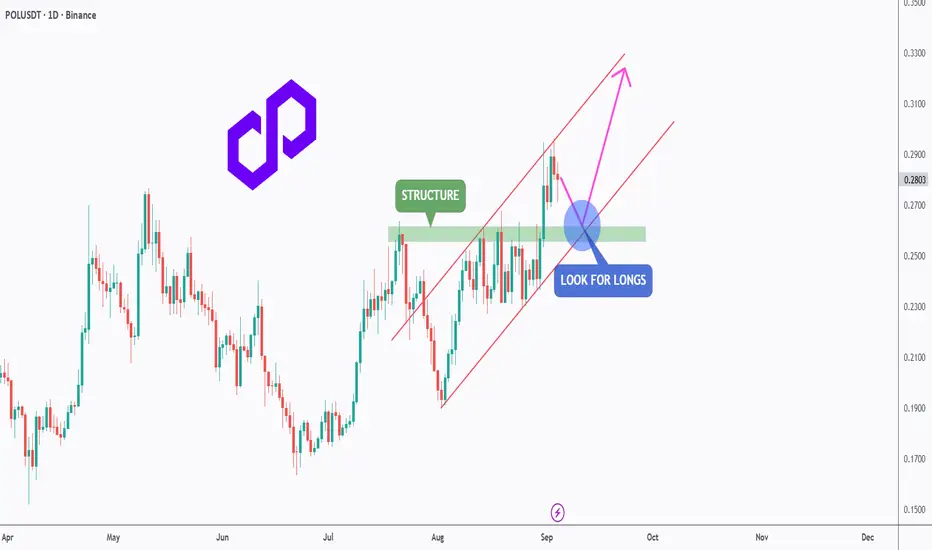
POL - Retest the Channel, Reload for the Next Leg!POLUSDT has been trading inside a clean ascending channel 📈, respecting both support and resistance levels.
After a strong push upward, price is now pulling back toward the previous structure zone around 0.26 – 0.27, which aligns perfectly with the lower bound of the channel.
This area forms a strong confluence (structure + channel support) 🔑, making it an ideal spot to look for long opportunities. As long as this zone holds, bulls 🐂 could regain control and push price toward the next resistance levels in the 0.32.
Patience here is key ⏳ — waiting for confirmation before entering can set up a high-probability continuation trade.
⚠️ Disclaimer: This is not financial advice. Always do your own research and manage risk properly.
📚 Always follow your trading plan regarding entry, risk management, and trade management.
Good luck!
All Strategies Are Good; If Managed Properly!
~Richard Nasr
Ready for the POL RallyAfter 180 days of being in a range and below the resistance line, the BINANCE:POLUSDT has finally broken the resistance area and given us the confirmation we need to ascend to higher prices.
However, before the move starts, I would like it to return to the box marked in green on the chart and then begin its upward movement. For the long-term targets, I have marked two red lines, which could be the long-term goals. There is also a possibility that it could reach these targets quickly with sharp moves.
⛔ This is not financial advice; do your own research.

Is $POL (ex-#Matic) preparing for a breakout?After 4 months, the situation remains stable at OKX:POLUSDT
Key technical focus: breakout & consolidation above $0.28–0.30.
📌 Observations:
Market correction ongoing, yet #POL is holding strong.
Market Cap: ~$3B.
No major fundamental drivers currently seen.
📈 If momentum continues, x2 by the end of the year is realistic — possibly higher, depending on capital inflows.
What’s your view? Do you see hidden fundamentals supporting this strength?
______________
◆ Follow us ❤️ for daily crypto insights & updates!
🚀 Don’t miss out on important market moves
🧠 DYOR | This is not financial advice, just thinking out loud.
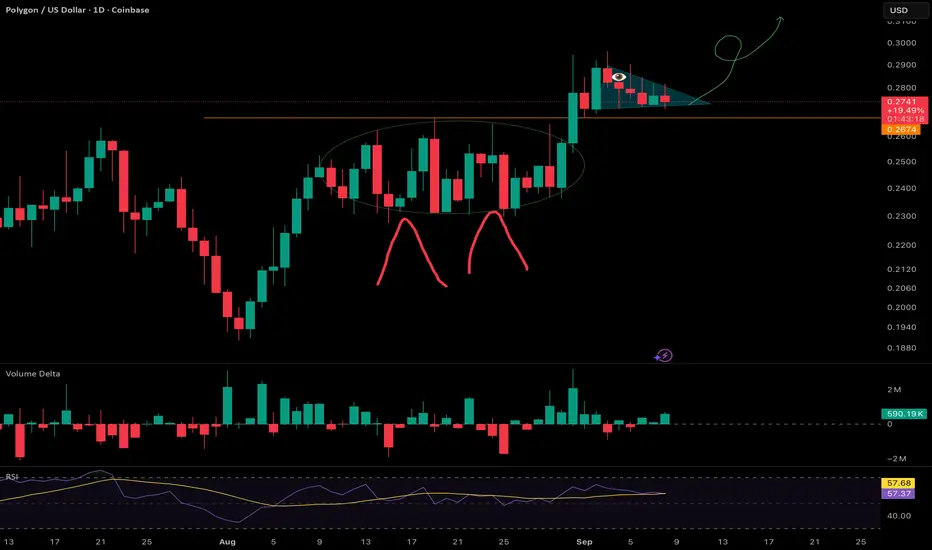
Polygon Update ·Everything Continues To Point HigherPolygon looks good. We have the same dynamics on this chart from the previous update.
There is a challenge of resistance currently taking place. This resistance is likely to break based on the fact that POLUSDT continues to trade closer and closer to it, with no more retraces basically. When this happens we know that resistance is weakening and with this weakening comes the next advance.
In early August there was a higher low and the preceding move was very steep and fast. And so was the recovery producing a v shape. After the v shape recovery POL has been sideways at resistance.
Late 2025. That's when the entire cryptocurrency market will have its bull-run. The date has not change; we are getting very close. The closer we get, the stronger the signals become.
Everything continues to point higher.
Thanks a lot for your continued support.
Namaste.
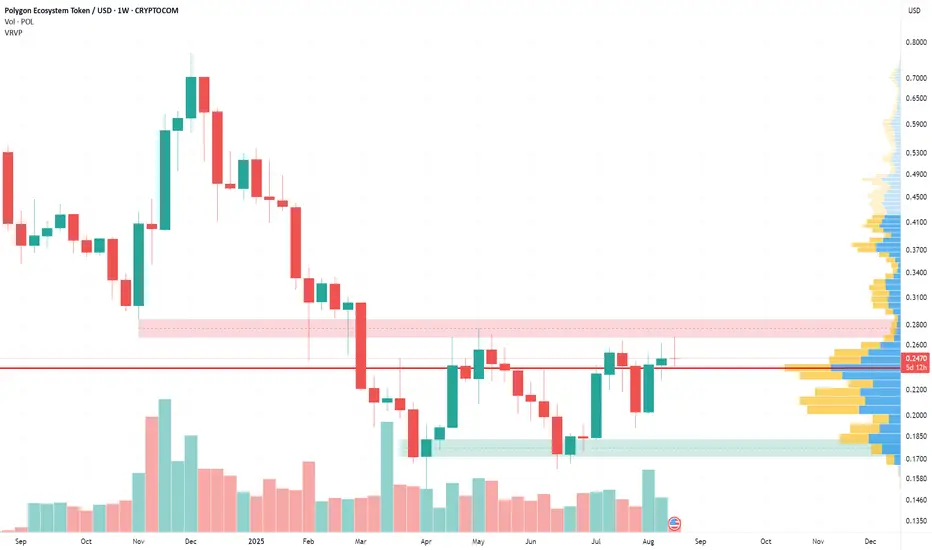
POL – Demand in Action!Price has been rejecting the resistance zone around 0.2620 – 0.2677 and is now approaching a key demand/support area near 0.2320 – 0.2270.
✅ If buyers step in here, we could see another bullish impulse toward the resistance levels.
✅ The demand zone remains a crucial area to watch for trend-following setups.
⚠️ However, a clear break below the 0.2270 support would invalidate this bullish scenario and shift the bias.
For now, I’m watching how price reacts at the green demand zone for the next potential swing.
📚 Always follow your trading plan regarding entry, risk management, and trade management.
Good luck!
All Strategies Are Good; If Managed Properly!
~Richard Nasr

TradeCityPro | POL Testing Range Top Amid Bullish Momentum👋 Welcome to TradeCity Pro!
In this analysis I want to review the POL coin for you. One of the so-called Ethereum Killer projects that in the previous bull run was highly hyped to replace Ethereum and now with a market cap of 2.6 billion dollars is ranked 42 on CoinMarketCap.
📅 Daily Timeframe
In the daily timeframe, this coin, like most altcoins, is in a very long-term range box. Now, after significant buying volume, it has reached the Maker Seller zone at the top of the box.
✔️ Since the price has registered a higher low than the 0.1717 bottom, the probability of breaking the zone has greatly increased. On the other hand, buying volume has gradually increased as the price has moved from the bottom of the box to the top, which shows the strength of the bullish trend.
⚡️ Now several daily candles in a row are stuck near this zone, consolidating just below it. If the zone is broken, we can have a long-term long position or even buy this coin in spot.
📊 If the bullish move starts, the resistance levels we can use as targets are 0.3299, 0.4271, and 0.5310. If the bullish trend continues and there are no signs of weakness, each of these levels can act as a new trigger for a long position.
🔍 If the price gets rejected from the resistance zone, with the breakdown of the 0.2315 trigger, the probability of a bearish move toward the 0.1717 bottom also exists, and with the breakdown of 0.2315 we can open a risky short position.
💥 With the breakdown of 0.1717, we also get the main confirmation of the trend change, and if this level is broken, this coin could have a very large drop.
📝 Final Thoughts
Stay calm, trade wisely, and let's capture the market's best opportunities!
This analysis reflects our opinions and is not financial advice.
Share your thoughts in the comments, and don’t forget to share this analysis with your friends! ❤️

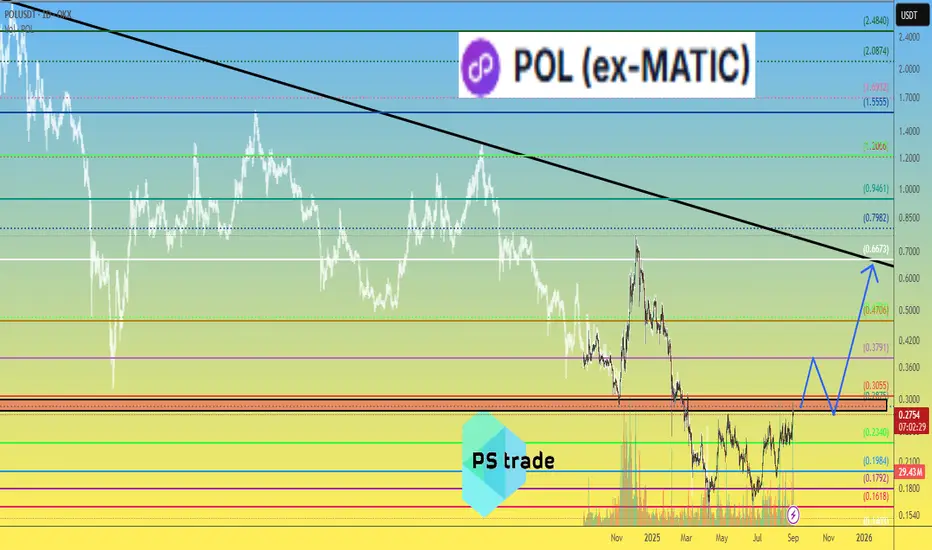
Another attempt to reverse from the downtrendPOL (MATIC) remain within downtrend on higher timeframes, but on daily shows intentions to grow higher. Red zone is old range bottom formed since token listing in 2021 and tested 4 times before break down. July 8th scam pump wick re-tested that level from below for the first time. So if manage to get there again, that will be the second time.
Monthly 20-sma moves in a downtrend - now around 0.468 and next month might be around 0.43 - that major dynamic SR is a magnet for price. At least when divergence becomes too large. So it can be taken as a target for future PA.
Smaller TF consolidation range is within 0.227 and 0.265 - will move within it till break in one of the directions.
POLUSDTBINANCE:POLUSDT in high trading renge. But above dynamic trendline. We can open position buy but high risk level.
Supports: 0.2415 - 0.2300 - 0.2225
Resistances: 0.2600 - 0.2745
Please control risk management⚠️

The Top vs The Bottom · Polygon vs Bitcoin, Ether & XRPEthereum will keep on growing of course and Bitcoin as well. Notice the difference between Bitcoin, Ether, XRP and Polygon. What an incredibly huge difference. The three mentioned are trading at very high prices compared to past history while POL is trading very close to its bottom.
I mean, this can definitely be good.
POLUSDT is trading at bottom prices but the downtrend is no longer active. There are no new lows in more than four months. The entire wave between December 2024 and April 2025 lasted four months. So seeing the same amount of time that produced such a strong bearish move produce nothing more than consolidation, is good news.
Polygon has been trading at bottom prices but slowly going up. We have a rising bottom, an ascending triangle. The upper resistance that is keeping the pattern active is still valid and being challenged this week. As soon as this resistance breaks, expect maximum growth. Some pairs will move up right away while others will continue to consolidate for months.
Polygon's consolidation is reaching its end.
Thanks a lot for your continued support.
Namaste.

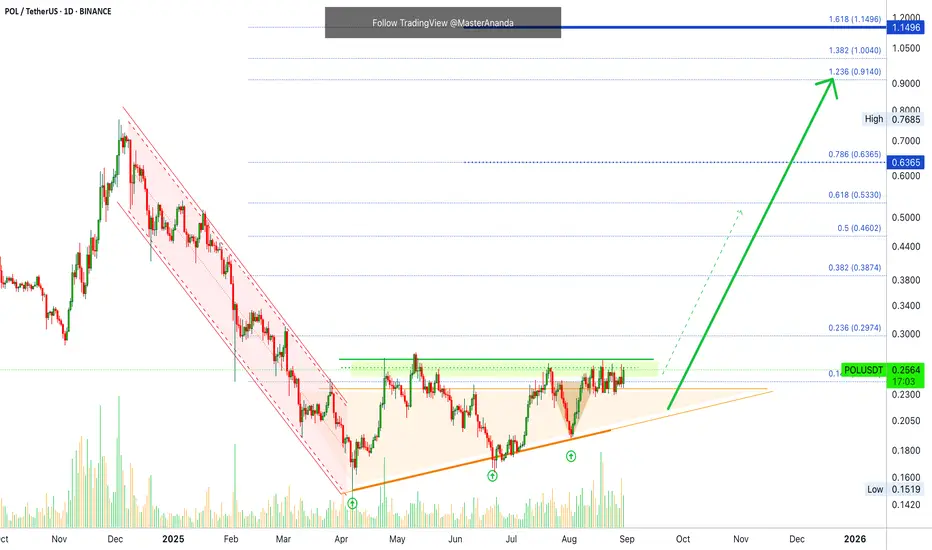
Polygon · Bottom, Recovery & 5,000% Growth PotentialPolygon has been bullish since April, clearly rising from its base for months. Now this Cryptocurrency trading pair is preparing for a new phase and market cycle. It is preparing for its 2025 bull market wave.
Polygon after a major drop produced a clear bottom and higher lows. This process has been active now four 120 days/4 months. This is a long consolidation period and there are no new lows, clearly. A rising triangle as a reversal signal is also present on the chart.
The accumulation period has been lasting, we can see how patience is key for success. Who would be able to hold for four long months? Who is still holding wise for 120 days?
Well, those who wait get paid. Those who waited will get paid but there is no need to wait because you can still buy and profit from the incoming bullish wave. The difference is that prices are higher now so growth potential is limited compared to several months in the past, that's how it works. The market builds up strength slowly and as this strength is being built prices grow.
When there is enough strength, enough interest and enough growth, the masses enter the market and this produces a major bull run. I've been warning you, we are getting very close. The action is already happening now, don't be surprised when you see a 300%+ bullish jump. That is exactly what is coming and it will all happen within a few months.
Expect 500% to start but aim for 1,000%, 2,000% and in some cases even more. Many good, strong and reputable pairs will grow 3,000%, 4,000% or 5,000%. Polygon will be one of the big ones.
Thanks a lot for your continued support.
Namaste.

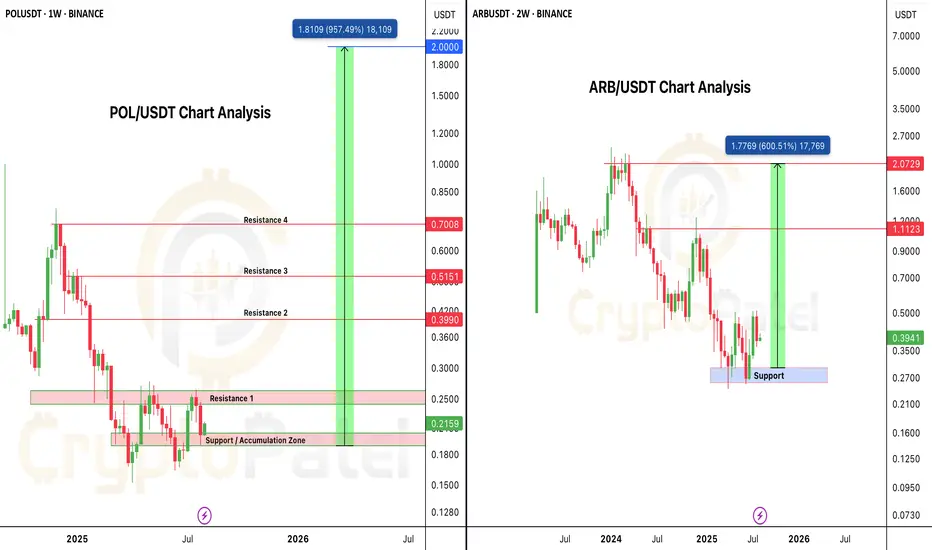
Altseason is Loading... Which One’s Your 10x Pick – $POL or $ARB🚨 BULL MARKET ACCUMULATION ALERT 🚨
Both PSX:POL and AMEX:ARB are currently trading below $0.40, and both charts are showing strong long-term bullish structure.
PSX:POL Analysis:
• Current Price: Under $0.40
• Strong Entry Zone: $0.20 – $0.17
• Bull Run Targets: $2 – $5
• Backed by powerful fundamentals, strong tech, and serious investors.
AMEX:ARB Analysis:
• Current Price: ~$0.40
• Key Accumulation Zone: $0.40 – $0.30
• Bull Run Targets: $2 – $5
• One of the strongest L2 ecosystems with deep liquidity and solid fundamentals.
Both are technically oversold, fundamentally strong, and positioned for major upside in the coming altseason.
Question for the community:
Which one hits $2 first — PSX:POL or AMEX:ARB ?
Drop your pick below 👇
NFA & DYOR
Polygon, Higher Low? Easy 1,000% Profits PotentialFour weeks red! Do you really believe the market will continue moving lower? If the answer is yes; think twice, stop! Think again.
Four weeks red is all that you will get you bearish bastard.
Your time is over. We are taking over, the bulls are entering the game.
You had your fun, you had it for a few days.
You can't have it anymore, I am calling my friends.
Friends, look at Polygon (POLUSDT), the chart looks great.
Whenever there is a retrace within a bull market, this is an opportunity to enter again.
Great timing, great prices; the start of a new bullish wave.
Prices are about to grow... Everything is about to grow... Crypto is going up. Are you in or are you out? Did you miss the initial bullish breakout? That's ok. The next bullish wave will 4-6 times bigger than the previous one for this pair. Sometimes even more. Here we have 1,000% profits potential as an easy target.
Get ready and be sure to be prepared.
Start buying like the world is about to end. Why?
Because there will be so much growth in the coming days, that you want to profit all the way. To profit you need to be in, you have to buy when prices are low.
You cannot wait for the green candle, the best time is now.
Thanks a lot for your continued support.
Namaste.

POL: Ideal Bullish SetupDuring early April to mid-May, #POL had one of the strongest bullish rises among top-tier projects.
The ongoing correction appears to be a healthy pullback before the next major leg up.
Holding above $0.15 keeps the setup valid. Passing $0.257 confirms a new rally.
#Polygon

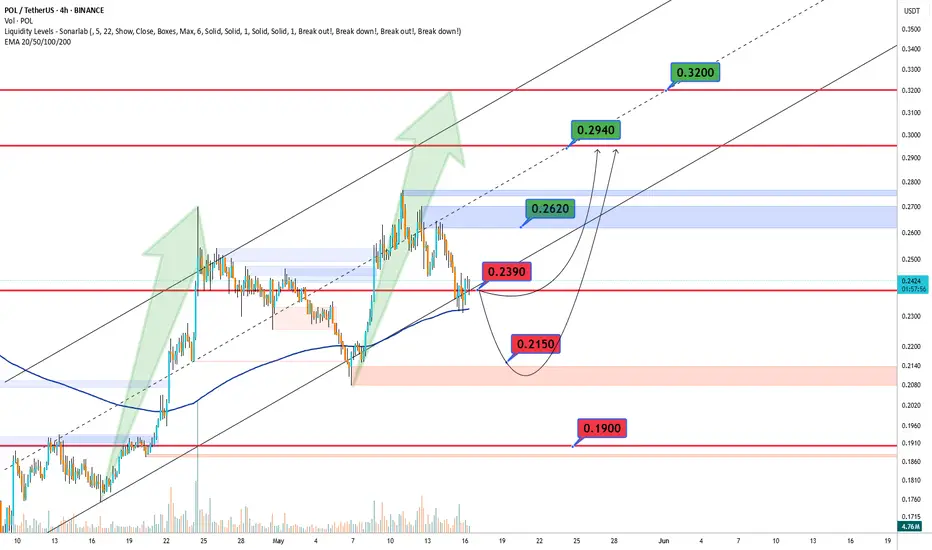
POLUSDT Bullish🔍 BINANCE:POLUSDT Technical Outlook – May 16 🔍
Bulls are watching the key $0.2390 level! 🔼
If broken, we could see a rally towards $0.2620, then $0.2940, and even $0.3200 if momentum stays strong 🚀
But if price gets rejected... 👀
Watch support at $0.2150 – and if that fails, $0.1900 could be next 🛑
📊 Current zones to watch:
🔴 Resistance: $0.2620 | $0.2940 | $0.3200
🟢 Support: $0.2390 | $0.2150 | $0.1900
Polygon's Comeback!#Polygon, a leader of the Ethereum ecosystem since 2019, shows signs of a major comeback after its recent bounce.
Maintaining $0.15 keeps the bullish case valid. Passing $0.28 is the first confirmation, while clearing $0.77 paves the way to target the ATH.
#Matic

Polygon Ecosystem Token Last Chance, It Is Not Too LateLet's close the day with a classic —RSI bullish divergence.
Polygon Ecosystem Token (POL) has been moving lower and hit bottom on the 7th of April. It's RSI on the other hand isn't doing the same, it bottomed in early July 2024. While POLUSDT went on to produce lower lows, its 3D RSI has been doing higher lows. This is a very strong bullish divergence and also a classic reversal signal.
This signal coupled with volume and marketwide action confirms that the bottom is in.
This pair is going through a pause now, a small one, before additional-huge growth.
The market is giving us one last chance to buy all we want before massive growth.
When the next move starts, there will never be a chance to buy at prices like we have now today. This is good. Cryptocurrency will evolve and the entire world will benefit.
This is a friendly reminder.
Time to work. Wake up!
It is not too late.
Namaste.
