POL/USDT — Final Accumulation Before the Breakout?POL/USDT is currently playing with fire inside the key zone 0.195–0.175 (yellow block) — an area that has repeatedly acted as a major demand base since mid-year.
The price structure is forming an ascending base pattern, where each dip creates a higher low — signaling that buyers are quietly building strength beneath the surface.
This zone could be the final accumulation phase before a breakout, or the last trap before a deeper breakdown.
---
Pattern Explanation
Yellow Block (0.195–0.175) → Major demand zone where buyers have consistently defended price.
Ascending Support Line → Indicates a bullish continuation base, suggesting steady buying pressure.
Layered Resistances:
R1: 0.2127
R2: 0.2410
R3: 0.2847
R4: 0.3226
Sideways Range on Support → Market is coiling within a tight range; the longer the base, the stronger the potential breakout.
---
Bullish Scenario
Confirmation Signal: A 2D candle close above 0.2127 with strong volume and body expansion.
Strategy:
Aggressive entry: accumulate near the lower zone (0.195–0.180) on rejection wicks.
Conservative entry: wait for breakout confirmation above 0.2127.
Target levels:
→ 0.2410 (minor take-profit)
→ 0.2847 (psychological barrier)
→ 0.3226 (main target zone).
Stop-loss: Below 0.175 for protection.
Bullish Narrative:
If confirmed, this structure transforms into a reversal pattern, potentially leading to a 60%+ upside over the next few weeks.
---
Bearish Scenario
Confirmation Signal: A 2D candle close below 0.175 and breakdown of the ascending trendline.
Strategy:
Breakdown confirms bearish continuation; target 0.125–0.115 as the next major demand zone.
Short entry after a failed retest around 0.175–0.195.
Stop-loss above 0.205.
Bearish Narrative:
Losing this block would invalidate the bullish structure and confirm a continuation of the downtrend.
---
Technical Summary
The chart is in a make-or-break zone:
Hold the base → potential accumulation breakout pattern.
Lose the base → continuation of the bearish leg.
This quiet phase often signals that smart money is positioning ahead of a big move — the breakout direction will determine the next multi-week trend.
---
#POL #POLUSDT #CryptoAnalysis #TechnicalAnalysis #SupportResistance #Accumulation #BreakoutWatch #PriceAction #SwingTrade #CryptoSetup #Trendline #MarketStructure
Polusd

POLUSD Polygon (ex-Matic) Second attempt here following the trendline for now,
SL at 0.1990 if it wicks. And will close below the trendline if theres a clear daily breakdown
TPs : Same as the first try
0.75
1.5
3
6.5
18
cheers
POLYGON/ex MATIC - Horse pattern, very bullish ?¿*2nd attempt, making it more thrustworthy*
beautiful animal, much power, once the head of the horse is completly finished, we run the green valleys with very yummy grass
orange line is SL, need to close below on daily
target is 0.75
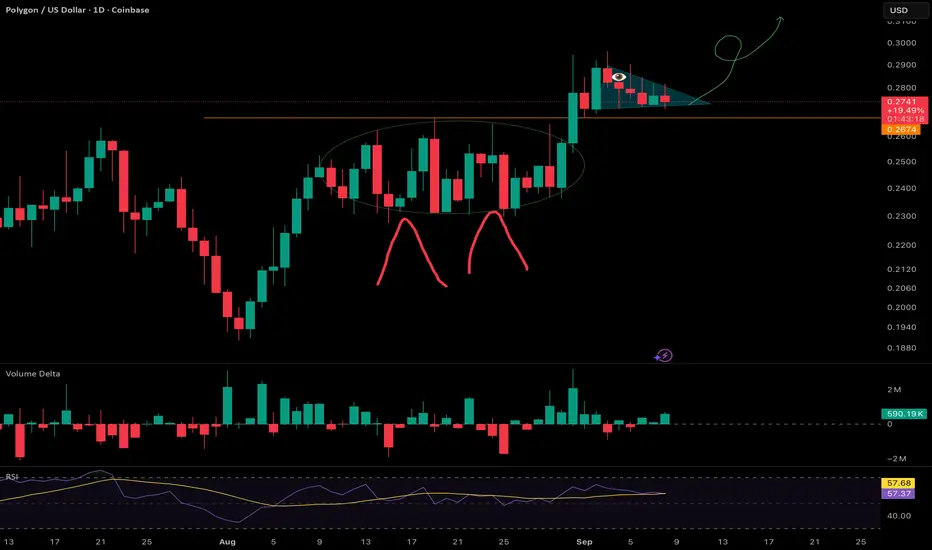
POLUSDT Reversal Confirmed!POLUSDT is showing a strong bullish reversal setup on the daily chart. The price has broken above resistance and both the 100 EMA and 200 EMA, signaling a momentum shift to the upside. A clear double bottom pattern has formed, with a breakout above the neckline resistance, confirmed by high trading volume. These technical signals suggest that the market structure is turning bullish, and as long as the price holds above the breakout zone and EMA support, there is strong potential for continuation toward higher resistance levels.
Key Points:
- Price trading above 100 & 200 EMA
- Double bottom neckline breakout
-Breakout supported by high volume
- Volume profile shows major accumulation below current price, lighter resistance above
Cheers
Hexa

POL ; Important supportHello friends
Given the upward trend we had, now that the price has corrected, we have identified important and good support areas for you, and if these supports are maintained and stabilized above, the price can move to the specified targets.
Trade safely with us

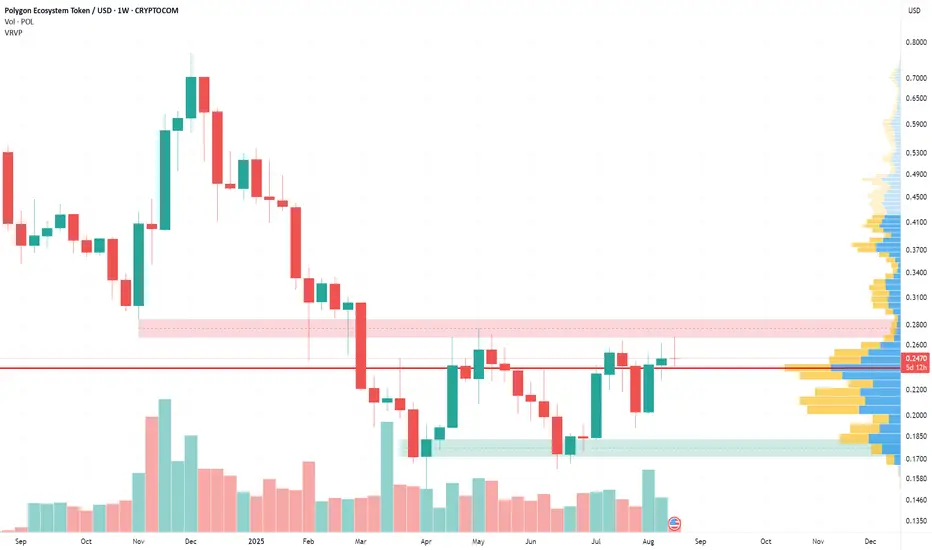
Another attempt to reverse from the downtrendPOL (MATIC) remain within downtrend on higher timeframes, but on daily shows intentions to grow higher. Red zone is old range bottom formed since token listing in 2021 and tested 4 times before break down. July 8th scam pump wick re-tested that level from below for the first time. So if manage to get there again, that will be the second time.
Monthly 20-sma moves in a downtrend - now around 0.468 and next month might be around 0.43 - that major dynamic SR is a magnet for price. At least when divergence becomes too large. So it can be taken as a target for future PA.
Smaller TF consolidation range is within 0.227 and 0.265 - will move within it till break in one of the directions.
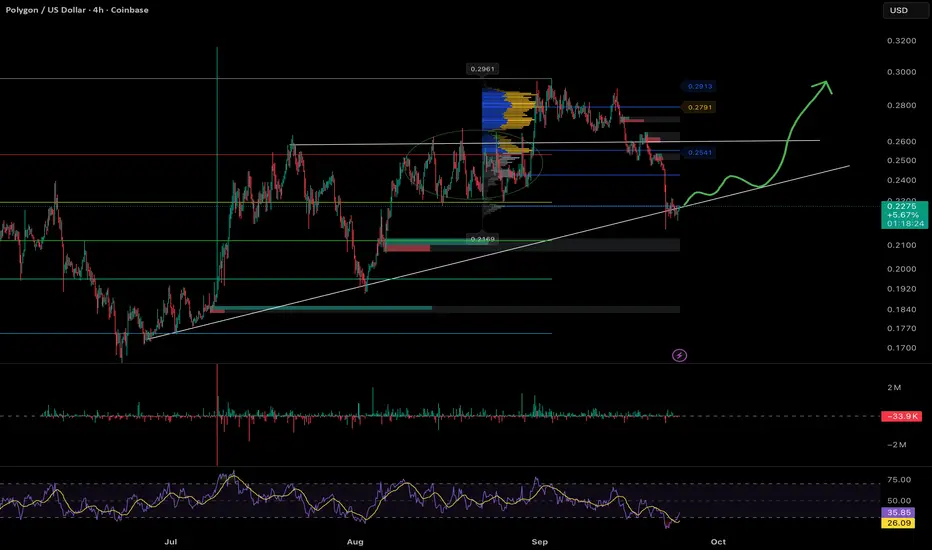
POLUSDTBINANCE:POLUSDT in high trading renge. But above dynamic trendline. We can open position buy but high risk level.
Supports: 0.2415 - 0.2300 - 0.2225
Resistances: 0.2600 - 0.2745
Please control risk management⚠️

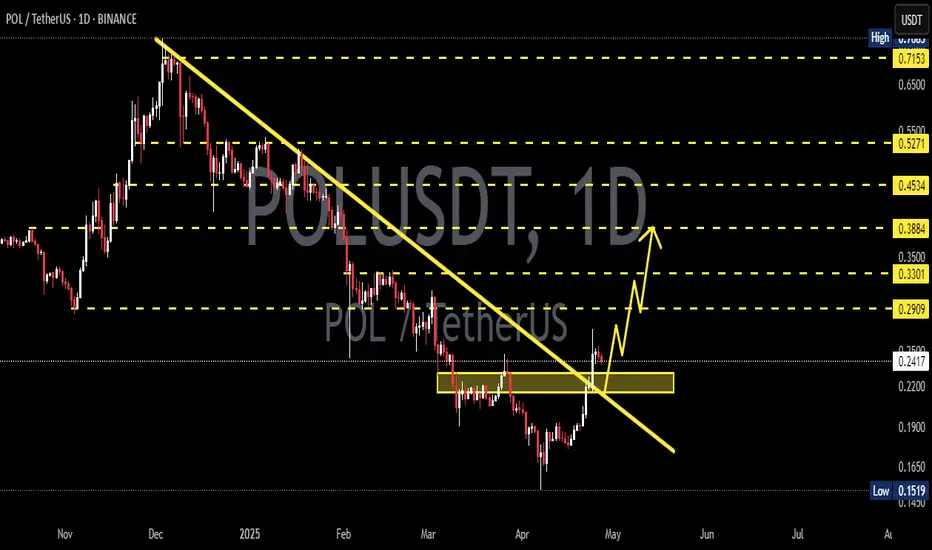
POL/USDT Preparing for a Major Breakout?📊 Chart Overview:
POL/USDT is currently showing signs of a potential trend reversal after months of sustained bearish momentum. The price is now testing a long-term descending trendline that has acted as a strong resistance since the November 2024 peak — and this moment could be a critical turning point for the market.
---
📌 Pattern Structure & Technical Setup:
🔸 Primary Pattern: Descending Trendline, capping every rally since late 2024.
🔸 Potential Reversal Structure: Falling Wedge Pattern – often a bullish reversal signal, supported by weakening bearish pressure and a series of higher lows forming since June 2025.
🔸 Current Position: Price is testing the trendline resistance around the $0.24–$0.27 zone.
---
📍 Key Price Levels:
✅ Resistance:
$0.2740 → Key breakout level; confirmation of trendline break.
$0.3290 → Important horizontal level, previously acted as major support.
$0.4301 – $0.7147 → Extended bullish targets based on Fibonacci retracement and historical price memory zones.
🛑 Support:
$0.2200 → Minor support if price rejects the trendline.
$0.1520 → Major long-term support (current all-time low).
---
📈 Bullish Scenario (Breakout Case):
If price successfully breaks and closes above $0.2740, we could expect:
Confirmation of a long-term downtrend breakout.
A shift in market sentiment from bearish to bullish.
Short-term target: $0.3290 → then $0.4301.
Higher upside potential if volume supports the breakout and altcoin momentum strengthens.
> 🚀 Volume will be the key validator – a breakout without volume = weak signal.
---
📉 Bearish Scenario (Rejection Case):
If the price fails to break the trendline:
Likely rejection and pullback toward the $0.2200 support zone.
If selling pressure increases, a retest of the $0.1520 demand zone is possible.
This would extend the consolidation phase or confirm continued bearish control over the medium term.
---
🔍 Conclusion & Trading Strategy:
POL/USDT is at a technical decision point. A confirmed breakout could mark the end of the accumulation/distribution phase and trigger a new bullish leg.
📌 Strategy Overview:
Breakout Traders: Enter after confirmed daily close above $0.2740, target levels above.
Reversal Traders: Enter conservatively after a retest of the breakout zone with a tight SL.
Bearish Traders: Consider shorts on strong rejection at the trendline, targeting $0.22 → $0.15.
---
🧠 Extra Notes:
Watch Bitcoin dominance and overall market sentiment.
Volume confirmation is crucial for validating breakout strength.
Be cautious of fakeouts, especially around dynamic resistance like trendlines.
#POLUSDT #CryptoBreakout #FallingWedge #AltcoinAnalysis #TechnicalAnalysis #CryptoSetup #PriceActionTrading #BullishBreakout #BearishScenario #CryptoReversal #TrendlineBreakout

POLUSDT 1D AnalysisPOL ~ 1D Analysis
#POL This coin is currently at its lowest support. Buy if you still have confidence in this coin with a short term target of at least 15%+ from this support.

Polygon: More (short-term) Upward PotentialFor Polygon’s POL, we primarily expect further corrective rises during the blue wave (iv), but below the $0.51 mark, renewed sell-offs should take over. These declines should then drive the price down below the support at $0.15, allowing the large wave to reach its conclusion there. Our alternative scenario – where the low of wave alt. in green would be already behind us (probability: 33%) – is still relevant. This scenario would be reinforced with a jump above the resistance at $0.51 but only finally confirmed with increases above the next higher level at $0.76.
📈 Over 190 precise analyses, clear entry points, and defined Target Zones - that's what we do.

POLUSDT 1D Analysis POL ~ 1D Analysis
#POL Buy gradually from here if you still have confidence in this coin with a short term target of at least 15%++ from here.

POLUSDT 1D AnalysisPOL ~ 1D Analysis
#POL Buy gradually from here if you still have a Conviction on this coin with a short -term target of at least 15%+ from here.
POL is breakout out of the descending wedge upper trend line.POLYGON is now trading outside the upper trendline of the descending wedge pattern and may be preparing for a substantial move in the month of May.
Good luck, and always use a stop-loss!

MATIC/POL buyers beware; bearish signals in the mid-term (1W)The MATIC/POL pair has been dropping for over 1200 days from its peak price, but the structure suggests that a new bullish pattern may have started from the point where we placed the red arrow on the chart.
We’ve marked a supply zone on the chart that could reject the price downwards.
The minimum expectation is for the price to drop to TP1.
The best buying zone for MATIC/POL is the green zone at the bottom of the chart, which could push the price upwards by more than 500%. In fact, it is expected that wave A of the bearish pattern or X wave will end in this area, and the price will enter a mid-term or even long-term bullish phase.
A weekly candle closing above the invalidation level will invalidate this analysis.
For risk management, please don't forget stop loss and capital management
When we reach the first target, save some profit and then change the stop to entry
Comment if you have any questions
Thank You

MATIC returning to equilibrium would be a 128% gain from here!MATIC is looking extremely undervalued at current levels. The price has pulled back considerably since the "Trump election pump" and is forming a nice wedge on the 4-hour chart, which is currently on a four-count. A price move back to equilibrium from the wedge's bottom trendline would, by itself, result in approximately a 128% gain.
Longer term, if the price breaks out of the monthly chart wedge pattern (see comments below for the chart), which is also currently trading at a four-count, we could see some incredible price appreciation over the next 6 to 9 months.
Good luck, and always use a stop-loss!

POL/USDT Trading ScenarioIn November, POL showed confident growth driven by euphoria following the U.S. presidential election results. The asset's price surged from $0.2852 to $0.7705, marking a gain of over 160%. However, profit-taking by market participants soon followed, resulting in a correction that now exceeds 46%.
Currently, seller activity appears to be waning, with a support level forming at $0.4104, from which the price has rebounded twice. Volume profile analysis indicates that POL has stabilized within a zone of market interest.
Further declines may occur as liquidity from short-term players is absorbed, potentially setting the stage for a trend reversal. The recovery dynamics and subsequent growth of the asset are largely influenced by U.S. macroeconomic indicators. Special attention is being paid to the Federal Reserve's decisions on adjusting the key interest rate, which are revised based on current data.

Polygon(POL) bull market has not ended yet!Recently, Polygon had reached $0.768 which is the highest price during last few months.
Now the price is dropping pretty much from the highest point, but I still believe this is not the end of altcoin season, also the season of Polygon.
I think the recent price drop was inevitable since RSI was in overbuy area for few days. The point is, If the price continues to be supported at the 0.382 level of $0.55, I think the upward trend could continue, leading to a rally up to the 1.0 or even the 1.272 level. And in that case, price would be between $0.97 ~ $1.08.
Moving average golden cross has just appeared. It is still worth to wait and look.

POL/USD 1W !Hello everyone, I invite you to review the POL/USD chart taking into account the interval of one weekend.
As we can see, the price has been moving in a downtrend channel for a long time, where there is still room for price increases.
Additionally, it is worth mentioning that a positive upward exit from the channel may result in a strong increase close to the channel height around $1,89. However, before this happens, the price must overcome the strong resistance zone from $0.78 to $0.91, and then the resistance at $1.09 near the upper border of the channel, which will open the way towards strong resistance levels at $1.58 and then $2.38. Currently, we can see the price staying above the support at $0.59 and further protected by a strong support zone from $0.47 to $0.28.


you're not ready yet MATIC, chill in the triangle for now It reaches and hits exactly the major line going from its old peak of 2021. Unless it convincingly breaks out and flips this major line, the path of least resistance for MATIC is to continue accumulating for a few more weeks in the triangle before a path opens to a massive rally

Hypothetical inverse head&shoulders pattern will materialize…. . .-if- Polygon decides to correct here for even a few days we will officially start forming a right shoulder and then we get the benefit of having an even higher target than the current $1.06 target we are heading towards for the falling wedge breakout. There is also 2 double botto breakouts and a channel breakout on the horizon too just above those 2 targets so it should create a bunch of bullish momentum as all these overlapping bullish patterns start falling like a domino effect. Of course if Polygon instead chooses to continue pumping towards the $1.06target without correcting for a day or few then the inverse head and shoulders will not materialize. *not financial advice*

Hypothetical inverse head&shoulders pattern will materialize…-if- Polygon decides to correct here for even a few days we will officially start forming a right shoulder and then we get the benefit of having an even higher target than the current $1.06 target we are heading towards for the falling wedge breakout. There is also 2 double botto breakouts and a channel breakout on the horizon too just above those 2 targets so it should create a bunch of bullish momentum as all these overlapping bullish patterns start falling like a domino effect. Of course if Polygon instead chooses to continue pumping towards the $1.06target without correcting for a day or few then the inverse head and shoulders will not materialize. *not financial advice*

Polygon on its way to hitting a double bottom breakout targetPrice action steadily climbing up the measured move line to the target. Golden cross coming up within the next week or so. *not financial advice*
