POL/USDT – 1D Chart Update | Long Trade Setup. POL/USDT – 1D Chart Update | Long Trade Setup
Long-term downtrend still intact
Price holding near major support zone
Possible trendline base reaction visible
📍 Entry Zone
0.095 – 0.105 USDT (Accumulation area)
🛑 Stop Loss
Below 0.085 USDT (Daily close basis)
🎯 Targets
T1: 0.162
T2: 0.208
T3: 0.285
T4: 0.410
T5: 0.506
T6: 0.631
T7: 0.717
Price at historical demand + trendline support
High risk–reward setup
Expectation of trendline breakout on a higher timeframe
This is a high-risk, high-reward setup
Use proper position sizing and strict SL
Short-term volatility expected
Mid-to-long term bounce possible if support holds
Not financial advice. Trade with discipline.
Polygon

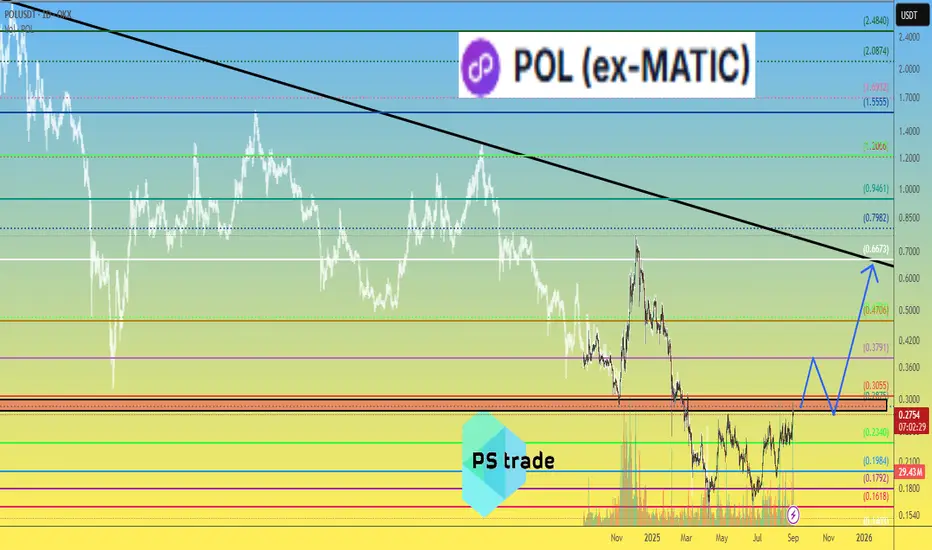
POL/USDT — Market StructureThe MATIC → POL rebrand didn’t help: price is down 86% YoY.
During this period, a descending channel formed, and price is now holding below the channel midline.
RSI shows a bullish divergence after extreme oversold conditions.
This is a strong bullish trigger, but it’s important to remember: it can play out with a significant delay.
Last time, the reversal took over two months and only occurred after a double divergence formed.
How to trade it:
• Aggressive: buy at current levels with a stop below the low.
• Safer: wait for a reclaim and hold above the channel midline, then enter with a stop below the low.
🎯 Primary target: the upper boundary of the channel.
Higher targets make sense only after a confirmed breakout above it.


POL/USDT — Long Setup🟩 Entry Zone: 0.1653$ - 0.16400$
🎯 Targets:
1️⃣ 0.1710
2️⃣ 0.1810
3️⃣ 0.1900
4️⃣ 0.2100+
🔻 Stop-Loss: Below 0.150

TradeCityPro | POL Faces Crucial Resistance Test👋 Welcome to TradeCity Pro!
In this analysis, I’m going to review POL, one of Ethereum’s Layer 2 projects, currently ranked #48 on CoinMarketCap with a market capitalization of $1.87 billion.
⌛️ 4-Hour Timeframe
On the 4-hour chart, after finding support around 0.1590, this coin formed a high at 0.1724 and has since made its first bullish move after breaking that level.
✔️ Right now, price is facing resistance around 0.1836, a zone it has already tested twice—each time getting rejected.
✨ If 0.1836 breaks, we can look for a long position, with the next resistance area sitting around 0.2046.
📊 یFor short positions, I’ll wait until the structure turns bearish before acting. At the moment, the short trigger is at 0.1724, but the main confirmation of a downtrend would only come after a break below 0.1590.
📝 Final Thoughts
Stay calm, trade wisely, and let's capture the market's best opportunities!
This analysis reflects our opinions and is not financial advice.
Share your thoughts in the comments, and don’t forget to share this analysis with your friends! ❤️

POL/USDT — Final Accumulation Before the Breakout?POL/USDT is currently playing with fire inside the key zone 0.195–0.175 (yellow block) — an area that has repeatedly acted as a major demand base since mid-year.
The price structure is forming an ascending base pattern, where each dip creates a higher low — signaling that buyers are quietly building strength beneath the surface.
This zone could be the final accumulation phase before a breakout, or the last trap before a deeper breakdown.
---
Pattern Explanation
Yellow Block (0.195–0.175) → Major demand zone where buyers have consistently defended price.
Ascending Support Line → Indicates a bullish continuation base, suggesting steady buying pressure.
Layered Resistances:
R1: 0.2127
R2: 0.2410
R3: 0.2847
R4: 0.3226
Sideways Range on Support → Market is coiling within a tight range; the longer the base, the stronger the potential breakout.
---
Bullish Scenario
Confirmation Signal: A 2D candle close above 0.2127 with strong volume and body expansion.
Strategy:
Aggressive entry: accumulate near the lower zone (0.195–0.180) on rejection wicks.
Conservative entry: wait for breakout confirmation above 0.2127.
Target levels:
→ 0.2410 (minor take-profit)
→ 0.2847 (psychological barrier)
→ 0.3226 (main target zone).
Stop-loss: Below 0.175 for protection.
Bullish Narrative:
If confirmed, this structure transforms into a reversal pattern, potentially leading to a 60%+ upside over the next few weeks.
---
Bearish Scenario
Confirmation Signal: A 2D candle close below 0.175 and breakdown of the ascending trendline.
Strategy:
Breakdown confirms bearish continuation; target 0.125–0.115 as the next major demand zone.
Short entry after a failed retest around 0.175–0.195.
Stop-loss above 0.205.
Bearish Narrative:
Losing this block would invalidate the bullish structure and confirm a continuation of the downtrend.
---
Technical Summary
The chart is in a make-or-break zone:
Hold the base → potential accumulation breakout pattern.
Lose the base → continuation of the bearish leg.
This quiet phase often signals that smart money is positioning ahead of a big move — the breakout direction will determine the next multi-week trend.
---
#POL #POLUSDT #CryptoAnalysis #TechnicalAnalysis #SupportResistance #Accumulation #BreakoutWatch #PriceAction #SwingTrade #CryptoSetup #Trendline #MarketStructure

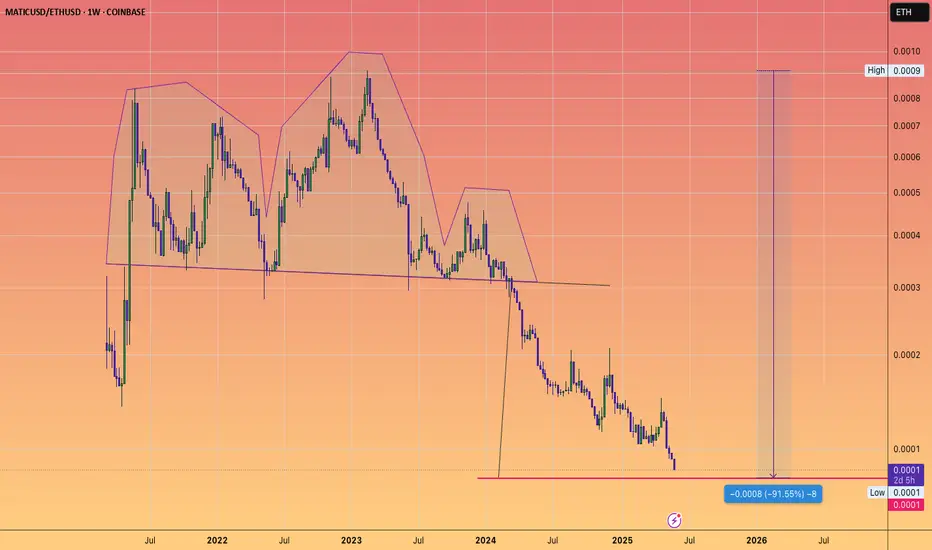
MATIC approaching Head and shoulders target...versus ETH
which would be a -91% loss of value versus the second most important crypto
POLUSD Polygon (ex-Matic) Second attempt here following the trendline for now,
SL at 0.1990 if it wicks. And will close below the trendline if theres a clear daily breakdown
TPs : Same as the first try
0.75
1.5
3
6.5
18
cheers
POLYGON/ex MATIC - Horse pattern, very bullish ?¿*2nd attempt, making it more thrustworthy*
beautiful animal, much power, once the head of the horse is completly finished, we run the green valleys with very yummy grass
orange line is SL, need to close below on daily
target is 0.75
POL LONG IDEAim taking a long position here for BINANCE:POLUSDT.P
This is risky so I'm not responsible for your losses. DYR
Entry SL TP are visible on the chart.

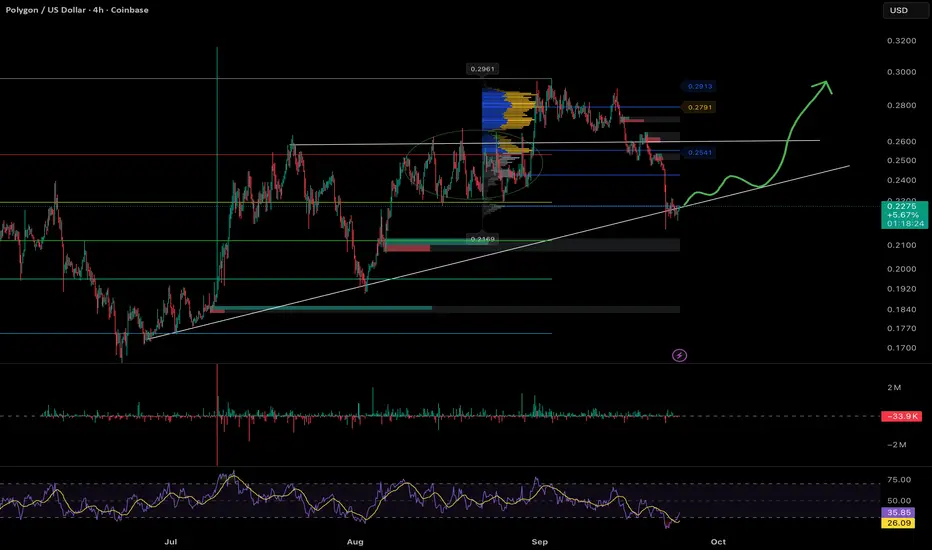
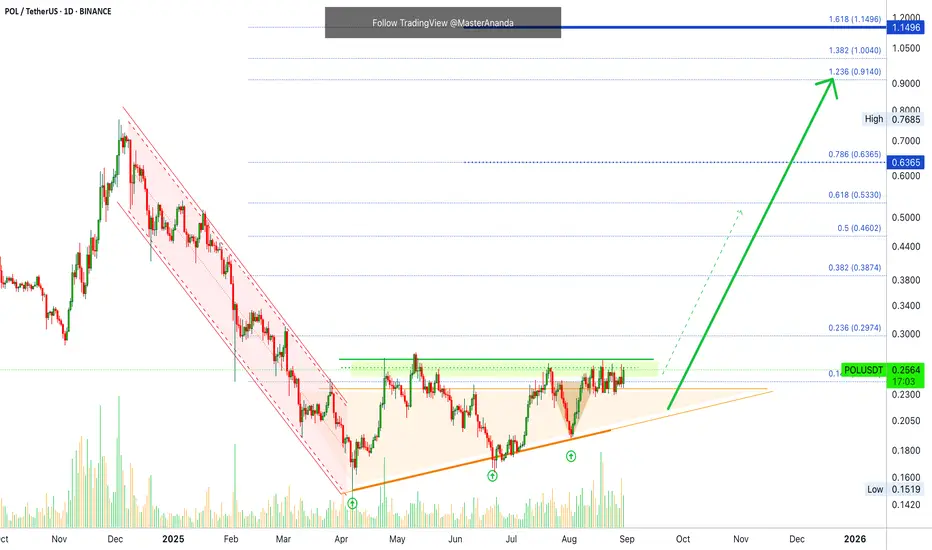
POL will finally break through??Let’s take a look at POL.
After a long period of sideways movement, the coin finally broke out to the upside. This gives a high probability that, after a small retest, the price will continue upward. What makes me think this way is the strong daily (1D) candle with large volume that broke resistance by itself. To me, the chart looks very positive.
Firstly, a lot of volume has gathered around 0.261, which is now acting as a resistance-turned-support zone. At this exact level, we also have the VAH (Value Area High), shown as the long blue line. Fibonacci retracement levels also support this zone, since we have the 0.5 and 0.686 levels from two different measurements lining up there.
Of course, there’s also a volume gap on the daily candle, and the 0.5 retracement of the large green weekly (1W) candle hasn’t been tested yet. I also assume that bullish divergences will eventually add momentum and help fill this move.
Another possible scenario is if we see a deeper retracement before the pump. In that case, one more zone to look for long opportunities is 0.239–0.248. Here we have:
• the 0.5 and 0.314,0.222 zone from another measurement
• the POC (Point of Control), which aligns with the VAH I mentioned above
• confluence with VWAP, which should meet price exactly at the orange zone
In my opinion, both ranges are strong, and where price eventually finds support depends on how much volume sellers put into the move down.
The last possible support is 0.223–0.215, but I’m not really considering it for now since it’s quite far below the current price.
My plan:
• First entry around 0.26, with stop loss at 0.253
• If that level fails, I’ll look for another entry somewhere in the middle of the zone below, with stop loss placed under it
• Current target: 0.36, but I’ll be watching price action closely
Thanks for taking your time and reading it hope i helped a little.

POL - BULLISH WAVE AWAITEDASX:POL - similar view; I think that a new wave upward is gonna start with this configuration!
Key demand zone to be maintained: 0.2450$

POL - ready to fly!GM TEAM!
I see a Beautifull bullish candle close H4 on PSX:POL 📈
Time to moon?? 🚀

185 Days range breakout & retest complted! - BullishPSX:POL - SPOT → TP1 ✅ → 6.5% up already 🔥
Following my lines, bull flag on the daily basis, corresponding to the 185 days range area retest!
20 - 30% pump could be see soon 📈
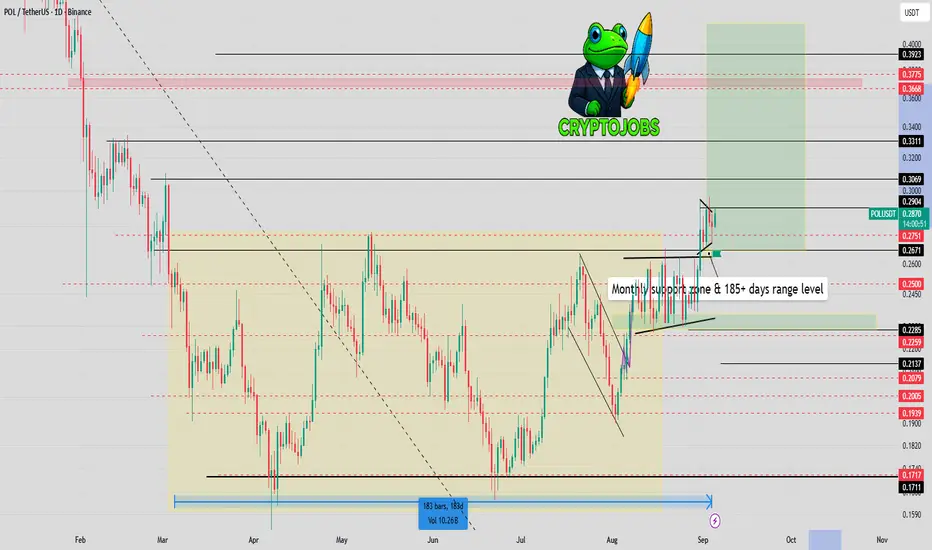
Ready for the POL RallyAfter 180 days of being in a range and below the resistance line, the BINANCE:POLUSDT has finally broken the resistance area and given us the confirmation we need to ascend to higher prices.
However, before the move starts, I would like it to return to the box marked in green on the chart and then begin its upward movement. For the long-term targets, I have marked two red lines, which could be the long-term goals. There is also a possibility that it could reach these targets quickly with sharp moves.
⛔ This is not financial advice; do your own research.

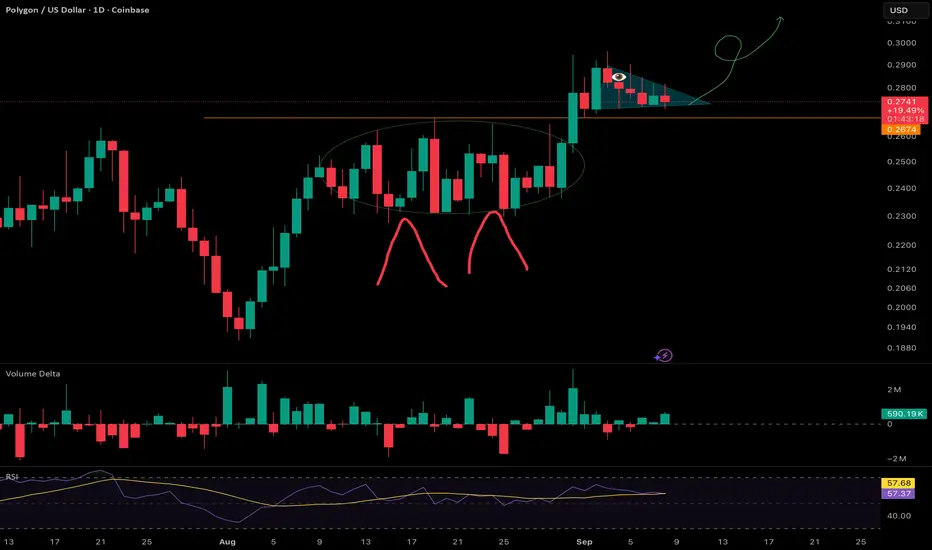
POL/USDT Trade Idea💎 BINANCE:POLUSDT Trade Idea 💎
📊 Pattern spotted: Double Bottom ✅
This setup indicates strong support around 0.2800 and signals a possible bullish reversal.
⚡ Entry (Advanced): 0.2860 – 0.2870
🎯 Target (TP): 0.2960
🛡️ Stop Loss (SL): 0.2800
✨ Risk/Reward: Low Risk – High Profit 🚀
This is an advanced entry with tight SL and strong upside potential.
📈 If the neckline breaks and sustains above, we can expect a bullish move towards the target.
🔑 Summary: Double Bottom gives confidence of reversal 📉➡️📈. Perfect setup for traders who like low loss & high reward opportunities.

POLUSDT Reversal Confirmed!POLUSDT is showing a strong bullish reversal setup on the daily chart. The price has broken above resistance and both the 100 EMA and 200 EMA, signaling a momentum shift to the upside. A clear double bottom pattern has formed, with a breakout above the neckline resistance, confirmed by high trading volume. These technical signals suggest that the market structure is turning bullish, and as long as the price holds above the breakout zone and EMA support, there is strong potential for continuation toward higher resistance levels.
Key Points:
- Price trading above 100 & 200 EMA
- Double bottom neckline breakout
-Breakout supported by high volume
- Volume profile shows major accumulation below current price, lighter resistance above
Cheers
Hexa

Is $POL (ex-#Matic) preparing for a breakout?After 4 months, the situation remains stable at OKX:POLUSDT
Key technical focus: breakout & consolidation above $0.28–0.30.
📌 Observations:
Market correction ongoing, yet #POL is holding strong.
Market Cap: ~$3B.
No major fundamental drivers currently seen.
📈 If momentum continues, x2 by the end of the year is realistic — possibly higher, depending on capital inflows.
What’s your view? Do you see hidden fundamentals supporting this strength?
______________
◆ Follow us ❤️ for daily crypto insights & updates!
🚀 Don’t miss out on important market moves
🧠 DYOR | This is not financial advice, just thinking out loud.
POL ; Important supportHello friends
Given the upward trend we had, now that the price has corrected, we have identified important and good support areas for you, and if these supports are maintained and stabilized above, the price can move to the specified targets.
Trade safely with us

Polygon Update ·Everything Continues To Point HigherPolygon looks good. We have the same dynamics on this chart from the previous update.
There is a challenge of resistance currently taking place. This resistance is likely to break based on the fact that POLUSDT continues to trade closer and closer to it, with no more retraces basically. When this happens we know that resistance is weakening and with this weakening comes the next advance.
In early August there was a higher low and the preceding move was very steep and fast. And so was the recovery producing a v shape. After the v shape recovery POL has been sideways at resistance.
Late 2025. That's when the entire cryptocurrency market will have its bull-run. The date has not change; we are getting very close. The closer we get, the stronger the signals become.
Everything continues to point higher.
Thanks a lot for your continued support.
Namaste.
POL – Demand in Action!Price has been rejecting the resistance zone around 0.2620 – 0.2677 and is now approaching a key demand/support area near 0.2320 – 0.2270.
✅ If buyers step in here, we could see another bullish impulse toward the resistance levels.
✅ The demand zone remains a crucial area to watch for trend-following setups.
⚠️ However, a clear break below the 0.2270 support would invalidate this bullish scenario and shift the bias.
For now, I’m watching how price reacts at the green demand zone for the next potential swing.
📚 Always follow your trading plan regarding entry, risk management, and trade management.
Good luck!
All Strategies Are Good; If Managed Properly!
~Richard Nasr

TradeCityPro | POL Testing Range Top Amid Bullish Momentum👋 Welcome to TradeCity Pro!
In this analysis I want to review the POL coin for you. One of the so-called Ethereum Killer projects that in the previous bull run was highly hyped to replace Ethereum and now with a market cap of 2.6 billion dollars is ranked 42 on CoinMarketCap.
📅 Daily Timeframe
In the daily timeframe, this coin, like most altcoins, is in a very long-term range box. Now, after significant buying volume, it has reached the Maker Seller zone at the top of the box.
✔️ Since the price has registered a higher low than the 0.1717 bottom, the probability of breaking the zone has greatly increased. On the other hand, buying volume has gradually increased as the price has moved from the bottom of the box to the top, which shows the strength of the bullish trend.
⚡️ Now several daily candles in a row are stuck near this zone, consolidating just below it. If the zone is broken, we can have a long-term long position or even buy this coin in spot.
📊 If the bullish move starts, the resistance levels we can use as targets are 0.3299, 0.4271, and 0.5310. If the bullish trend continues and there are no signs of weakness, each of these levels can act as a new trigger for a long position.
🔍 If the price gets rejected from the resistance zone, with the breakdown of the 0.2315 trigger, the probability of a bearish move toward the 0.1717 bottom also exists, and with the breakdown of 0.2315 we can open a risky short position.
💥 With the breakdown of 0.1717, we also get the main confirmation of the trend change, and if this level is broken, this coin could have a very large drop.
📝 Final Thoughts
Stay calm, trade wisely, and let's capture the market's best opportunities!
This analysis reflects our opinions and is not financial advice.
Share your thoughts in the comments, and don’t forget to share this analysis with your friends! ❤️
