POL/USDT — Final Accumulation Before the Breakout?POL/USDT is currently playing with fire inside the key zone 0.195–0.175 (yellow block) — an area that has repeatedly acted as a major demand base since mid-year.
The price structure is forming an ascending base pattern, where each dip creates a higher low — signaling that buyers are quietly building strength beneath the surface.
This zone could be the final accumulation phase before a breakout, or the last trap before a deeper breakdown.
---
Pattern Explanation
Yellow Block (0.195–0.175) → Major demand zone where buyers have consistently defended price.
Ascending Support Line → Indicates a bullish continuation base, suggesting steady buying pressure.
Layered Resistances:
R1: 0.2127
R2: 0.2410
R3: 0.2847
R4: 0.3226
Sideways Range on Support → Market is coiling within a tight range; the longer the base, the stronger the potential breakout.
---
Bullish Scenario
Confirmation Signal: A 2D candle close above 0.2127 with strong volume and body expansion.
Strategy:
Aggressive entry: accumulate near the lower zone (0.195–0.180) on rejection wicks.
Conservative entry: wait for breakout confirmation above 0.2127.
Target levels:
→ 0.2410 (minor take-profit)
→ 0.2847 (psychological barrier)
→ 0.3226 (main target zone).
Stop-loss: Below 0.175 for protection.
Bullish Narrative:
If confirmed, this structure transforms into a reversal pattern, potentially leading to a 60%+ upside over the next few weeks.
---
Bearish Scenario
Confirmation Signal: A 2D candle close below 0.175 and breakdown of the ascending trendline.
Strategy:
Breakdown confirms bearish continuation; target 0.125–0.115 as the next major demand zone.
Short entry after a failed retest around 0.175–0.195.
Stop-loss above 0.205.
Bearish Narrative:
Losing this block would invalidate the bullish structure and confirm a continuation of the downtrend.
---
Technical Summary
The chart is in a make-or-break zone:
Hold the base → potential accumulation breakout pattern.
Lose the base → continuation of the bearish leg.
This quiet phase often signals that smart money is positioning ahead of a big move — the breakout direction will determine the next multi-week trend.
---
#POL #POLUSDT #CryptoAnalysis #TechnicalAnalysis #SupportResistance #Accumulation #BreakoutWatch #PriceAction #SwingTrade #CryptoSetup #Trendline #MarketStructure
Polygonusdt

POL LONG IDEAim taking a long position here for BINANCE:POLUSDT.P
This is risky so I'm not responsible for your losses. DYR
Entry SL TP are visible on the chart.

POL - ready to fly!GM TEAM!
I see a Beautifull bullish candle close H4 on PSX:POL 📈
Time to moon?? 🚀

185 Days range breakout & retest complted! - BullishPSX:POL - SPOT → TP1 ✅ → 6.5% up already 🔥
Following my lines, bull flag on the daily basis, corresponding to the 185 days range area retest!
20 - 30% pump could be see soon 📈
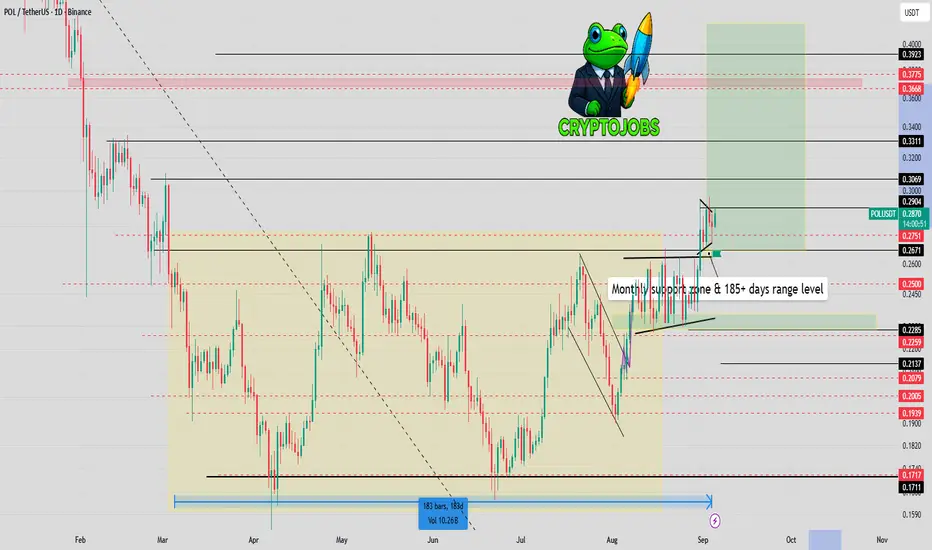
Ready for the POL RallyAfter 180 days of being in a range and below the resistance line, the BINANCE:POLUSDT has finally broken the resistance area and given us the confirmation we need to ascend to higher prices.
However, before the move starts, I would like it to return to the box marked in green on the chart and then begin its upward movement. For the long-term targets, I have marked two red lines, which could be the long-term goals. There is also a possibility that it could reach these targets quickly with sharp moves.
⛔ This is not financial advice; do your own research.

POL/USDT Trade Idea💎 BINANCE:POLUSDT Trade Idea 💎
📊 Pattern spotted: Double Bottom ✅
This setup indicates strong support around 0.2800 and signals a possible bullish reversal.
⚡ Entry (Advanced): 0.2860 – 0.2870
🎯 Target (TP): 0.2960
🛡️ Stop Loss (SL): 0.2800
✨ Risk/Reward: Low Risk – High Profit 🚀
This is an advanced entry with tight SL and strong upside potential.
📈 If the neckline breaks and sustains above, we can expect a bullish move towards the target.
🔑 Summary: Double Bottom gives confidence of reversal 📉➡️📈. Perfect setup for traders who like low loss & high reward opportunities.

POL ; Important supportHello friends
Given the upward trend we had, now that the price has corrected, we have identified important and good support areas for you, and if these supports are maintained and stabilized above, the price can move to the specified targets.
Trade safely with us

POLUSDTBINANCE:POLUSDT in high trading renge. But above dynamic trendline. We can open position buy but high risk level.
Supports: 0.2415 - 0.2300 - 0.2225
Resistances: 0.2600 - 0.2745
Please control risk management⚠️

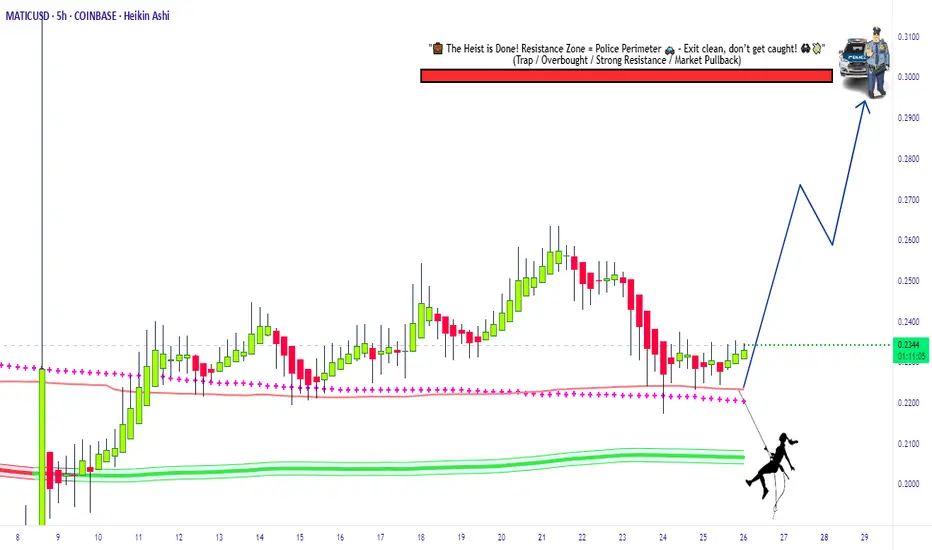
Swipe the Polygon Vault MATIC/USDT Bullish Heist Strategy🔥 MATIC/USDT Heist Plan: Swipe the Loot Before the Cops Clock In! 🏴☠️💸
🌍 Oi! Hola! Bonjour! Hallo! Marhaba!
💼 Welcome back, Money Makers & Market Bandits!
The Polygon (MATIC) vs Tether vault is wide open! Based on our 🔍 Thief Trading Style Analysis, it's time to plan the ultimate crypto chart robbery with a long-side assault on this bullish breakout. 📈💥
💣 Robbery Blueprint – The MATIC/USDT Master Plan
🚪 ENTRY STRATEGY: Get In, Get Rich, Get Out!
⚡ Vault Breach: Enter LONG at market price if you're bold & fast.
🎯 Smart Entry: Wait for price pullbacks on 15m/30m swing lows/highs.
💎 Use layered DCA-style orders for clean risk-controlled entries.
Thieves don’t rush—they snipe the perfect price levels.
🛑 ESCAPE PLAN: Stop Loss Strategy
📍 SL placed at: 0.2000 (based on 4H candle wick zone).
💡 Adjust SL to your loot capacity (risk, lot size, number of orders).
⚠️ If price dips near SL, that’s the cops knocking—bail fast or go down swingin’.
🎯 TARGETS: Stack Your Bags Before the Alarm Rings
🚀 Primary Target: 0.3000
🧲 Scalpers: Grab & Go! Stick to long bias only. Use trailing SL to protect the gains.
🎩 Swing Robbers: Hold strong. Watch for resistance traps & trailing stops near key zones.
📊 Market Intel: Why This Heist Has High Odds 🎯
🔋 Bullish pressure building with growing momentum.
📡 Supporting Data:
🔍 On-chain metrics signaling accumulation
💼 Macro sentiment favoring risk assets
🧠 COT reports + intermarket analysis leaning bullish
Just don’t get comfy—this is a heist, not a honeymoon!
🚨 Trade Warning – Don’t Get Caught!
📢 Major News Releases = High Volatility.
🚫 Avoid fresh trades during key announcements.
🔒 Use trailing SL to lock in profits & escape clean.
💥 Like, Follow & Power Up the Robbery Squad 💥
💬 Support the crew. Hit BOOST to keep these trade ideas flying.
Your thumbs-up fuels the next chart breach. 💪
📡 Stay locked in—more heist setups coming soon!
🎯 Trade Sharp. Swipe Smart. Escape Fast. 🏴☠️
Thief Trader Out. 🐱👤💰
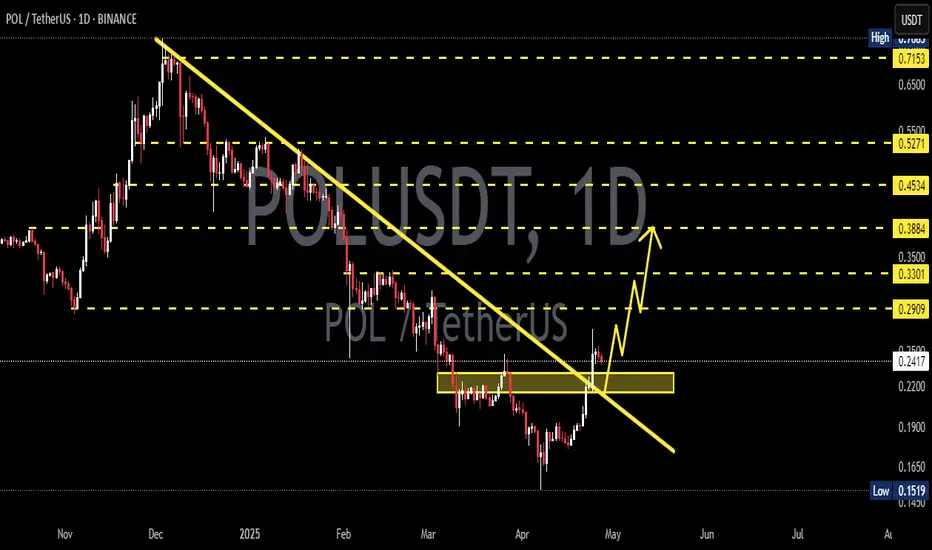
POL/USDT Preparing for a Major Breakout?📊 Chart Overview:
POL/USDT is currently showing signs of a potential trend reversal after months of sustained bearish momentum. The price is now testing a long-term descending trendline that has acted as a strong resistance since the November 2024 peak — and this moment could be a critical turning point for the market.
---
📌 Pattern Structure & Technical Setup:
🔸 Primary Pattern: Descending Trendline, capping every rally since late 2024.
🔸 Potential Reversal Structure: Falling Wedge Pattern – often a bullish reversal signal, supported by weakening bearish pressure and a series of higher lows forming since June 2025.
🔸 Current Position: Price is testing the trendline resistance around the $0.24–$0.27 zone.
---
📍 Key Price Levels:
✅ Resistance:
$0.2740 → Key breakout level; confirmation of trendline break.
$0.3290 → Important horizontal level, previously acted as major support.
$0.4301 – $0.7147 → Extended bullish targets based on Fibonacci retracement and historical price memory zones.
🛑 Support:
$0.2200 → Minor support if price rejects the trendline.
$0.1520 → Major long-term support (current all-time low).
---
📈 Bullish Scenario (Breakout Case):
If price successfully breaks and closes above $0.2740, we could expect:
Confirmation of a long-term downtrend breakout.
A shift in market sentiment from bearish to bullish.
Short-term target: $0.3290 → then $0.4301.
Higher upside potential if volume supports the breakout and altcoin momentum strengthens.
> 🚀 Volume will be the key validator – a breakout without volume = weak signal.
---
📉 Bearish Scenario (Rejection Case):
If the price fails to break the trendline:
Likely rejection and pullback toward the $0.2200 support zone.
If selling pressure increases, a retest of the $0.1520 demand zone is possible.
This would extend the consolidation phase or confirm continued bearish control over the medium term.
---
🔍 Conclusion & Trading Strategy:
POL/USDT is at a technical decision point. A confirmed breakout could mark the end of the accumulation/distribution phase and trigger a new bullish leg.
📌 Strategy Overview:
Breakout Traders: Enter after confirmed daily close above $0.2740, target levels above.
Reversal Traders: Enter conservatively after a retest of the breakout zone with a tight SL.
Bearish Traders: Consider shorts on strong rejection at the trendline, targeting $0.22 → $0.15.
---
🧠 Extra Notes:
Watch Bitcoin dominance and overall market sentiment.
Volume confirmation is crucial for validating breakout strength.
Be cautious of fakeouts, especially around dynamic resistance like trendlines.
#POLUSDT #CryptoBreakout #FallingWedge #AltcoinAnalysis #TechnicalAnalysis #CryptoSetup #PriceActionTrading #BullishBreakout #BearishScenario #CryptoReversal #TrendlineBreakout

POLUSDT 1D AnalysisPOL ~ 1D Analysis
#POL This coin is currently at its lowest support. Buy if you still have confidence in this coin with a short term target of at least 15%+ from this support.

POLUSDT 1D Analysis POL ~ 1D Analysis
#POL Buy gradually from here if you still have confidence in this coin with a short term target of at least 15%++ from here.

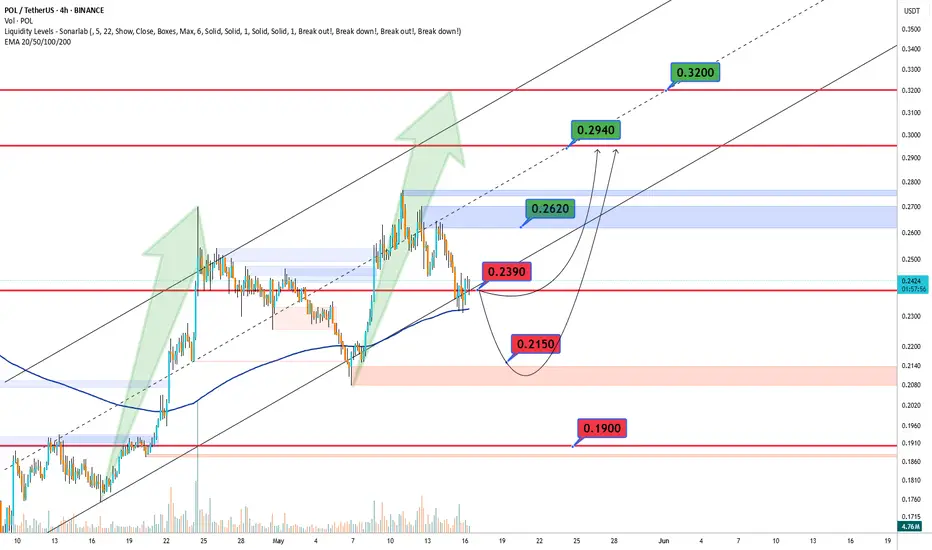
POLUSDT Bullish🔍 BINANCE:POLUSDT Technical Outlook – May 16 🔍
Bulls are watching the key $0.2390 level! 🔼
If broken, we could see a rally towards $0.2620, then $0.2940, and even $0.3200 if momentum stays strong 🚀
But if price gets rejected... 👀
Watch support at $0.2150 – and if that fails, $0.1900 could be next 🛑
📊 Current zones to watch:
🔴 Resistance: $0.2620 | $0.2940 | $0.3200
🟢 Support: $0.2390 | $0.2150 | $0.1900
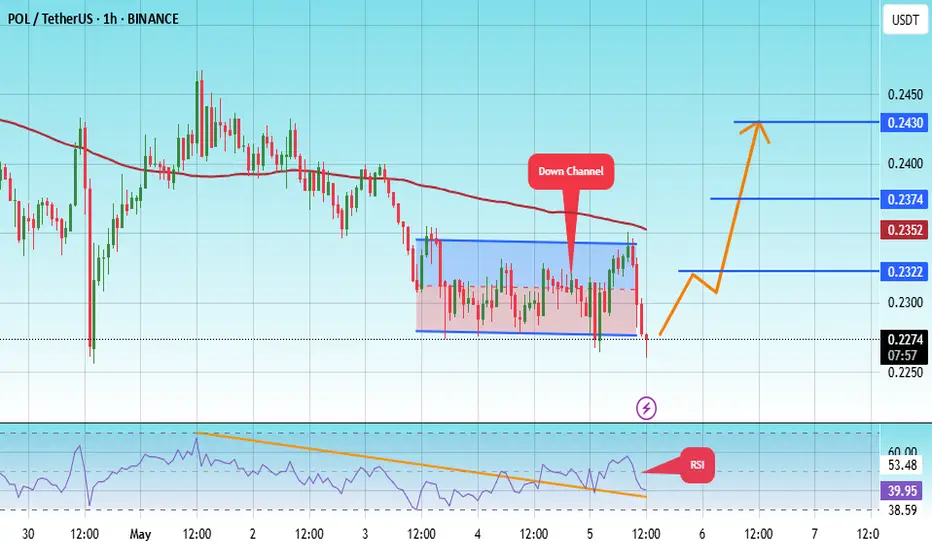
#POL/USDT#POL
The price is moving within a descending channel on the 1-hour frame, adhering well to it, and is on its way to breaking it strongly upwards and retesting it.
We are seeing a rebound from the lower boundary of the descending channel, which is support at 2270.
We have a downtrend on the RSI indicator that is about to break and retest, supporting the upward trend.
We are looking for stability above the 100 moving average.
Entry price: 0.2270
First target: 0.2322
Second target: 0.2374
Third target: 0.2430
POLUSDT 1D AnalysisPOL ~ 1D Analysis
#POL Buy gradually from here if you still have a Conviction on this coin with a short -term target of at least 15%+ from here.
POL is breakout out of the descending wedge upper trend line.POLYGON is now trading outside the upper trendline of the descending wedge pattern and may be preparing for a substantial move in the month of May.
Good luck, and always use a stop-loss!

POL Breaks Out of Monthly Downtrend, Ending Consolidation Phase.POL has recently emerged from a significant downtrend following an extended period of consolidation. It has successfully surpassed the 0.2200 resistance level that defined this consolidation range and is now working to maintain its position above this threshold. This presents a potential opportunity to enter a long position, with price targets set between the 0.2400 and 0.2500 levels.

Polygon is ready to take off!Hi fellow traders, POLUSDT is ready to make a move higher after completing the complex correction in WXY formation. Target the 0.8414 level. Good luck and trade safe!

MATICUSD - Large Double BottomPrice is reaching this area that has previously been seen as support
Suggesting another bottom here, creating a double bottom
This will lead price to new highs
Price is waiting to pop off

pol pol usdt daily analyses
time frame daily
risk rewards ratio > 5 ( incredibly )
look at the chart
this analyse is base on price action and support and resistance
pol has 2 resistance boxes above its price
the weak one ( red ) and the strong one (blue)
pol broke the weak resistance and price came down little and moved up and broke again.
now it pass the first box and will move to strong one.
if pol can break second resistance ( blue ) we will reach our valuable target and 500% benefit
it is not out of reach

Polygon (POL) AKA "MATIC" - Long Key LevelsPolygon (POL) or "MATIC" has experienced a strong rally recently, climbing from its monthly low of $0.40 to its current price of $0.70. This implosive move has brought the bulls to push POL to a critical descending trendline resistance level that the bears have held in a long-term downtrend since 2022.
The key level to watch is the $0.76 mark, where the neckline and trend line meet with previous resistance zones. A breakout above $0.76 could potentially surge POL to it's 1st target which is around a resistance level of: $0.89. If momentum continues, then price action will retest between: $1.23 - $1.48 representing a potential upside of +100% from the breakout at this current point

Polygon (POL ex-MATIC) gets increased accumulation: $1 soon?The Polygon token has reclaimed its position in the top 30 cryptocurrencies with a weekly price surge of ~50%. With this, this Ethereum-based Layer-2 altcoin is regaining momentum and preparing itself to achieve a multi-year high this bull run. We at CoinPedia have created an in-depth Polygon price analysis and possible short-term price targets.
After recording a new yearly low, the Polygon price has experienced a strong bullish reversal. This has resulted in this altcoin reclaiming an 8-month high. Moreover, the altcoin is on the verge of possibly breaching the resistance level of the channel pattern, highlighting increased bullish sentiment.
Moreover, with a surge of 143.36% during November, this altcoin has breached its resistance trendline of the descending channel pattern and has further formed an ascending channel pattern. Notably, this altcoin continues trading within it with a constant bullish price action.
The Moving Average Convergence Divergence (MACD) displays a constant green histogram in the 1D time frame. Moreover, with its averages recording a constant uptrend, the Polygon price may continue gaining momentum this week.
Maintaining the price above its support level of $0.690 could set the stage for this altcoin to prepare to retest its resistance level of $0.890. Furthermore, if the bullish momentum sustains at that point, this could result in it retesting its target price of $1.
Conversely, if the crypto market experiences an increase in liquidations, the POL coin price could retest its support level. Furthermore, if the bears dominate the crypto space, the MATIC price could retest its low of $0.50.
