POPCAT/USDT — Descending Triangle: Ready for a Major Move?1. Current Market Condition
POPCAT/USDT is sitting at a very critical level. After a prolonged downtrend since late 2024, the price has formed a clear descending triangle, with consistent lower highs pressing from above while the 0.22–0.30 support zone continues to act as a strong demand area.
This setup signals compressed volatility — price is being squeezed toward the apex of the triangle, usually leading to a significant breakout in either direction.
---
2. Key Technical Levels
Major Support Zone (Yellow Box): 0.22 – 0.30
Immediate Resistance: 0.3427 → 0.4067
Mid-range Resistance: 0.5714 → 0.8874
High Resistance Levels: 1.5238 → 1.9510
Extreme Support (if breakdown): 0.0869
---
3. Pattern Explanation
Descending Triangle → classically a bearish continuation pattern, but in crypto, it can also flip into a reversal if broken to the upside with strong volume.
Price Compression → narrowing range suggests a “build-up of energy” for a big move.
Historical Demand Zone → the yellow box has been repeatedly tested since 2024, making it a decisive battleground for bulls and bears.
---
4. Bullish Scenario
Confirmation: 2D candle close above the descending trendline and 0.34–0.35 with strong volume.
Upside Targets:
First target: 0.4067
Mid target: 0.5714
Extended target (if momentum continues): 0.8874
Bullish Flow: Breakout followed by a successful retest of the broken trendline as new support would strongly validate the bullish case.
---
5. Bearish Scenario
Confirmation: 2D candle close below 0.22 with high volume.
Downside Targets:
Initial target: 0.17–0.13
Extended target: 0.09 (historical low)
Bearish Flow: A breakdown of the major support opens the door to an extended downtrend, as liquidity beneath 0.22 is thin.
---
6. Conclusion & Trader Notes
POPCAT is at a make-or-break point. Holding the demand zone and breaking to the upside could trigger a significant rally, while losing support would resume the downtrend.
Conservative traders → wait for confirmation: breakout above 0.34 or breakdown below 0.22.
Aggressive traders → may accumulate small positions near support with tight stop-losses.
Key factor: breakout volume, 2D candle closes, and retest behavior at support/resistance.
This is a textbook example of the market “holding its breath” before a decisive move.
---
POPCAT is locked inside a descending triangle, pressing against the 0.22–0.30 support zone. The market is at a crossroads — will bulls push for a breakout toward 0.40 – 0.57 – 0.88, or will bears take control with a breakdown below 0.22 and drive price to 0.13–0.09?
The triangle is near its apex. A breakout or breakdown in the coming weeks could define the next major trend for POPCAT. Traders should prepare their strategies now, as the market’s decision is approaching.
---
#POPCAT #POPCATUSDT #CryptoAnalysis #DescendingTriangle #Breakout #BullishCase #BearishCase #AltcoinAnalysis #CryptoTrading
Popcatusdtlong

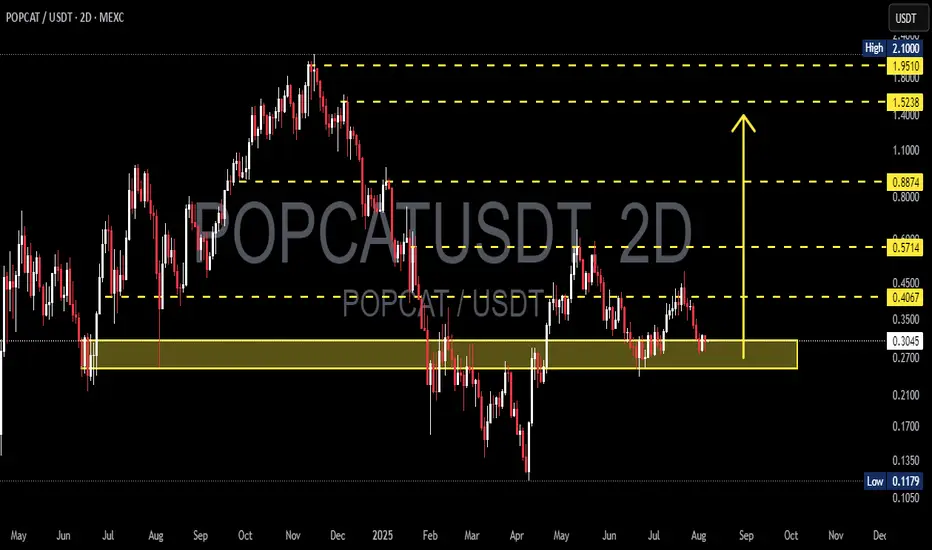
POPCAT/USDT – Testing Demand Zone: Reversal or Breakdown?POPCAT/USDT is currently retesting one of the most crucial demand zones in its mid-term price structure, located between $0.2700 – $0.3037. This area has historically acted as a strong support level and has triggered significant rebounds in the past. The market's reaction here will be key in determining whether POPCAT is ready for a bullish reversal or heading for a deeper correction.
---
🔍 Market Structure & Price Action
The price has entered a sideways consolidation phase after a steady decline from the $0.4067 region.
So far, the support zone at $0.2700 has been respected multiple times, indicating buying interest remains active.
However, no clear bullish reversal pattern has formed yet, making the next movement critical.
---
🟢 Bullish Scenario (Reversal / Bounce)
If the price manages to hold above this demand zone and forms a higher low along with a strong bullish candlestick confirmation, we could see a potential trend reversal.
🎯 Potential bullish targets:
TP1: $0.4067 – Minor resistance, top of the current range.
TP2: $0.5714 – Mid-range resistance, a previous breakdown zone.
TP3: $0.8874 – Major resistance, the last high before the steep drop.
TP4: $1.5238 – $1.9510 – Psychological resistance zone, possible medium-term swing targets if bullish momentum strengthens.
🔐 Key confirmations:
Bullish engulfing / hammer candlestick on the 2D chart.
Increase in volume + breakout above range resistance.
---
🔴 Bearish Scenario (Breakdown Continuation)
If the price fails to hold $0.2700 and we see a clear daily or 2D candle close below the demand zone, this would indicate loss of bullish strength and open room for further downside.
🎯 Bearish targets:
TP1: $0.2100 – Psychological support level.
TP2: $0.1179 – All-time low and historical bottom.
⚠️ Risk factors:
Strong bearish candle close + high volume breakdown would confirm sellers’ dominance.
---
🧩 Pattern & Formation Insights
A horizontal base / accumulation range is visible within the demand zone.
If the price rebounds, we could be forming a double bottom – a classic reversal signal.
However, if the zone breaks, the chart may develop into a descending channel or bearish continuation pattern.
---
🧠 Trading Strategy Outlook
Swing Traders: Consider long entries within the demand zone ($0.2700–$0.3037) with a tight stop-loss just below the zone. Aim for multiple resistance levels as take-profit targets.
Breakout Traders: Wait for confirmation above $0.4067 with increased volume.
Bearish Setup: Short entry upon breakdown below $0.2700 with targets towards the next support zones.
#POPCAT #AltcoinAnalysis #CryptoTechnicalAnalysis #DemandZone #BreakoutOrBreakdown #USDT #MEXC #SwingTrade #CryptoSetup #BullishReversal #BearishBreakdown #ChartAnalysis #TradingView
POPCATUSDT – Breakout Confirmation or False Signal?On the daily chart of POPCATUSDT, the price has recently broken out of a descending trendline that has been acting as resistance since December 2024. This breakout signals a potential trend reversal from bearish to bullish.
Currently, the price is in a retest phase, revisiting the breakout zone, which also aligns with a strong support and Fibonacci retracement area:
Support zone: $0.34 – $0.38
Fibonacci 0.618: $0.3490 (major technical support)
Fibonacci 0.5: $0.3759 (typical retest level after breakout)
If the price holds above this zone and forms a bullish confirmation candle, it strengthens the case for continued upward momentum.
---
Pattern and Market Structure:
Descending Triangle Breakout: The price has broken out of a long-standing descending triangle pattern, which is typically a bullish reversal signal — especially if supported by volume (not shown in chart but crucial).
Neckline Retest: The current move is retesting the breakout zone, a common behavior after significant breakouts.
---
Bullish Scenario:
If the price holds above the $0.34–$0.38 zone and forms bullish price action:
Potential targets based on Fibonacci levels:
Target 1: $0.5665
Target 2: $0.7254
Target 3: $0.9358
Major targets: $1.2247 and possibly $1.6029 if bullish momentum sustains
---
Bearish Scenario:
If the price fails to hold above $0.34 and breaks down below the support:
Potential downside towards $0.26 – $0.20 zone
If selling pressure intensifies, it may revisit the key support low around $0.1178
---
Conclusion:
POPCATUSDT is at a critical decision point. The breakout from the descending trendline is an early bullish signal, but confirmation from the $0.34–$0.38 retest zone is essential. If it holds, a strong bullish rally may follow. However, a failure to hold could signal a false breakout and resume the bearish trend.
#POPCAT #POPCATUSDT #CryptoBreakout #AltcoinAnalysis #ChartPatterns #TechnicalAnalysis #FibonacciLevels #CryptoTrading #BullishSetup #BearishScenario
