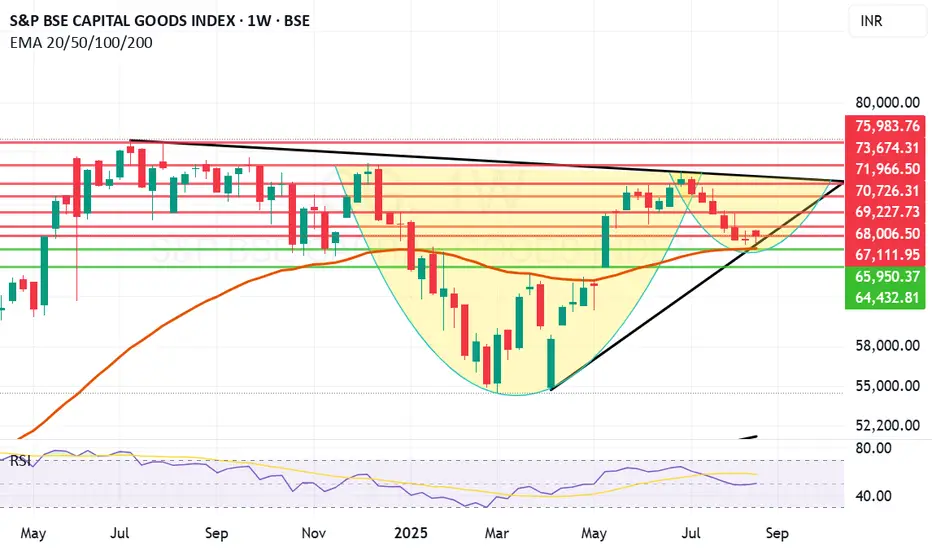
BSE Capital Goods Index: A potential Candidate for a Breakout. BSE Capital Goods index this week has taken support near the Mother line on weekly chart. Currently the weekly close at 67151. Mother line support is at 66005. If the Index can manage to close above 67893 or 68227 there is a strong chance of revival which can take the index towards 70727, 71K or even 72K+ levels as indicated in the chart. For this to happen the index needs to hold current level not close below 66K levels (Mother line) and move Northwards. In case 66K is broken the index can fall towards 65 or 64K levels. Right now the support is taken so the index looks strong. The pattern that we are seeing on charts is similar to cup and handle formation in progress. The formation has not succeeded so far but if this formation comes in full effect, the index will become very strong.
When the index is strong and gives a breakout it means that the undercurrent in majority of the companies which constitute the index is strong. There will be some companies which will obviously drag the index down as there cannot be one-way traffic. To know amongst these which companies to invest in an investor should look at fundamentals of the company, recent and past results, cash flows, Sales and order books, EPS and many other factors. While a Technical investor should look at charts of the companies before investing.
The BSE Capital Goods index consists of 36 companies. The companies that constitute this index are HAL, Suzlon, Titagharh, BEL, Cochin Shipyard, Zentech, Mazdock, Fincables, BDL, Inox wind, CG Power, Kaynes, PTCIL, Polycab, Cummins, Power India, Apar, BHEL, ABB, Astral, Siemens, Kirloskar Engine, Triveni Turbine, KEI, Carborandum, Supreme Industries, Grindwell, Thermax, Praj, Elgi Equipments, Honeywell, Jyoti CNC, Timken, SKF India, AIA Engineering and LMW. The focus should be on companies which have major market which caters to local consumption or exports order to the US. Look for strong performers within this index who have given a good result this quarter and have strong EPS growth and good order books as well as trailing PE ratio less than 10 years Average PE ratio. This would result in you finding out the companies which are undervalued and have good growth potential. Capital Goods are essential for a country to grow. A strong GDP will mostly mean strong performance by some these companies.
A smart investor would be a person who looks at both fundamentals and technicals of the company and invests in a fundamentally strong company which is giving a technical breakout. For this one has to learn Techno-Funda analysis. I have written a book on the subject called The Happy Candles Way To Wealth Creation. In this book you will learn the basics of Techno-Funda investing. The book is available on Amazon and is one of the highest rated books in its category. With an approval rating of 4.8/5 as on date. Lot of investors call it as a Hand book for Techno Funda investing. Most of the chapters are standalone and can be read at your own accord. It will be really helpful to you. To know more about Mother line, Father line and my Mother, Father and Small child theory, Parallel Channel you should once again I recommend, read my book the Happy Candles Way to Wealth Creation.
Disclaimer: The above information is provided for educational purpose, analysis and paper trading only. Please don't treat this as a buy or sell recommendation for the stock or index. The Techno-Funda analysis is based on data that is more than 3 months old. Supports and Resistances are determined by historic past peaks and Valley in the chart. Many other indicators and patterns like EMA, RSI, MACD, Volumes, Fibonacci, parallel channel etc. use historic data which is 3 months or older cyclical points. There is no guarantee they will work in future as markets are highly volatile and swings in prices are also due to macro and micro factors based on actions taken by the company as well as region and global events. Equity investment is subject to risks. I or my clients or family members might have positions in the stocks that we mention in our educational posts. We will not be responsible for any Profit or loss that may occur due to any financial decision taken based on any data provided in this message. Do consult your investment advisor before taking any financial decisions. Stop losses should be an important part of any investment in equity.
Potentialbreakout
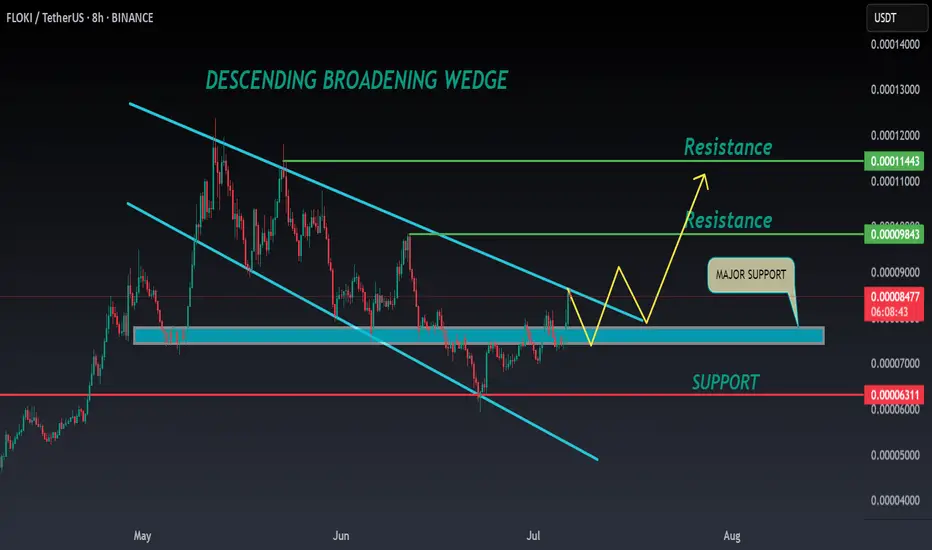
FLOKI ANALYSIS🔮 #FLOKI Analysis 🚀🚀
💲💲 #FLOKI was trading in a Descending Broadening Wedge Pattern, and trying to breakout the pattern. Also there is a instant support zone and after the breakout of resistance zone we will see a bullish move. 📈📈
💸Current Price -- $0.00008540
📈Target Price -- $0.00009840
⁉️ What to do?
- We have marked crucial levels in the chart . We can trade according to the chart and make some profits. 🚀💸
#FLOKI #Cryptocurrency #Breakout #DYOR
Tata Power is showing strengthTata Power's technical indicators suggest a strong buy signal based on moving averages and oscillators. Here’s a quick breakdown:
- Relative Strength Index (RSI): 65.04 (indicating bullish momentum)
- MACD: 3.38 (positive crossover, signaling upward trend)
- Moving Averages: All major SMAs and EMAs indicate a buy
- Pivot Points: Key support at ₹388.64, resistance at ₹398.69
Close Above 400 mark will be positive
- Short-Term Forecast: Technical analysis suggests support around ₹390 and resistance near ₹626, with a potential price target of ₹417.23 in the next two weeks.

DEXE ANALYSIS📊 #DEXE Analysis
✅There is a formation of Descending triangle pattern on daily chart 🧐
Pattern signals potential bullish movement incoming after a breakout.
👀Current Price: $14.68
🚀 Target Price: $18.50
⚡️What to do ?
👀Keep an eye on #DEXE price action and volume. We can trade according to the chart and make some profits⚡️⚡️
#DEXE #Cryptocurrency #TechnicalAnalysis #DYOR

BTC ANALYSIS 🔮 #BTC Analysis 🚀🚀
💲💲 #BTC is trading between support and resistance area. There is a potential rejection again from its resistance zone and pullback from its major support area. If #BTC breaks resistance zone $88500 then there will a chance of bullish movement
💸Current Price -- $84470
⁉️ What to do?
- We have marked crucial levels in the chart . We can trade according to the chart and make some profits. 🚀💸
#BTC #Cryptocurrency #DYOR

OM ANALYSIS🔴 #OM Analysis :
🔮There is a formation of "Bullish Pennant Pattern" in #OM in 4hr time frame. #OM is trading around its all time high level. We may see a little retest before a bullish move
⚡️What to do ?
👀Keep an eye on #OM price action. We can trade according to the chart and make some profits. ⚡️⚡️
#OM #Cryptocurrency #Breakout #DYOR

PHB ANALYSIS🚀#PHB Analysis :
🔮As we can see in the chart of #PHB that there is a formation of "Descending Channel Pattern". Expecting a bullish move after the breakout of major resistance zone in few days.📈
🔰Current Price: $2.010
🎯 Target Price: $2.815
⚡️What to do ?
👀Keep an eye on #PHB price action. We can trade according to the chart and make some profits⚡️⚡️
#PHB #Cryptocurrency #TechnicalAnalysis #DYOR

ETH ANALYSIS🔮 #ETH Analysis 🚀🚀
💲💲 #ETH is trading in a Descending Broadening Wedge Pattern. And the price pullbacks from support zone.
There is an instant resistance area and if it sustain here then we will see a bullish move
💸Current Price -- $2678
📈Target Price -- $3310
⁉️ What to do?
- We have marked crucial levels in the chart . We can trade according to the chart and make some profits. 🚀💸
#ETH #Cryptocurrency #DYOR

INJ ANALYSIS🚀#INJ Analysis :
🔮#INJ is trading in a symmetrical triangle pattern on the daily timeframe. 💁♂️
We could expect a breakout and reach towards resistance 1 zone and could expect a potential bullish move📈
Expect a bullish wave of around 20-25% in the coming days
🔰Current Price: $20.20
🎯 Target Price: $27.35
⚡️What to do ?
👀Keep an eye on #INJ price action. We can trade according to the chart and make some profits⚡️⚡️
#INJ #Cryptocurrency #TechnicalAnalysis #DYOR

SOL ANALYSIS🔮 #SOL Analysis 💰💰
🌟🚀 There is a complete formation of Cup and Handle Pattern in #SOL in weekly timeframe. We are just waiting for a perfect breakout. If #SOL breakout with good volume then we will see a very good bullish move.🚀🚀
🔖 Current Price: $168
⏳ Target Price: $250
⁉️ What to do?
- We have marked some crucial levels in the chart. We can trade according to the chart and make some profits in #SOL. 🚀💸
#SOL #Cryptocurrency #DYOR

RAY ANAlYSIS🔮 #RAY Analysis 💰💰
📊 #RAY is making perfect and huge rounding bottom pattern in daily time frame, indicating a potential bullish move. If #RAY breakout the pattern with high volume then we will get a bullish move📈
🔖 Current Price: $2.375
⏳ Target Price: $2.990
⁉️ What to do?
- We have marked crucial levels in the chart . We can trade according to the chart and make some profits. 🚀💸
#RAY #Cryptocurrency #Pump #DYOR

ONDO ANALYSIS📊 #ONDO Analysis
✅There is a formation of Descending Channel Pattern and Cup and Handle in daily chart with a breakout of Descending Channel 🧐
Pattern signals potential bullish movement incoming after the confirmation of breakout of Cup and Handle.
👀Current Price: $0.81600
🚀 Target Price: $1.02090
⚡️What to do ?
👀Keep an eye on #ONDO price action and volume. We can trade according to the chart and make some profits⚡️⚡️
#ONDO #Cryptocurrency #TechnicalAnalysis #DYOR

IMX ANALYSIS📊 #IMX Analysis
✅There is a formation of Descending Channel Pattern in daily chart with a breakout🧐
Pattern signals potential bullish movement incoming after the confirmation of breakout and a small retest📉
👀Current Price: $1.640
🚀 Target Price: $2.560
⚡️What to do ?
👀Keep an eye on #IMX price action and volume. We can trade according to the chart and make some profits⚡️⚡️
#IMX #Cryptocurrency #TechnicalAnalysis #DYOR

AMBER ENTERPRISES-Weekly Breakout with Strong MomentumBreakout Confirmation: Amber Enterprises has given a decisive breakout above the crucial Fibonacci 23.6% level (₹5,206), with a significant price surge. This breakout was accompanied by heavy volume , indicating strong bullish momentum and participation.
Fibonacci Levels:
The stock retraced from its highs at ₹6,256.7, respecting the Fibonacci levels:
38.2% retracement at ₹4,557.35.
50% retracement at ₹4,032.40.
61.8% retracement at ₹3,507.50, which acted as a strong support before the stock resumed its upward movement.
The breakout above ₹5,206 now opens the path towards the previous highs around ₹6,256.7.
Bullish Trendline Support: The stock has been respecting an ascending triangle pattern, marked by higher lows, which reflects accumulation and strengthening of the uptrend. The recent breakout from this triangle pattern gives further bullish confirmation.
Targets Ahead:
Near-term target : Based on the breakout and the height of the triangle, the immediate target is around ₹6,256, which aligns with the 0% Fibonacci level.
Potential upside projection : Using the measured move from the breakout, the stock has a potential to reach ₹6,900-7,000 levels, reflecting a 30-40% upside from the breakout point.
RSI Momentum : The RSI has broken above the 70-mark, entering the overbought zone, which confirms strong bullish momentum. However, the overbought condition may suggest some consolidation in the short term before the next leg up.
Support Levels : On any pullback, strong support lies around the Fibonacci 38.2% level at ₹4,557.35, followed by ₹4,032.40 (50% level). As long as these supports hold, the overall trend remains bullish.
Conclusion : Amber Enterprises is showing a powerful breakout with high volume, indicating a potential bullish rally in the coming weeks. Traders can look for opportunities on pullbacks or momentum continuation above ₹5,500, with a near-term target of ₹6,256 and a possible extension towards ₹6,900.

JASMY ANALYSIS📊 #JASMY Analysis
✅There is a formation of Descending triangle pattern on daily chart 🧐
Pattern signals potential bullish movement incoming after a breakout
👀Current Price: $0.01950
🚀 Target Price: $0.03150
⚡️What to do ?
👀Keep an eye on #JASMY price action and volume. We can trade according to the chart and make some profits⚡️⚡️
#JASMY #Cryptocurrency #TechnicalAnalysis #DYOR

NQ Power Range Report with FIB Ext - 10/1/2024 SessionCME_MINI:NQZ2024
- PR High: 20245.75
- PR Low: 20213.25
- NZ Spread: 72.5
Key scheduled economic events
09:45 | S&P Global US Manufacturing PMI
10:00 | ISM Manufacturing PMI
- ISM Manufacturing Prices
- JOLTs Job Openings
Inventory dip to ~20060 before retracing back into week range
Session Open Stats (As of 12:25 AM 10/1)
- Weekend Gap: N/A
- Session Gap 7/24: -0.32% (open > 19946)
- Gap 10/30/23 +0.47% (open < 14272)
- Session Open ATR: 322.66
- Volume: 23K
- Open Int: 237K
- Trend Grade: Bull
- From BA ATH: -3.1% (Rounded)
Key Levels (Rounded - Think of these as ranges)
- Long: 20954
- Mid: 19814
- Short: 17533
Keep in mind this is not speculation or a prediction. Only a report of the Power Range with Fib extensions for target hunting. Do your DD! You determine your risk tolerance. You are fully capable of making your own decisions.
BA: Back Adjusted
BuZ/BeZ: Bull Zone / Bear Zone
NZ: Neutral Zone

FTM ANALYSIS🚀#FTM Analysis : Pattern Formation
🔮As we can see in the chart of #FTM that there is a formation Inverse Head And Shoulder Pattern and it's a bullish pattern. If the candle closes above the neckline then a bullish move could be confirmed✅️
🔰Current Price: $0.5160
🎯 Target Price: $0.7140
⚡️What to do ?
👀Keep an eye on #FTM price action. We can trade according to the chart and make some profits⚡️⚡️
#FTM #Cryptocurrency #TechnicalAnalysis #DYOR

ROSE ANALYSIS🚀#ROSE Analysis : What Next ??💲
✅As we can see that there was a formation of "FALLING WEDGE PATTERN" in #ROSE. We are expecting a bullish move in #ROSE after a breakout of falling wedge pattern
🔰Current Price: $0.06235
🎯 Target Price: $0.09755
⚡️What to do ?
👀Keep an eye on #ROSE price action. We can trade according to the chart and make some profits. Stay tuned for further analysis and stay updated with market sentiments and news.⚡️⚡️
#ROSE #Cryptocurrency #TechnicalAnalysis #DYOR

PEPE ANALYSIS🚀#PEPE Analysis :
🔮#PEPE is trading in a symmetrical triangle pattern on the daily timeframe💁♂️
We could expext a breakout of the symmetrical triangle pattern and could expect a potential bullish move📈
Expect a bullish wave of around 50% in the coming weeks
🔰Current Price: $0.00000780
🎯 Target Price: $0.00001200
⚡️What to do ?
👀Keep an eye on #PEPE price action. We can trade according to the chart and make some profits⚡️⚡️
#PEPE #Cryptocurrency #TechnicalAnalysis #DYOR

BTC ANALYSIS🔮 #BTC Analysis
🌟🚀 #BTC is trading in an Ascending Triangle Pattern and here we can see that #BTC test the resistance zone too many time. Now we can expect a breakout and a long rally in #BTC .💲💲
🔖 Current Price: $61150
⏳ Target Price: $65600
⁉️ What to do?
- We have marked crucial levels in the chart . We can trade according to the chart and make some profits. 🚀
#BTC #Cryptocurrency #Breakout #DYOR

QNT ANALYSIS🔮 #QNT Analysis - Breakout 🚀🚀
💲💲 In daily time-frame,Falling Wedge Pattern is forming✅
But right now we can see that #QNT is testing its major resistance zone if #QNT breaks the pattern and also breaks the resistance zone with high volume then we would see a bullish move 💯🚀
💸Current Price -- $66.8
📈Target Price -- $122.7
⁉️ What to do?
- We have marked crucial levels in the chart . We can trade according to the chart and make some profits. 🚀💸
#QNT #Cryptocurrency #Breakout #DYOR

SAGA ANALYSIS🔮 #SAGA Analysis 🚀🚀
As we can see that #SAGA is trading in a Descending Channel Pattern in daily time frame. Also there is a formation of double bottom pattern which indicates a bullish momentum. A perfect breakout of both pattern will make a bullish movement in #SAGA 💸 💯🚀
💸Current Price -- $1.2490
📈Target Price -- $3.1470
⁉️ What to do?
- We have marked crucial levels in the chart . We can trade according to the chart and make some profits. 🚀💸
#SAGA #Cryptocurrency #DYOR

AKRO ANALYSIS🔮 #AKRO Analysis 🚀🚀
As we can see that #AKRO is trading in a Descending Triangle Pattern in daily time frame. Also it is trading in a parallel channel. A breakout of both pattern will make a bullish movement in 💸 💯🚀
💸Current Price -- $0.004835
📈Target Price -- $0.014000
⁉️ What to do?
- We have marked crucial levels in the chart . We can trade according to the chart and make some profits. 🚀💸
#AKRO #Cryptocurrency #DYOR
