BTDR Nothing changedHuge daily candles are perfectly normal behaviour and nothing to be afraid of, we stay zoomed out to observe the larger trend to keep our emotions check. It is feature of these type of assets and is why we can make so much money from them when using the right risk management strategy.
Our first profit target has been hit at $25 all time High Volume Node where price is finding a range as some exit. Price has done 10x since the 2023 bottom. Once this range has worked itself out price is expected to continue upwards into price discovery. A retracement to the weekly pivot should be expected, where I will add to my positions and look for a long.
The macro structure is bullish in an Elliot wave ABC as there are many series of 3 wave structures. Wave (3) of C of (C) is underway with a target of the 1.618 Fibonacci extension $41.17. Price can significantly overextend in volatile assets with momentum and it’s these extremities we look to take secondary profit.
🎯 Terminal target for the business cycle is still the channel upper boundary and R3 weekly pivot at $55. A break out above this would be very bullish and could see prices as high as $80+
📈 Weekly RSI has months left of upside potential.
👉 Analysis is invalidated below wave B and 200EMA, $11.
Power

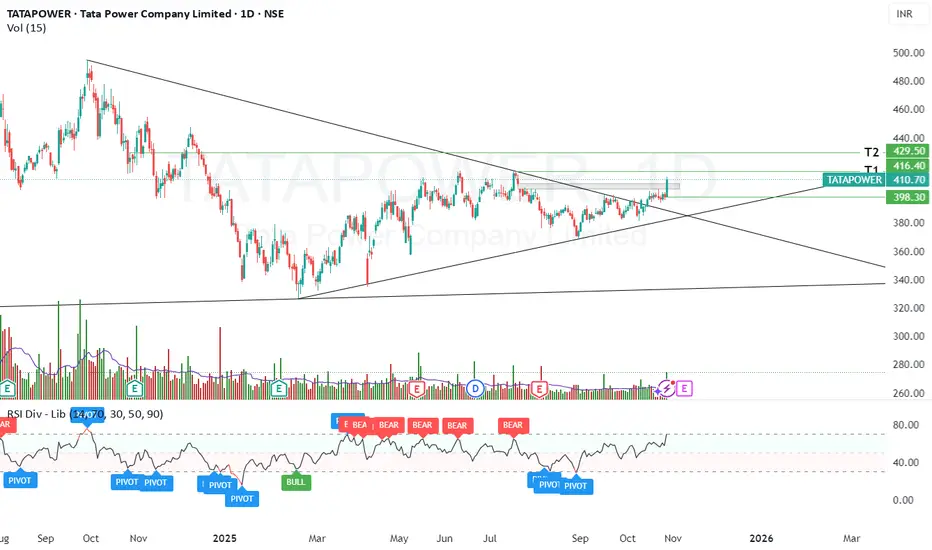
TATA POWER – Reversal Setup Near Key Support | Cup & Handle TATA POWER – Reversal Setup Near Key Support | Cup & Handle Retest
For Study Purpose Only
🕒 Timeframe: Weekly & Daily
💡 Pattern: Cup & Handle (trendline retest + neckline breakout)
📈 Current Zone: ₹400–₹410
🎯 Targets: ₹418 / ₹430
⏳ Duration: 10–15 Days
🧭 Technical View:
On the weekly chart, Tata Power has taken support along the previous cup-and-handle trendline, right near the lower boundary of the handle, and has reversed upward from this level — suggesting a continuation of the larger bullish structure.
On the daily chart, the stock has delivered a clean neckline breakout while also filling the earlier runaway gap in the ₹400–₹410 zone. This gap fill acts as a successful retest of support and builds a foundation for the next leg up.
The price has shown healthy consolidation just below ₹400, forming a base with stable volume. A sustained close above ₹400 could trigger a short-term reversal move toward ₹418 and ₹430 levels in the coming sessions.
📊 Study Highlights:
Weekly support confirmation at previous trendline
Neckline breakout with retest on daily chart
Gap fill adds confidence to structural strength
Consolidation phase ending near ₹400
Momentum recovery visible on short-term indicators
⚠️ Disclaimer:
This analysis is purely for educational and study purposes. Not a buy/sell recommendation. Always conduct your own due diligence.
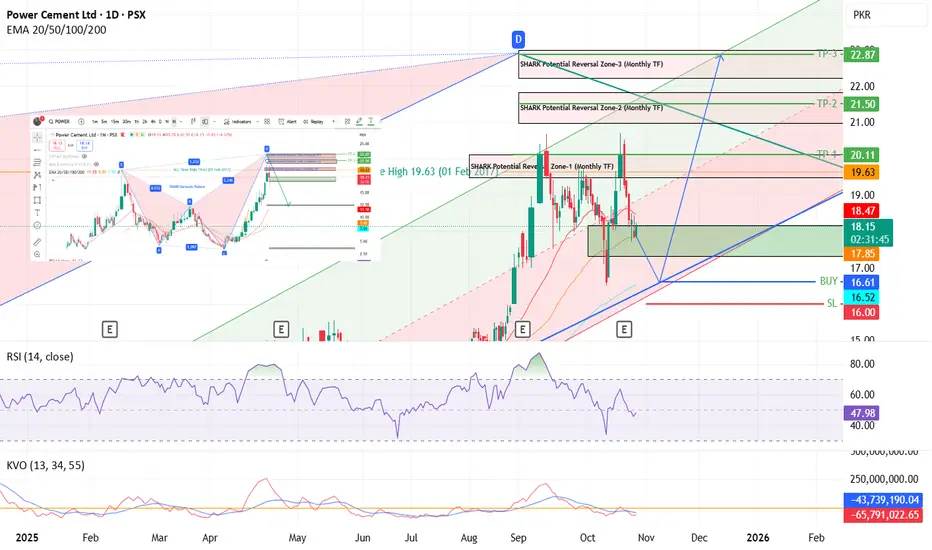
POWER - PSX - Technical Analysis - Monthly & DailyPOWER on Monthly Time Frame, has completed the SHARK Harmonic Pattern Zone-1 and has tested it twice and then price came down. It may even try to test Zone 2 or Zone 3 by taking support from Weekly Trend Line (Blue). Even presently price is in support zone (green) and may go up again from this zone.
A regression channel has also been drawn which price is following.
In my personal opinion, price will try to test SHARK Potential Reversal zone 3 before eventually coming down.
I recommend entering the trade as marked on the chart. From 17 to 23 in next 2 to 3 months is quite possible.
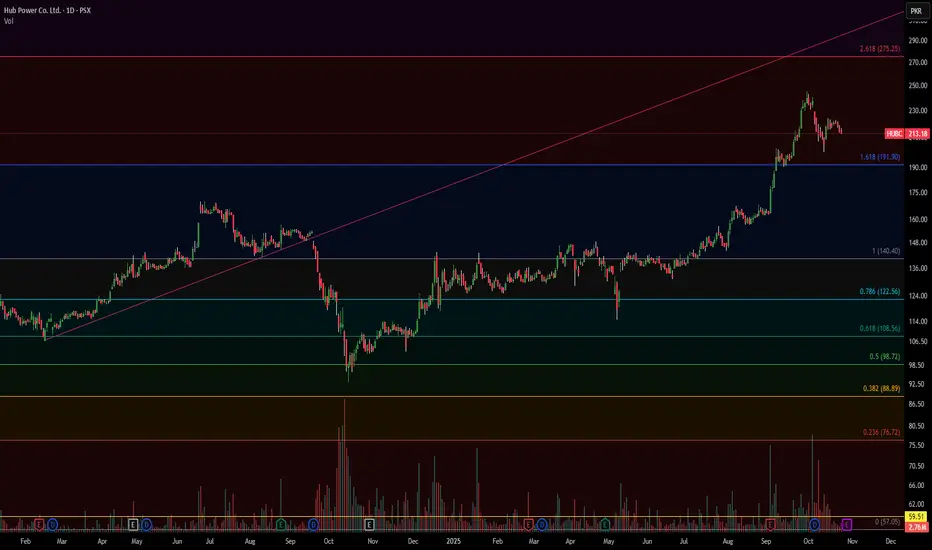
Hub Power Co. Ltd. (Daily chart analysis):Current Situation:
Price: 213.18 PKR, down 0.68%
The stock is in a correction phase after a parabolic rally to 250+ in October
Key Technical Observations:
Trend Structure:
Strong uptrend from August-October 2025, breaking above long-term resistance
Currently pulling back after reaching the 1.618 Fibonacci extension (275.25)
Price rejected at the red diagonal resistance trendline
Fibonacci Retracement Levels (from recent rally):
0.236 (76.72): Extreme support - major breakdown level
0.382 (86.89): Deep correction zone
0.5 (98.72): Half retracement
0.618 (108.56): Strong support zone ✓
0.786 (132.56): Current battle zone - KEY LEVEL
1.0 (140.40): Previous resistance, now support
Critical Support/Resistance:
Support:
Immediate: 210-213 (current price action)
Strong: 191-195 (1.618 Fib + psychological level)
Major: 140-145 (1.0 Fib + previous resistance turned support)
Critical: 132 (0.786 Fib)
Resistance:
Immediate: 220-225 (short-term)
Strong: 240-245 (recent highs)
Major: 250-255 (all-time high zone)
Volume Analysis:
Multiple volume spikes throughout the chart (circled)
Recent volume elevated but declining - suggests weakening buying pressure
Distribution pattern forming at the top
Pattern Recognition:
Potential rising wedge/parabolic blow-off top pattern
Red trendline acting as dynamic resistance
Price struggling to hold above the 1.618 Fib level (191.90)
Technical Outlook:
Bearish Scenario (Higher Probability):
If 210 breaks, expect a move toward 191-195 zone
Break below 191 could trigger deeper correction to 140-145 (30% pullback)
The parabolic nature of the rally suggests a significant retracement is likely
Bullish Scenario:
Needs to reclaim and hold above 220-225 with volume
Break above 240 would invalidate the correction and resume uptrend
Target: Retest of 250-260 highs
Trading Strategy:
Short-term: Bearish - avoid catching falling knives
Watch for support at 191-195 for potential bounce
Conservative buyers should wait for stabilization around 140-150 zone
Stop loss for any long positions: Below 190
Risk Assessment: The steep rally suggests profit-taking pressure. The stock may need time to consolidate before the next leg up. Be cautious of FOMO buying at current levels.
Wulf exhausted?NASDAQ:WULF appears exhausted at the upper channel boundary and I have exited completely for now. The Elliot wave pattern completes a leading diagonal which hints at higher to go after a wave 2 pullback which could end at the 0.382 Fibonacci retracement but more a likely target is the 0.5 Fib at $5.84 also the weekly 200EMA.
Breaking out above the channel would change the count and structure and be very bullish. RSI has been overbought for a while. For now we watch and wait.
Safe trading

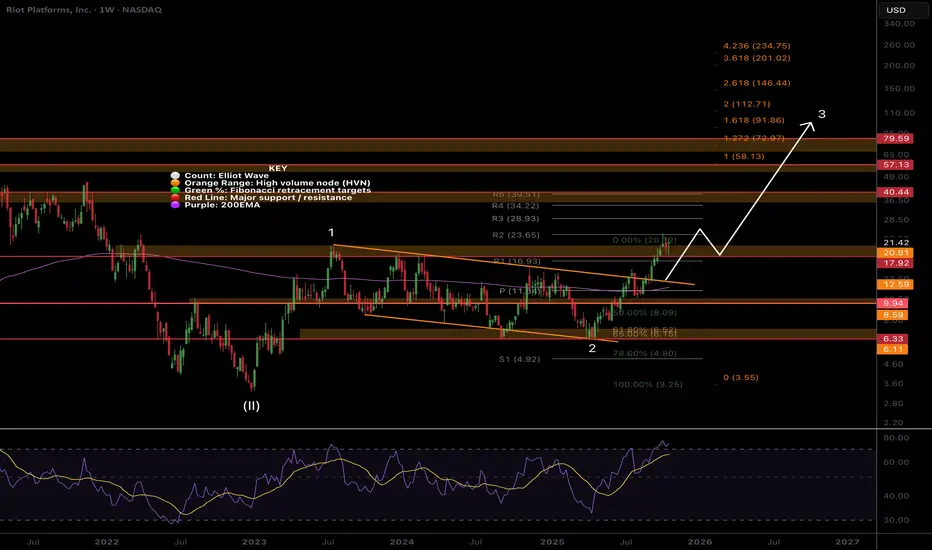
RIOT upwards momentum well in tactNASDAQ:RIOT Price remains in momentum breaking out of the channel in a wave 3 with a minimum target of the 1.618 Fibonacci extension at $91, a 4x from here.
Wav 2 completed at triple support- Fibonacci golden pocket, High Volume Node and channel boundary before quickly overcoming the weekly pivot and 200EMA. Breaking out above wave 1 is a show of strength,
Price should stall at the High Volume Nodes as supply comes in, $21, $40 and $57 but ultimately they should be overcome.
Weekly RSI is overbought where it can stay for months as price extends.
Higher Bitcoin = Higher targets
Safe trading
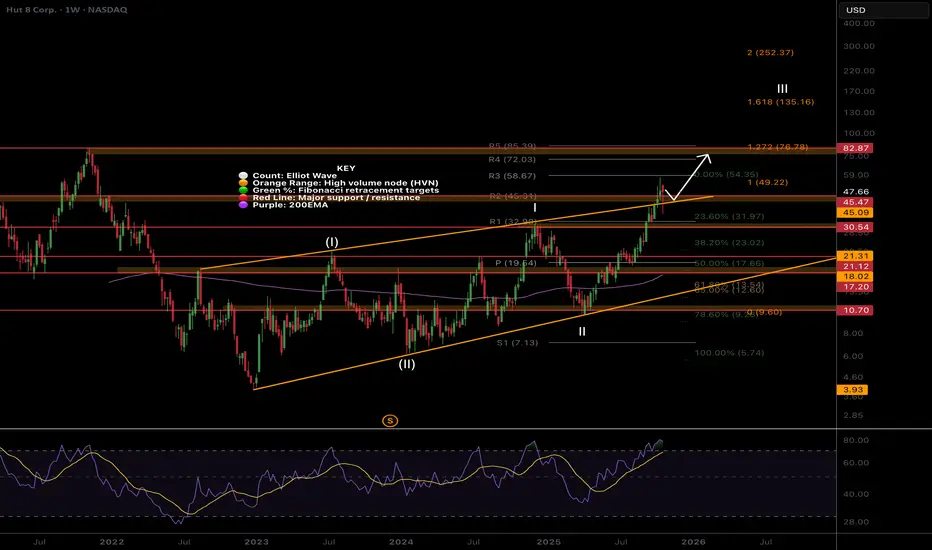
$HUT Breaking out, test of channel done and dusted!Hut has broken out of the channel upper boundary and a test of the boundary took place as expected, quickly catching a bid and recovering 17% Friday, producing a long signal for me.
The next target is the High Volume Node resistance at $82 just under the R5 weekly pivot. Fibonacci extension has a minimum target of the 1.618, $135.
The Elliot wave count suggests a very bullish move come in wave III of (III) which would overextend the 1.618 target above, $200+.
RSI is overbought but can remain here for months.
Safe trading
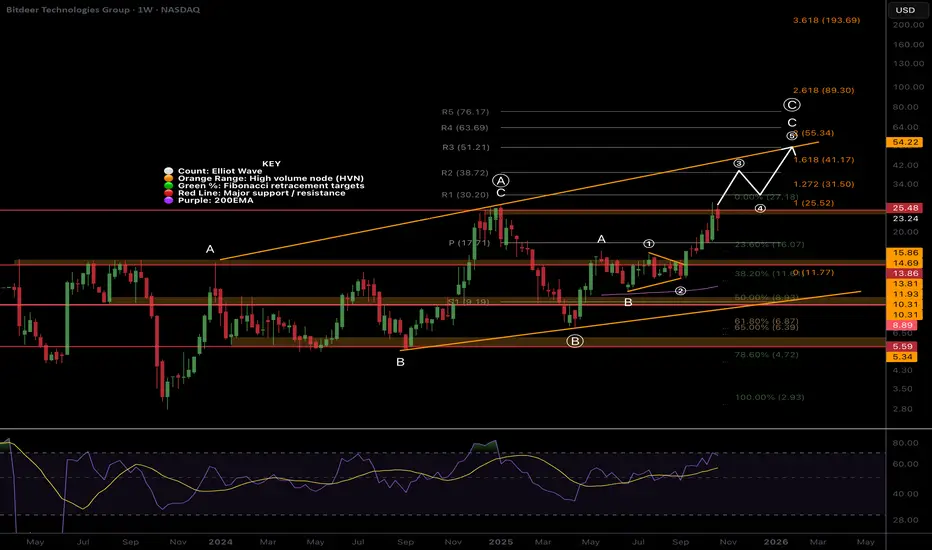
Bitdeer BTDR Macro Outlook. Nothing changed, Min 2x to come $54NASDAQ:BTDR is a low-cap volatile asset so traders and investors should expect wild pullbacks like we are seeing and is feature of these type of assets and is why we can make so much money from them when using the right strategy.
The macro structure is bullish in an Elliot wave ABC as there are many series of 3 wave structures.
Wave (3) of C of (C) is underway with a minimum target of the 1.618 Fibonacci extension $41.17 but price can significantly overextend in these assets.
Terminal target is the channel upper boundary and R3 weekly pivot at $55. A break out above this would be very bullish and could see prices as high as $80+
RSI has months left of upside. Analysis is only invalidated below the 200EMA.
Safe trading
RIOT wave 3 continues, $57 min targetWave 3 continues in NASDAQ:RIOT per previous posts with a minimum target of the $57 High Volume Node

CLSK Almost confirmed huge macro triangle breakout signal!NASDAQ:CLSK Should hit the wave D high today signalling the macro triangle breakout is ready to really move!
Nothing more to add.. send it!
Safe trading
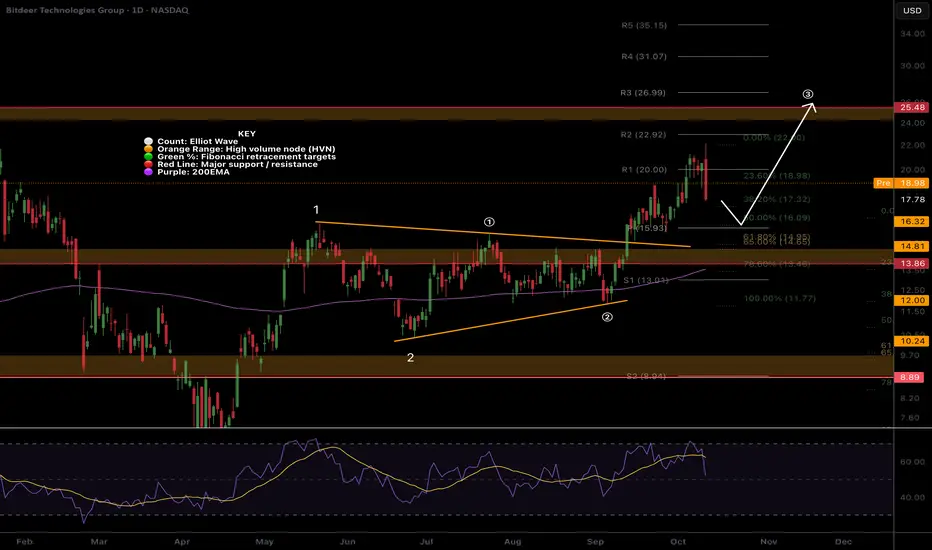
BTDR Volatile, but uptrend intactNASDAQ:BTDR had a huge bearish engulfing candle Friday. I keep my positions smaller on these assets.
Price is still in a wave 3 breakout towards the $25 High Volume Node target. It appears wave (1) of 3 is complete with a wave (2) target of the daily pivot and 0.5 Fibonacci or golden pocket zone nearby. That would also test the untested wave 1 high as support a highly likely event.
RSI has reset to the EQ where it often finds support in a strong uptrend.
Safe trading
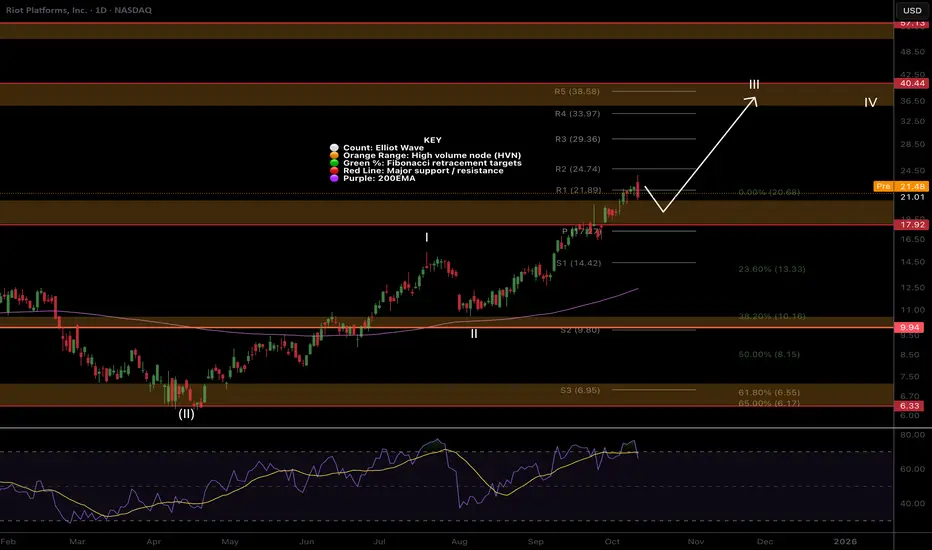
RIOT.. Nothing changed, $40 targetNASDAQ:RIOT broke out through resistance earlier than expected! A retest of the High Volume Node as support is highly likely event and price has a little down to go to get there. It may even be front run today.
RSI is overbought with no bearish divergence and can persist here for months in trending asset.
Wave II is underway and the next target is $40 High Volume Node resistance and the R5 daily pivot.
Safe trading
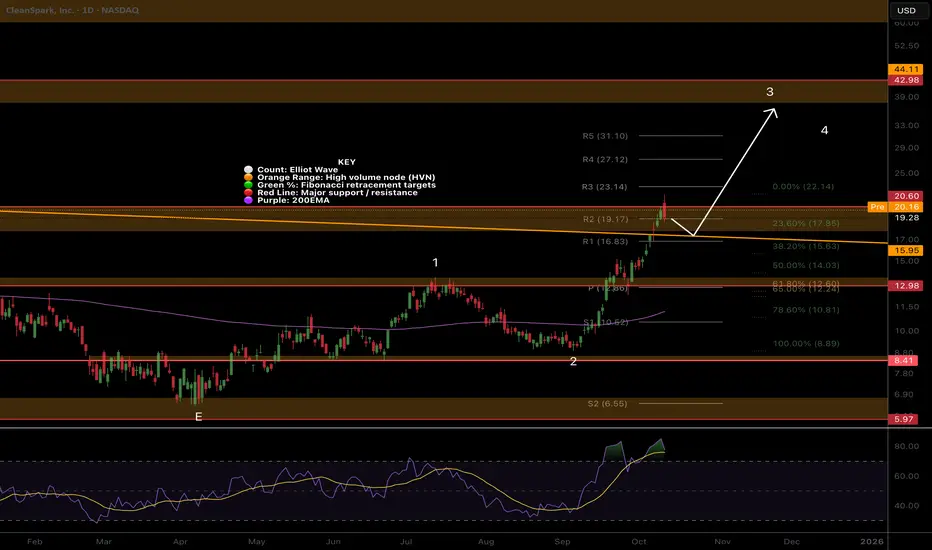
CLSK Rejected at thr major resistance, higher to go CLSK hit our first take profit target at the major resistance High Volume Node but has broken out of the macro triangle structure hinting at a big move still to come! Nothing concerning for me yet happening.
Wave 3 is underway to a minimum target of the $40 High Volume Node
RSI is overbought but no divergence and this can persist up here for months.
Safe trading
IREN Wont Quit! Fib extension Analogue targets..NASDAQ:IREN Has ran all the weekly pivot in an astonishing wave III. RSI is extremely overbought.
The next Fibonacci extension targets (analogue scale) are the 3.618 at $59 and the 4.236 at $68 for a wave 3 termination.
Fibonacci log targets are as high as $400 but this seems unrealistic so switched to analogue in this case! Stranger things have happened still...
Safe trading

BTDR Closed above the weekly pivot!NASDAQ:BTDR Wave (3) is underway and price has overcome the weekly pivot for now and bulls want to see this hold! The trend is up, the supports have been tested and the all time High Volume Node is the next target $25.
Fibonacci extension targets are minimum if $38 at the 1.618 with possibility to overextended bringing up the next target of the R5 weekly pivot at $76
RSI is not overbought and has plenty of room to grow, reaching the next leg often kicks in serious momentum!
Safe trading

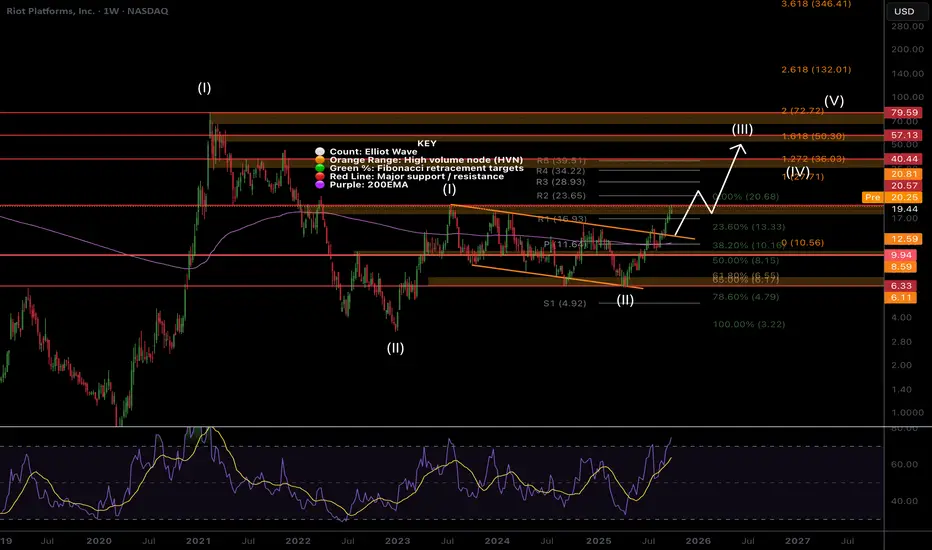
RIOT Macro, Higher for Longer!RIOT’s weekly RSI is overbought but can stay like this for many months as price continues upwards, just look at IREN!
Elliot wave (II) completed at the golden pocket. Price is finding minor consolidation at the wave (I) High Volume Node but is expected to break through with current price action and accelerate to $40, the High Volume Node and R5 weekly Pivot. Momentum is in control. Wave (III) has a minimum target of $50, per Fibonacci extension rules.
Safe trading
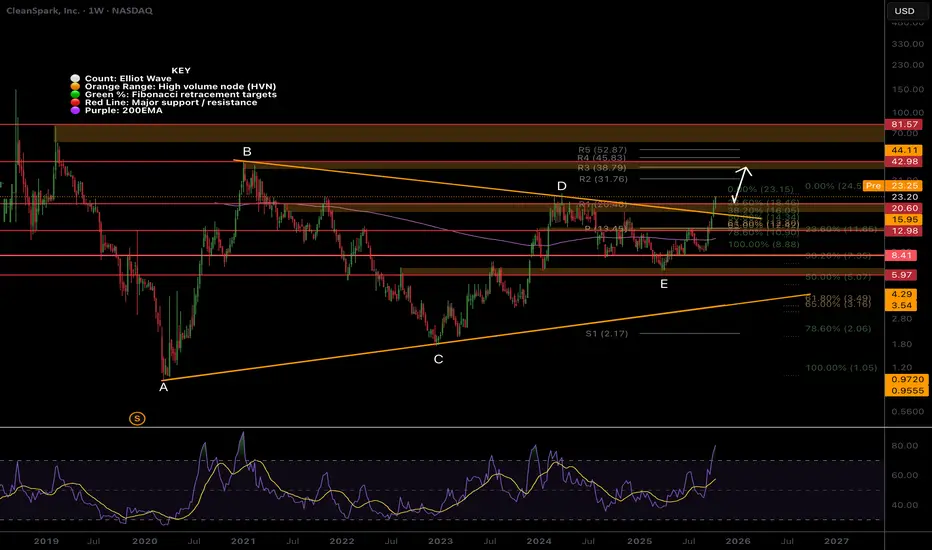
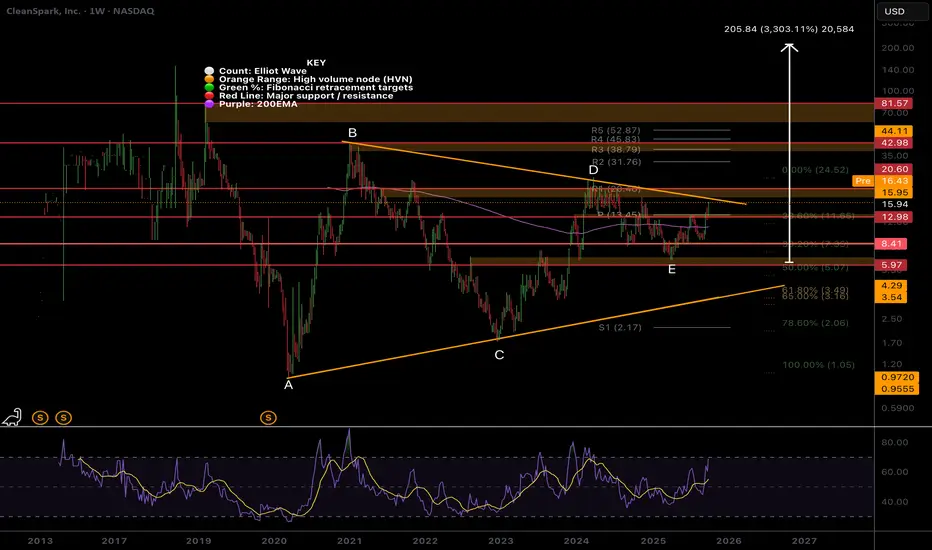
CLSK Testing Macro Triangle Upper Boundary!NASDAQ:CLSK Macro analysis shows a multi-year triangle has completed at the mid EQ, where price has the highest probability of completing wave E. CRYPTOCAP:XRP Did a x10 after this breakout and I am expecting similar move with CLSK.
Price should consolidate for a while in $16-$20 range as it works through wave D and trend-line resistance. Downside target is the weekly pivot at $13.45 which could offer a great buy!
All time high sits at $80, triangle pattern target is extremely high at $200 (triangle height measured from wave E bottom) but take this with a pinch of salt and keep your profit taking realistic! Crazier price moves have happened!
Weekly RSI is not yet oversold and price often gathers months of strong momentum when RSI gets to these levels reinforcing the analysis.
Safe trading
Reversal in progress?Is NESF starting to complete the Head phase of an inverse H&S pattern?
Still no end to the downtrend yet.
Probably need to wait another 12 months to see.
If the BOE further reduce interest rates, this will help its cost of capital.

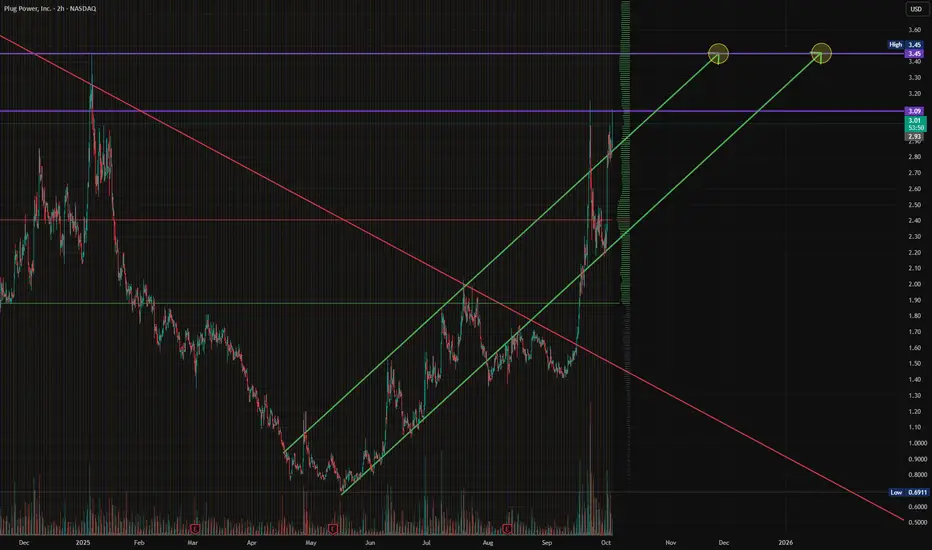
$PLUG - Plug Power, Inc - $3.45 RT & Breakout?NASDAQ:PLUG looks to have broken out of its longer-term downward channels, showing strong volume, support, and momentum while re-attempting to break the $3.09s and push forward to our $3.49 PT.
This also comes after HC Wainwright maintains a BUY on NASDAQ:PLUG , raising its Price Target to $7. Not to include, the company just delivered its first 10-MegaWatt GenEco Electrolyzer Array to Gilp, a Portuguese Energy Company.
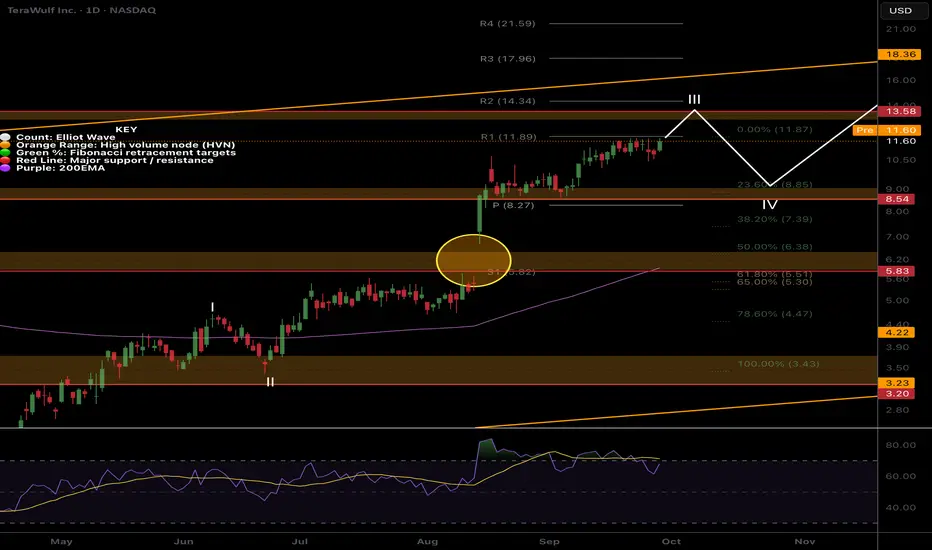
WULF Still in wave 3!NASDAQ:WULF continues to push onwards in wave 3 although gradually. The first target remains $13.48 High Volume Node followed by the macro channel upper boundary trend-line.
Support target is the daily Pivot and High Volume Node at at $8.27 and this is also the wave 4 expected Fibonacci retracement zone of 23.6-38.2.
Daily RSI does have bearish divergence from overbought so a retracement is likely.
Safe trading
IREN still in the bull-trend range!NASDAQ:IREN continues upwards in a tight bullish channel but how long can this extend? R5 pivot targets suggest $65.
Bearish divergence in overbought RSI keeps being negated for now.
Wave (4) downside target is currently the 38.2 Fibonacci retracement at $30.44 and this iwll extend higher as long as price does.
Safe trading

HUT downside still to come?NASDAQ:HUT has had a great rally finally being subdued by the macro channel upper boundary resistance sending price back to the High Volume Node support on overbought RSI.
RSI has reset to the EQ but has room to fall (or grow again). The next target is the High Volume Node resistance and R4 pivot at $44 with a terminal target of $65
If price loses the support node the next support target is the pivot and wave 1 high $24 and I would look out for a long here if we get it.
Safe trading

BTDR Bounces from previous swing high support!NASDAQ:BTDR found support at the at the wave 1 high and R1 pivot and looks poised to continue to the first take profit target and all time High Volume Node tat $25! Wave (3) of 3 appears to be underway so should continue to be powerful!
Analysis is invalidated if we drop below $13 and lose the High Volume Node support which sits at the Fibonacci golden from the wave (2) bottom.
RSI did not reach overbought so has room to grow.
Safe trading
