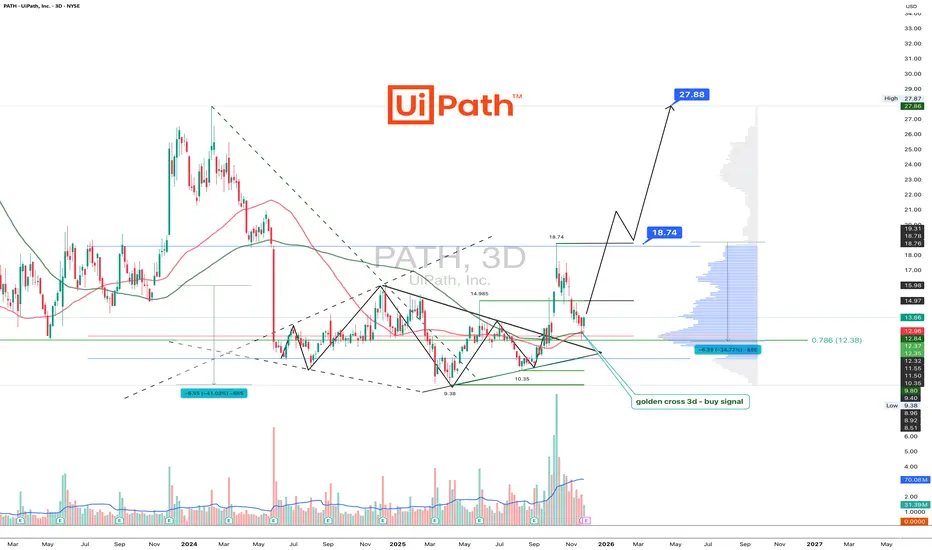
UiPath automates workflows and apparently the chart tooPATH pretends nothing happened after a perfect diamond breakout
PATH is trading at 13.86 after the diamond pattern completed a clean breakout toward 18.74 and shifted into a corrective phase. The pullback landed precisely in the Fibonacci 0.786 zone between 12.00 and 12.50 where a clear demand area formed. Buyers reacted sharply and the three day chart printed a golden cross through the MA50 crossing the MA100 which strengthens the bullish scenario.
As long as price holds above 12.00 the structure remains bullish. The next confirmation level sits at 14.97. A solid close above this zone opens the path back to 18.74 and later to the extended target at 27.88 where higher timeframe liquidity is located.
Fundamentally UiPath continues to show strength as of November 29 2025. Annual revenue exceeds 1.55 billion dollars which reflects a near 15 percent year over year increase. Gross margin stays near 83 percent indicating high operational efficiency. Cash reserves are above 1.7 billion dollars which keeps the balance sheet among the strongest in the automation sector. Customer growth remains steady across banking telecommunications and public sector clients. The transition to subscription based models continues to improve the predictability of cash flows. The main risk remains sensitivity of enterprise budgets in slow economic cycles.
The reaction to the 12.00 support confirms solid demand. Holding above this zone keeps the bullish scenario active with targets at 18.74 and 27.88. If buyers reclaim 14.97 the trend could accelerate quickly.
Automation removes friction from business processes and sometimes the chart removes friction for traders. Fibonacci and MA100 hint louder than words.
Priceactionanalysis
09.01.26 Daily ForecastPairs on Watch -
FX:GBPUSD
FX:AUDUSD
FX:EURCAD
A short overview of the instruments I am looking at for today, multi-timeframe analysis down to what I will be looking at for an entry. Enjoy!

Monthly Structure Tightening — Wave 5 LoadingDDT is forming a clean Elliott Wave contracting triangle as a Wave 4 consolidation. As long as Wave E pulls back without breaking the Wave C low, the structure remains valid and a continuation breakout becomes the higher‑probability path.
The simple triangle thrust target is marked on the chart, while the broader range target will depend on where Wave E completes.
Key areas of interest for a potential Wave E low include:
A rally from current levels that sees the January candle break and close above the Wave D high, signalling early strength and a possible premature completion of Wave E.
A continued pullback toward the ~$8.46 region, ideally accompanied by declining volume and narrowing candle spreads, which would align with classic Wave E behaviour inside a contracting triangle.
If the structure holds, the next move should be the Wave 5 breakout.

Deep Structure, Clean Risk, Big PotentialAVL is starting to look genuinely interesting here. Yes, it’s a small‑cap, highly speculative commodity play, but the structure developing on the chart is hard to ignore.
The current accumulation range shows multiple Phase B rallies, which deviates from the generic Wyckoff schematic most traders are familiar with. Those repeated bumps strongly suggest the Composite Operator was distributing into breakout enthusiasm, while retail money chased the early strength. Once that liquidity was absorbed, price unwound into a clean corrective leg.
That pullback from the May 23 high appears to have completed into the July 25 low, which is now acting as a potential Last Point of Support (LPS). LPS identification is rarely obvious in real time, but there are constructive signs here:
- the descending trendline has been broken
- demand is beginning to show up on the right side of the structure
- the reaction into the LPS held above the prior support shelf
From a technical perspective, this gives traders a valid long setup with risk defined beneath the LPS.
That said, there’s still a realistic scenario where price rejects this area and rotates lower toward the S1 yearly pivot, forming a deeper Spring. For that to unfold, we’d need to see a decisive move down followed by a monthly close back inside the range. If that happens, the following month’s open becomes the high‑probability entry and the risk‑to‑reward expands significantly.
This idea gains further weight when you look at the new yearly pivot structure. When price moves sideways between the yearly pivot and S1, it often tests the nearest pivot first. In this case, the yearly pivot, before driving into S1 and then launching back above the pivot zone. It’s a behaviour almost no one understands, yet AVL is following it cleanly, and it aligns perfectly with the potential Spring scenario.
There’s still plenty to play out, but whether the LPS holds or we get the deeper Spring, the chart is offering some attractive upside targets. These are large TPs, not guarantees — simply the major resistance zones that stand out on the chart.
In short:
LPS may already be in → early long with tight risk.
Spring still possible → deeper test into S1 before the real markup.
Pivot structure supports both paths, with the Spring offering the cleaner confirmation.
Either way, AVL is entering a part of the cycle where the chart finally matters again.
*Please note arrows are not time based just overall price path expected

XAUUSD – London Session Context (Pre-NFP) Jan 9
Asia Session
During Asia, price tested yesterday’s high near 4480 but failed to hold above it, resulting in a rejection back lower. This suggests supply is still active above yesterday’s highs.
London Session
Price is currently trading around 4470. With NFP scheduled later today, price behaviour around the 4480–4487 zone is key.
If this area continues to act as resistance, a pullback toward the 4457–4450 region ahead of NFP remains possible. This zone lines up as a prior area of interest where buyers may step back in before the news event.
Key Notes
• Bias remains conditional, not directional
• Acceptance above 4487 would invalidate the pullback idea
• Rejection keeps focus on a pre-NFP pullback
• Expect elevated volatility later - execution should follow confirmation, not anticipation
As always, patience > prediction. Let price confirm before committing risk.

BTC Side-waives for BUY BTC this move on side-waives ,its come a down side below FVG hit back to up-side at RED-Line target OR 2nd is current price goes up and re-test back to up side for a BUY Formation its a clear up side make, and normal volume is down-ward its price doesn't want move for sell side, its made a trip where i said price come down then Movie UP-side. now lets see

XAUUSD TO DROP TO 4300?Gold has been trading above 4k for the past few months before 2026, and still on a strong uptrend as it recently broke through a recent all time high, but currently the metal paired together with the USD is retracing backdown as we watch its movement. Is this a manipulative move or just a reversal downward as it broke an all-time high? From the fractal framework below, we see a recent pull to the upside which left a gap below, so I may guess the instrument is trying to fill its Gap then resume its move to the upside, but then we sit and watch.

08.01.26 Daily ForecastPairs on Watch -
FX:AUDUSD
FX:GBPUSD
FX:GBPCAD
FX:EURCAD
A short overview of the instruments I am looking at for today, multi-timeframe analysis down to what I will be looking at for an entry. Enjoy!

XAU/USD | Bearish When $4,425 Confluence Support Is Breached⚡Critical Confluence Level ($4,425)
⚡Key Support: The $4,425 level is currently a key focus as it represents the confluence point between the 100-hour SMA and the 38.2% Fibonacci Retracement of the recent price rally.
⚡Breakout Scenario: If the price closes decisively below this level, it is expected to trigger further technical selling, which could drag Gold down towards the psychological level of $4,400.
⚡Stability: Holding the price above the 38.2% level is crucial to stabilize the faltering market sentiment.

XAU/USD | Consolidation Towards Bullish Structure⚡Consolidation Zone (4436 - 4458): The price is currently "squeezed" in this area. This is a no-trade zone for conservative traders.
⚡Bearish Scenario (Healthy Correction): According to your plan, confirmation of a 1H Close below 4436 is crucial. The 4420 - 4407 area is a strong demand zone. If the price breaks through this level, we may see a liquidity grab towards 4378 - 4360 before the medium-term bullish trend resumes.
⚡Bullish Scenario (Trend Continuation): Stability above 4458 indicates that buyers are still dominant. However, the real confirmation is a 1H Close above 4475, which would pave the way towards the psychological level of 4500 and beyond.

USDCHF: when the safe haven loses its edgeUSDCHF remains attractive as global expectations around monetary policy shift. Markets are increasingly pricing a softer tone from the Fed later in the year, while demand for safe-haven assets like the Swiss franc continues to fade. Switzerland’s low inflation and limited growth outlook reduce CHF appeal, opening room for USD recovery, especially against low-yield currencies.
From a technical perspective, price has formed a base after a sharp decline. Higher lows indicate a developing bullish structure. Price is holding above short-term EMAs, and the former resistance zone has turned into support. The current area represents a retest aligned with structure and Fibonacci levels. Rising volume on advances versus pullbacks supports the bullish continuation scenario.
Trading plan: as long as price holds above the retest zone and confirmation appears, long positions are favored. The first target is a move toward recent highs, followed by Fibonacci extensions. A breakdown below support would invalidate the bullish setup and return price to consolidation.
When fear-driven currencies lose momentum, moves tend to accelerate.

USD/JPY | Medium-Term Uptrend PotentialThe price is currently trading at 156.47, attempting to break through the upper boundary of your zone at 156.71.
However, the recent weak US service sector (ISM) and job openings (JOLTS) data released tonight is putting pressure on the dollar, supporting your bearish scenario.
⚡ Execution Scenario
Bearish Confirmation (Primary Entry): As per your plan, wait for the 4-Hour (4H) candle to close below 155.74. This will confirm that sellers have taken full control.
- TP 1: 154.34
- TP 2: 153.18
⚡Final Target: 152.40 (strong liquidity area).
Correction Scenario (Caution): If the price rebounds and stabilizes above 156.71, this short-term bearish structure will be invalidated, and USD/JPY could retest the 158.00 level.

Birlasoft Holds Strong Momentum at Key SupportBirlasoft – Daily Timeframe Analysis
On the daily timeframe, Birlasoft is trading in a strong higher high–higher low (HH–HL) structure and is consistently respecting the Supertrend indicator.
As per Supertrend, the stock has a key support zone around ₹410–₹420.
If this support zone sustains, we may witness further upside based on price action.
The next potential upside target is placed near ₹500–₹510.
As long as the support remains valid, the overall trend in Birlasoft is expected to remain positive.
Thank you..

XAUUSD - London Update & Pre-News Context (Jan7)Asia Session
During Asia, price took out yesterday’s high, printed the Asia high around 4500, then sold off into 4443, which lined up closely with yesterday’s intraday low at 4442.6.
London Session
During London, price swept the Asia low and yesterday’s intraday low before pushing back up into the middle of the Asia range, currently trading around 4460–4465.
What to Watch
• The key London move was the sweep of the Asia low — now it’s about seeing how price behaves from here.
• With ADP later today, it would not be surprising to see price remain range-bound within the Asia range ahead of news.
• A retest toward 4472-4475 is a level to keep on the radar.
• This kind of behaviour often leads to consolidation ahead of high-impact news.
Patience > prediction.
Let price confirm.

07.01.26 Daily ForecastPairs on Watch -
FX:GBPJPY
FX:CADJPY
FX:EURNZD
A short overview of the instruments I am looking at for today, multi-timeframe analysis down to what I will be looking at for an entry. Enjoy!

Gold strong low level for BUYGold strong low level for BUY. Now at time price move on up-side if price closed up at 4456.801 then price goes more up side OR price Resistance that level and price sweep the liquated level then again price move its more chance hits the point A ,B and C.
lets see

BTC Quick Hits for Bullish Direction BTC Quick Hits for Bullish Direction they know our direction did you know there direction if not follow there self-talk.
=> BTC hits the liquated sweep here and trip the seller for a sell but its real direction is Bullish side again hits 2nd time FVG point hits or current price to BUY Side.
Now see lets what happened but our conformation is 100% Bullish side.
DISCLAIMER
This is made for educational and informational purposes only.
It is not financial, investment, or trading advice.
Trading involves risk, and past performance doesn't guarantee future results.
Always do your own research or consult a licensed financial advisor
before making any trading or investment decisions.
The creator is not responsible for any profit or loss from your actions.
We don't offer paid signals or account management services.
Beware of scammers using our name - we are not connected to them.

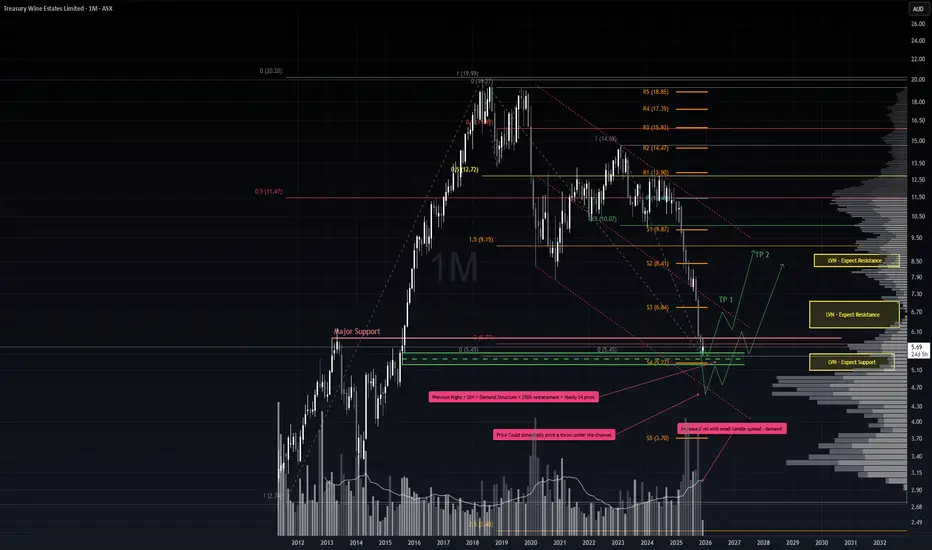
Relief Rally Incoming?It’s been a punishing stretch for TWE holders, but price action has now pulled back into a critical zone where a relief rally could emerge. The broader trend remains bearish, so any positioning here must respect that context.
Key Support Factors
1. 200% retracement from the 2018 double top.
2. Low Volume Node (LVN) zone, indicating limited price acceptance and potential for sharp moves.
3. Demand structure anchored by the August 2015 candle.
4. Historical tops acting as structural support.
5. November monthly candle showed notable demand — high volume on a narrow spread.
6. 11 consecutive weeks down in a single swing, aligning with Gann’s 7–10 bar exhaustion principle.
7. Proximity to the yearly S4 pivot, reinforcing the demand zone.
Trade Scenario 1 – Aggressive Entry
Setup: Despite no confirmed trend reversal, risk-tolerant traders could begin scaling in here, supported by the confluence of demand factors.
Stop Loss: 5.22 — just beneath the demand structure and S4 pivot.
Take Profit: Initial target at the midline (EQ) of the downward channel. If price breaks cleanly above, extend targets toward the upper bounds of the channel.
Trade Scenario 2 – Throw-Under Reversal
Setup: If the S4 pivot and demand structure fail, watch for a throw-under pattern whereby price dips below support but quickly reclaims the range.
Confirmation: A bullish hammer or doji on surging volume, ideally accompanied by negative sentiment, would strengthen the reversal case.
Take Profit: Similar roadmap to Scenario 1 — first target at the channel EQ, then potentially the upper boundary if momentum builds.
Summary
This is a high-risk, counter-trend play. The confluence of structural supports, exhaustion signals, and pivot proximity offers a tactical window for relief. However, discipline around stops and scaling is essential, as the long-term bear market backdrop remains intact.
* Note, price pathing is not time based, just the overall price movement
Gold price analysis on January 7thGold is currently moving according to the previously mentioned scenario, with the price clearly reacting at the psychological resistance zone around 4500. At the start of the Asian session, selling pressure began to appear, indicating that short-term profit-taking is being activated.
In the short term, this correction is likely to continue, with the price zone around 4400 acting as a potential area for the market to find further momentum before resuming the main uptrend in January.
At the current price level, short-term SELL setups can be considered as the price shows a clear reaction from the sellers. However, it should be noted that the main trend on the H4 timeframe still leans towards buying. If sufficient buying pressure emerges at support levels, a reversal to an uptrend is entirely possible.
📌 Reference Trading Scenario
SELL around 4470, stop loss above 4500
BUY, wait for a confirmation signal of buying pressure in the 4400 – 4440 range
⚠️ Risks to Note
If sellers gain a strong advantage and the price breaks below 4400, the short-term uptrend structure will weaken and the entire scenario needs to be re-evaluated.

Political instability Can gold rebound to the previous ATH?Political instability: Venezuela’s President Maduro arrested – Can gold rebound to the previous ATH?
1️⃣ Market Context
The overall structure remains bullish.
Price is undergoing a short-term correction after a strong volatile move.
The 4300 area is acting as a key support zone.
RSI shows buy–sell convergence; bulls are gradually absorbing bears, keeping downside pressure well controlled.
2️⃣ News & Fundamental Factors
Geopolitical tension: Venezuela attacked by the U.S., President arrested and transferred to the U.S.
Expectation of a gap and bullish move in gold in the upcoming session.
Current news flow continues to support a positive outlook for gold.
3️⃣ Main Scenario
Priority scenario: Price holds above 4300 and resumes the bullish structure.
Key intraday levels to watch:
Support: 4300–431X, 4270–4275
Resistance: 4370–4375, 4402–4404
Focus on shallow pullbacks in line with the main trend.
4️⃣ Trading Strategy (Intraday / Weekly)
Trend-following remains the core approach, while being prepared for minor pullbacks to avoid missing moves.
Closely monitor price reactions at:
4300: Nearest support, currently holding well.
437X: Potential intraday reaction zone.
Always wait for price action confirmation, avoid entries in the middle of the range.
5️⃣ Extensions & Notes
If 4300 breaks decisively:
Deeper correction toward 427X, 425X
Further extension to 417X, a zone worth watching for swing opportunities.
Volatility remains high → risk management is the top priority.
✨ Wishing everyone a profitable new week, green accounts as far as the eye can see

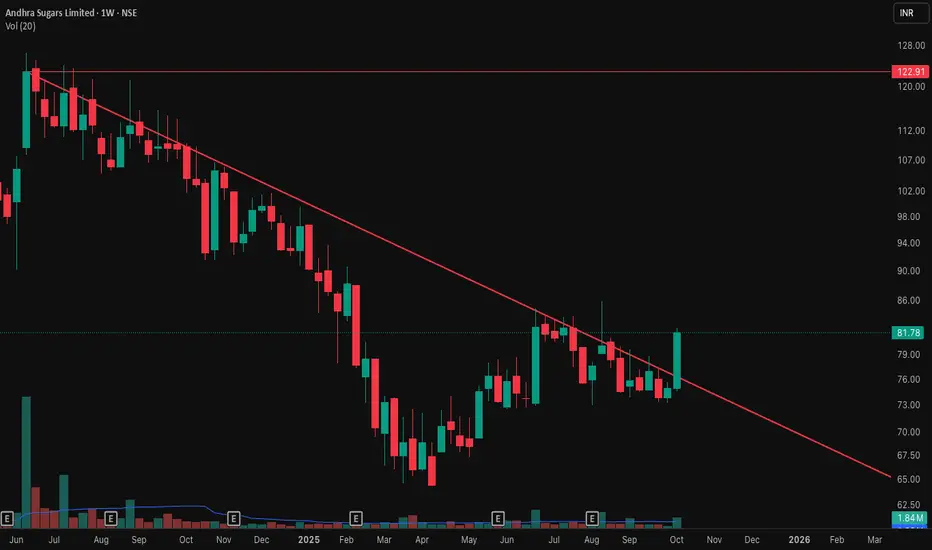
Andhra Sugars Ltd - Weekly Chart📊 Andhra Sugars Ltd – Trendline Breakout on Weekly Chart 🚀
📅 Chart Date: October 12, 2025 | Timeframe: Weekly
📈 CMP: ₹81.78 (+9.01%)
📍 Symbol: NSE:ANDHRSUGAR
🔍 Technical Analysis
📉 Downtrend Line Broken After Months of Consolidation
The stock had been trading under a strong falling trendline since mid-2024.
This week’s bullish candle successfully closed above the trendline, indicating a potential reversal from the long-term downtrend.
💥 Volume Confirmation
Noticeable rise in weekly volume (1.84M) compared to the recent average of 1.06M, showing buying interest emerging from the support zones.
🟡 Key Resistance Level: ₹122.91 (previous swing high from June 2024).\
A breakout and weekly close above ₹123 could confirm a major trend reversal and open up higher targets.
📌 Key Levels
Immediate Support (Breakout Retest Zone): ₹75–₹77
Resistance Zone: ₹122.91
Next Targets: ₹95 / ₹110 / ₹123
Stoploss (Weekly Close Basis): ₹70
⚠️ Disclaimer
This analysis is for educational and charting purposes only. Not financial advice. Please do your own research before making any investment decisions.
SEAMEC LTD - Weekly Falling Trendline Breakout📊 SEAMEC LTD – Weekly Falling Trendline Breakout Attempt 🚀
📅 Updated: Dec 03, 2025 | ⏱️ Timeframe: 1W
CMP: ₹987.85 (+2.81%)
Ticker: NSE:SEAMECLTD
🔍 Technical Overview
SEAMEC is showing strong bullish momentum on the weekly timeframe, attempting a breakout above a 1.5-year falling trendline drawn from 2024 highs.
A strong base formation is also visible:
🟦 Demand Zone (Support Block): ₹830–₹870
Price has respected this demand zone multiple times, creating a rounded accumulation base.
📈 Current Move:
Breakout candle touching the trendline
Higher lows forming since August 2025
Volume expansion on recent bullish candles indicating accumulation
A confirmed breakout above the falling trendline could mark the beginning of a fresh medium-term uptrend.
🎯 Chart Summary
SEAMEC is showing signs of reversing its prolonged downtrend.
Breakout confirmation above ₹1,030 may open the path toward:
🎯 Targets:
₹1,120 (supply zone)
₹1,210 (swing high)
A close above the trendline with volume would validate the reversal.
⚠️ Disclaimer
This analysis is for educational and chart-study purposes only. Not financial advice. Always do your own research before trading.

BTC Take OFF for a BUYNow at this time we are little late to take buy entry but we have still opperunity for BUY . Price Down at 93518.15 and we find a buy conformation in any 5,3 and 1M time ,other details I share in chart where price gone
