Price Action: Long Term, Mid Term, Short Term Trend Explained
In this article, I will teach you the basics of market trend analysis.
We will discuss Long Term, Mid Term and Short Term trends.
I will show you how to identify and apply them properly.
Please, note that we will execute the trend analysis strictly on a daily time frame.
For the trend identification, we will rely on classics price action analysis rules.
We will say that the trend is bullish if the price forms at least 2 consequent bullish impulses with a retracement leg between them, so that the price would set at least 2 higher highs and a higher low between them.
We will say that the trend is bearish if the price forms at least 2 consequent bearish impulses with a retracement leg between them, so that the price would set at least 2 lower lows and a lower high between them.
If none of these conditions are met, we will say that the market is consolidating .
Long Term Trend
Long term trend is based on the analysis of a price action over 1 year.
To identify a long-term trend, start by analyzing the price action over a period of one year from the current trading day.
Analyze highs and lows.
According to the rules, the long term trend on USDCAD is consolidation.
Mid-Term Trend
Mid-term trend is based on the analysis of a price action over the last 5 months.
To identify a mid-term trend, start by analyzing the price action over a period of 5 months from the current trading day.
Analyze highs and lows.
According to our rules, the mid term trend on the pair is bearish.
Short Term Trend
Short term trend is based on the analysis of a price action over the last 2 months.
To identify a short-term trend, start by analyzing the price action over a period of 2 months from the current trading day.
Analyze highs and lows.
According to our rules, the short term trend on the pair is bearish.
According to our trend analysis,
long term trend is a consolidation,
mid-term trend is bearish,
short term trend is bearish.
Combining these 3 trends, we can derive that the pair is trading
in a huge range . After the price reached a resistance of the range, the price started to trade both in a short term and midterm bearish trends.
We can anticipate a bearish continuation till the price reaches a support of a long term range.
That is how you execute a trend analysis with price action.
❤️Please, support my work with like, thank you!❤️
I am part of Trade Nation's Influencer program and receive a monthly fee for using their TradingView charts in my analysis.
Priceactionbasics

Best Price Action Chart Patterns by Accuracy Last Year
Last year I shared more than 1300 free signals and forecasts for Gold, Forex, Commodities and Indexes.
In my predictions, quite often I relied on classic price action patterns.
In this article, I will reveal the win rate of each pattern, the most accurate and the least accurate formations of last year.
Please, note that all the predictions and forecasts that I shared last year are available on TradingView and you can back test any of the setup that I identified last year by your own. Just choose a relevant tag on my TradingView page.
Also, some of the forecasts & signals were based on a combination of multiple patterns.
Here is the list of the patterns that I personally trade:
🔘 Double Top or Bottom with Equal Highs
The pattern is considered to be valid when the highs or lows of the pattern are equal.
The pattern gives a bearish/bullish signal when its neckline is broken.
🔘 Double Top or Bottom with Lower High/Higher Low or Cup & Handle
The pattern is considered to be valid when the second top/bottom of the patterns is lower/higher than the first one.
The pattern gives a bearish/bullish signal when its neckline is broken.
🔘 Head & Shoulders and Inverted Head and Shoulders
The pattern gives a bearish/bullish signal when its neckline is broken.
🔘 Horizontal Range
The pattern is the extension of a classic double top/bottom with at least 3 equal highs/lows.
The pattern gives a bearish/bullish signal when its neckline is broken.
🔘 Bullish/Bearish Flag
The pattern represents a rising/falling parallel channel.
It gives a bullish/bearish signal when its upper/lower boundary is broken.
🔘 Rising/Falling Wedge Pattern
The pattern represents a contracting rising/falling channel.
It gives a bullish/bearish signal when its upper/lower boundary is broken.
🔘 Rising/Falling Expanding Wedge
The pattern represents an expanding rising/falling channel.
It gives a bullish/bearish signal when its upper/lower boundary is broken.
🔘 Descending/Ascending Triangle
The pattern is the extension of a cup & handle pattern with at least 2 lower highs/lows.
The pattern gives a bearish/bullish signal when its neckline is broken.
Please, also note that all the patterns that I identified and traded were formed on key horizontal or vertical structures.
Remember that the accuracy of any pattern drops dramatically if it is formed beyond key levels.
I consider the pattern to be a winning one if after a neckline breakout, it managed to reach the closest horizontal or vertical structure, not invalidating the pattern's highs/lows.
For example, if the price violated the high of the cup and handle pattern after its neckline breakout, such a pattern is losing one.
If it reached the closest structure without violation of the high, it is a winning pattern.
🔍 Double Top or Bottom with Equal Highs
I spotted 85 setups featuring these patterns.
Their accuracy is 62% .
🥉 Double Top or Bottom with Lower High/Higher Low or Cup & Handle
96 setups were spotted.
The performance turned out to be a little bit higher than a classic double top/bottom with 65% of the setups hitting the target.
🔍 Head & Shoulders and Inverted Head and Shoulders
58 formations spotted last year.
Average win rate is 64%
🏆 Horizontal Range
The most accurate pattern of last year.
More than 148 patterns were spotted and 74% among them gave accurate signal.
🔍 Bullish/Bearish Flag
38 setups identified last year.
The accuracy of the pattern is 57%
Rising/Falling Wedge
The pattern turned out to be a little bit more accurate.
Among 62 formations, 59% end up being profitable.
👎 Rising/Falling Expanding Wedge
The worst pattern of last year.
I recognized 24 patterns and their accuracy was just 51%.
🥈 Descending/Ascending Triangle
64 patterns were identified.
The win rate of the pattern is 66%.
The most important conclusion that we can make analyzing the performance of these patterns is that they all have an accuracy above 50%. If you properly combine these patterns with some other technical or fundamental tools, the accuracy of the setup will increase dramatically.
Good luck in your trading!
❤️Please, support my work with like, thank you!❤️
I am part of Trade Nation's Influencer program and receive a monthly fee for using their TradingView charts in my analysis.
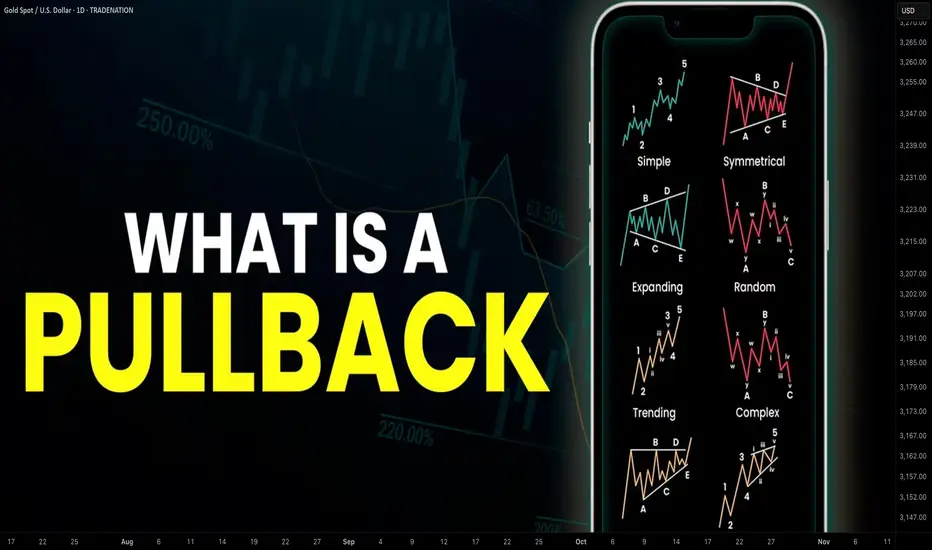
Learn What is PULLBACK and WHY It is Important For TRADING
In the today's post, we will discuss the essential element of price action trading - a pullback.
There are two types of a price action leg of a move: impulse leg and pullback.
Impulse leg is a strong bullish/bearish movement that determines the market sentiment and trend.
A pullback is the movement WITHIN the impulse.
The impulse leg has the level of its high and the level of its low.
If the impulse leg is bearish , a pullback initiates from its low and should complete strictly BELOW its high.
If the impulse leg is bullish , a pullback movement starts from its high and should end ABOVE its low.
Simply put, a pullback is a correctional movement within the impulse.
It occurs when the market becomes overbought/oversold after a strong movement in a bullish/bearish trend.
Here is the example of pullback on EURJPY pair.
The market is trading in a strong bullish trend. After a completion of each bullish impulse, the market retraces and completes the correctional movements strictly within the ranges of the impulses.
Here are 3 main reasons why pullbacks are important:
1. Trend confirmation
If the price keeps forming pullbacks after bullish impulses, it confirms that the market is in a bullish bearish trend.
While, a formation of pullbacks after bearish legs confirms that the market is trading in a downtrend.
Here is the example how bearish impulses and pullbacks confirm a healthy bearish trend on WTI Crude Oil.
2. Entry points
Pullbacks provide safe entry points for perfect trend-following opportunities.
Traders can look for pullbacks to key support/resistances, trend lines, moving averages or Fibonacci levels, etc. for shorting/buying the market.
Take a look how a simple rising trend line could be applied for trend-following trading on EURNZD.
3. Risk management
By waiting for a pullback, traders can get better reward to risk ratio for their trades as they can set tighter stop loss and bigger take profit.
Take a look at these 2 trades on Bitcoin. On the left, a trader took a trade immediately after a breakout, while on the right, one opened a trade on a pullback.
Patience gave a pullback trader much better reward to risk ratio with the same target and take profit level as a breakout trader.
Pullback is a temporary correction that often occurs after a significant movement. Remember that pullbacks do not guarantee the trend continuation and can easily turn into reversal moves. However, a combination of pullback and other technical tools and techniques can provide great trading opportunities.
❤️Please, support my work with like, thank you!❤️
I am part of Trade Nation's Influencer program and receive a monthly fee for using their TradingView charts in my analysis.
Learn What is Higher High, Higher Low, Lower Low, Lower High
In this educational article, we will discuss the foundation of price action analysis: the concepts of highs and lows.
In order to grasp that concept, you should learn to perceive the price chart as the sequence of zigzags .
Depending on the direction of the market and the shape of these zigzags, its peaks will be called differently. There are 6 types of them that you should learn to recognize.
1️⃣ Equal Highs (EH).
The peaks of bullish moves will be called equal highs, if they perfectly respect the same level (resistance), retracing from that and not managing to break above.
Above is the example of equal highs on Gold chart on a daily.
2️⃣ Equal Lows (EL).
The peaks of bearish moves will be called equal lows, if they perfectly respect the same level (support), bouncing from that and not managing to break below.
Find perfect equal lows on USDCAD on the chart above.
3️⃣ Higher High (HH).
The peak of a bullish move will be called Higher High, if the price manages to violate the previous high after a retracement.
Look at a perfect sequence of higher highs on NZDUSD.
4️⃣ Lower Low (LL).
The peak of a bearish move will be called Lower Low, if the price manages to violate the previous low after a pullback.
Trading in a strong bearish trend, NZDCAD keeps updating lower lows on a daily.
5️⃣ Higher Low (HL).
The peak of a bearish move will be called Higher Low if, after a retracement from the high, the price manages to set a low that is higher than the previous low.
Back to the example on NZDUSD. Not only the price updates the higher highs but also the higher lows.
6️⃣ Lower High (LH).
The peak of a bullish movement will be called Lower High if, after a pullback from the low, the price sets a high that is lower than the previous high.
That's how EURJPY acted on a daily, setting 2 nice lower highs.
Why these terms are so important?
Because, firstly, you can apply them to objectively identify the market trend.
Secondly, all the price action patterns are based on a combination of these highs and lows.
You should learn these terms by heart, and you should learn to perceive the price chart as the sequence of zigzags, with a strict designation of each peak.
❤️Please, support my work with like, thank you!❤️

Learn What is PULLBACK and WHY It is Important For TRADING
In the today's post, we will discuss the essential element of price action trading - a pullback.
There are two types of a price action leg of a move: impulse leg and pullback.
Impulse leg is a strong bullish/bearish movement that determines the market sentiment and trend.
While a pullback is the movement WITHIN the impulse.
The impulse leg has the level of its high and the level of its low.
If the impulse leg is bearish, a pullback initiates from its low and should complete strictly BELOW its high.
If the impulse leg is bullish, a pullback movement starts from its high and should end ABOVE its low.
Simply put, a pullback is a correctional movement within the impulse.
It occurs when the market becomes overbought/oversold after a strong movement in a bullish/bearish trend.
Here is the example of pullback on EURJPY pair.
The market is trading in a strong bullish trend. After a completion of each bullish impulse, the market retraces and completes the correctional movements strictly within the ranges of the impulses.
Here are 3 main reasons why pullbacks are important:
1. Trend confirmation
If the price keeps forming pullbacks after bullish impulses, it confirms that the market is in a bullish bearish trend.
While, a formation of pullbacks after bearish legs confirms that the market is trading in a downtrend.
Here is the example how bearish impulses and pullbacks confirm a healthy bearish trend on WTI Crude Oil.
2. Entry points
Pullbacks provide safe entry points for perfect trend-following opportunities.
Traders can look for pullbacks to key support/resistances, trend lines, moving averages or fibonacci levels, etc. for shorting/buying the market.
Take a look how a simple rising trend line could be applied for trend-following trading on EURNZD.
3. Risk management
By waiting for a pullback, traders can get better reward to risk ratio for their trades as they can set tighter stop loss and bigger take profit.
Take a look at these 2 trades on Bitcoin. On the left, a trader took a trade immediately after a breakout, while on the right, one opened a trade on a pullback.
Patience gave a pullback trader much better reward to risk ration with the same target and take profit level as a breakout trader.
Pullback is a temporary correction that often occurs after a significant movement. Remember that pullbacks do not guarantee the trend continuation and can easily turn into reversal moves. However, a combination of pullback and other technical tools and techniques can provide great trading opportunities.
Please, let me know if you have any questions! Also, please, support this post with like and comment! Thank you for reading!

Learn What is Impulse & Retracement Legs | Price Action Basics
Hey traders,
As you asked me, in this educational post we will discuss some price action basics.
No matter whether you are a fundamental trader or a technical trader you should be able to execute trend analysis.
You should always know where the market is going, if it is bullish or bearish.
One of the simplest ways to execute trend analysis is to perceive a price chart as a sequence of impulses and retracements.
➖ The impulse leg is a trend-following move.
It is characterized by heightened movement dynamics and speed.
Usually the completion point of the impulse:
sets a new lower low in a bearish trend,
sets a new higher high in a bullish trend.
➖ A retracement leg is a correctional movement within the trend.
Its’ initial point is the completion point of the impulse or retracement leg and
its completion point might be an intitial point of a new retracement leg or of a new impulse leg.
In the picture above, USDJPY is trading in a bullish trend.
Bullish moves are called the impulses and bearish moves are called the retracements because bearish movements complete within the ranges of the bullish impulses.
In the example above, AUDCHF is trading in a bearish trend. Bearish moves are called the impulses and bullish ones are called the retracements.
Usually, a retracement leg is characterized by a slow zig-zag movement.
Usually the completion point of the impulse leg:
sets a lower high in a bearish trend,
sets a higher low in a bullish trend.
Perceiving the price chart as the set of impulses, one can easily and objectively identify a global, mid-term and short-term market trend, price action trend-following, reversal and correctional patterns.
Hey traders, let me know what subject do you want to dive in in the next post?

Learn How to Spot & Trade Consolidation | Full Guide 📚
Learn how to identify consolidation.
Price action based rules.
Directional bias & trading strategy explained.
3 states of the market explained.
❤️Please, support this video with like and comment!❤️
