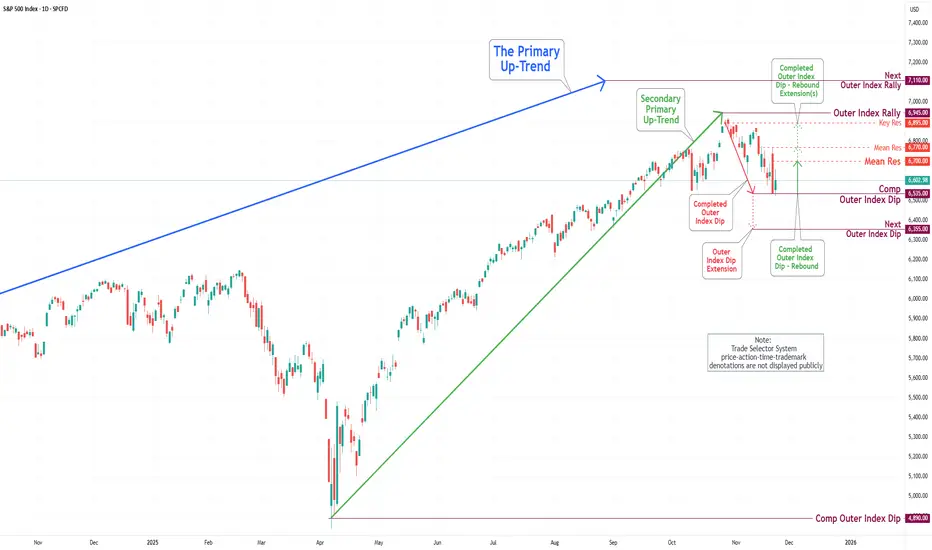
S&P 500 Daily Chart Analysis For Week of Dec 26, 2025Technical Analysis and Outlook:
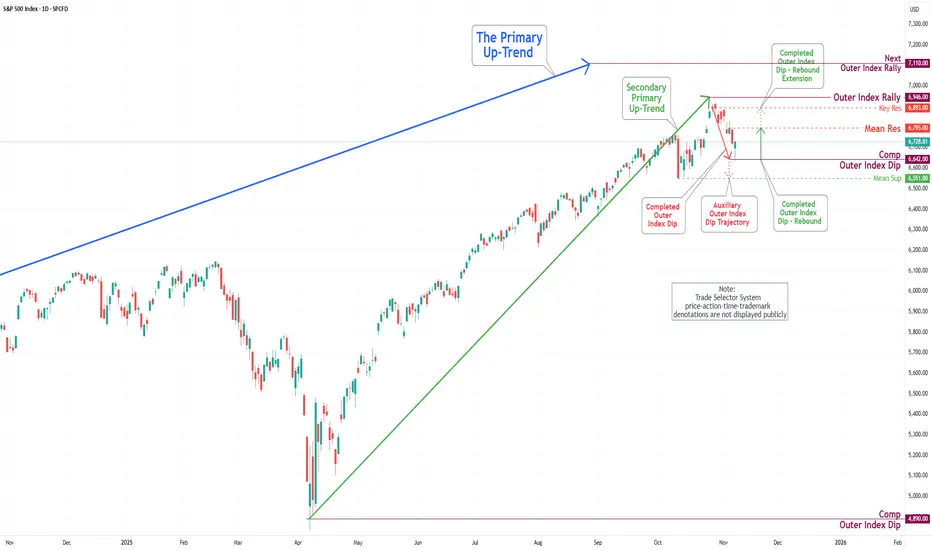
During this shortened holiday trading session, the S&P 500 Index achieved a significant milestone by completing the highly anticipated Outer Index Rally target of 6,945, surpassing the Key Resistance level of 6,905, which had been forecasted over a considerable period.
At this time, upon the above-mentioned target completion, the index market experienced an admirable pullback; the downside target is currently set at Mean Support 6.877.
It is, however, essential to acknowledge that, given the market's recent gains, there is a substantial likelihood that prices may exhibit an upward fluctuation near this completed target. Additionally, there remains the potential for further upward movement before the anticipated alignment with the projected downward trajectory.
Priceanalysis

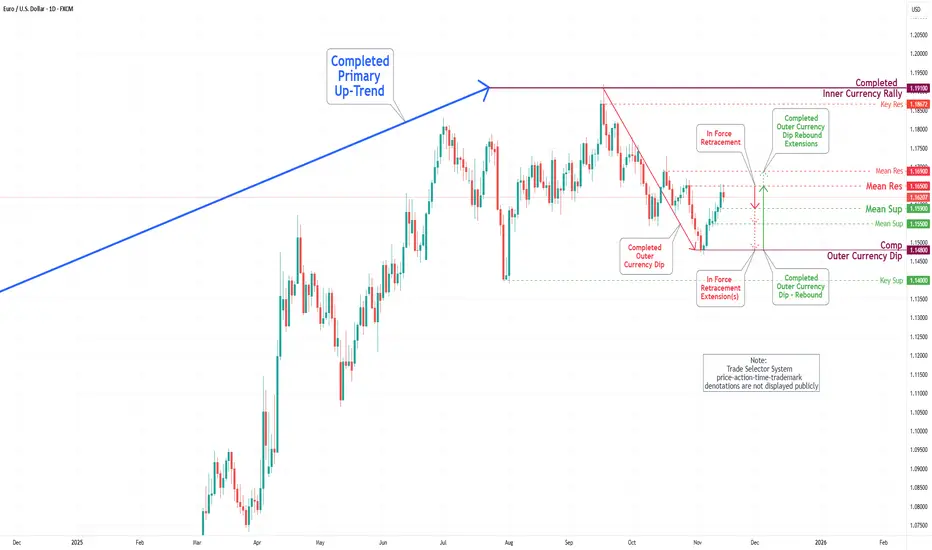
EUR/USD Daily Chart Analysis For Week of Dec 26, 2025Technical Analysis and Outlook:
In the trading session of this holiday week, the Euro market experienced an upward breakout, subsequently retesting the target of the Interim Inner Currency Rally at 1.180 and bypassing the Mean Resistance level at 1.175.
Following this retest, the euro experienced a rapid downward retreat, with the primary objective aiming at the Mean Support level at 1.175. It is important to note that this price point is the inverse of the preceding resistance level. At this juncture, we anticipate a substantial “dead cat” rebound from this support level, targeting a price objective at the Key Resistance level of 1.179.
Furthermore, some intermediate upward momentum may materialize within this downward trend before price levels realign with the anticipated trajectory.

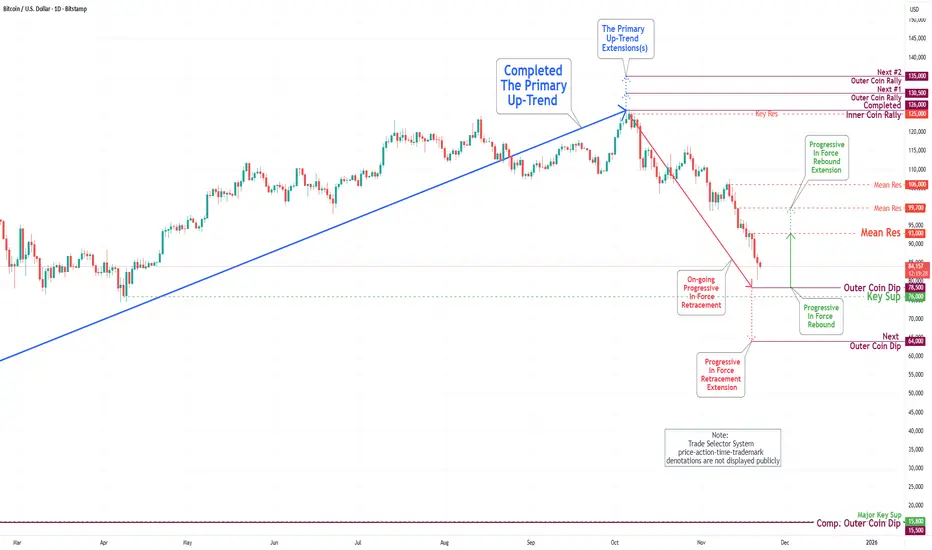
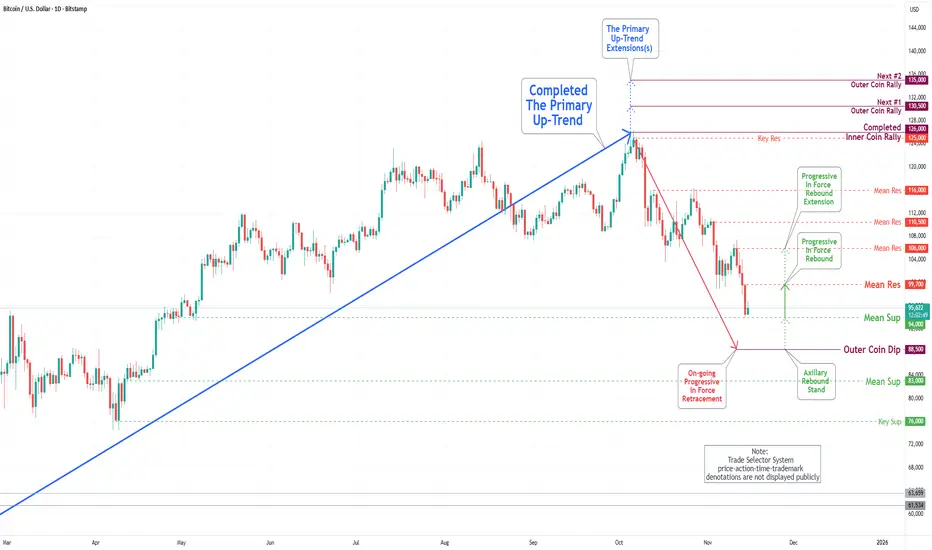
Bitcoin(BTC/USD) Daily Chart Analysis For Week of Dec 26, 2025Technical Analysis and Outlook:
The Bitcoin market has traded within a narrow range in the Active Inner Trading Zone during the current holiday season. This progressive zone is characterized by a Mean Resistance level of 90,500 and a Mean Support level of 84,500.
Given the prevailing dynamics in the cryptocurrency market, it is recommended that traders diligently monitor price movements in this Active Trading Zone. A breakout on the upside from this range may lead to vital targets, including an Interim Inner Coin Rally at 98,000, and a subsequent Interim Coin Rally at 102,500. However, it is important to acknowledge that these targets will encounter resistance at the Mean Resistance level of 93,500 before being attained.
On the downside, the principal target, identified for some time, is the Outer Coin Dip at 78,500. This target will be supported by significant backing from the Mean Support level of 82,500, which is situated below the Active Trading Zone’s Mean Support level of 84,500.

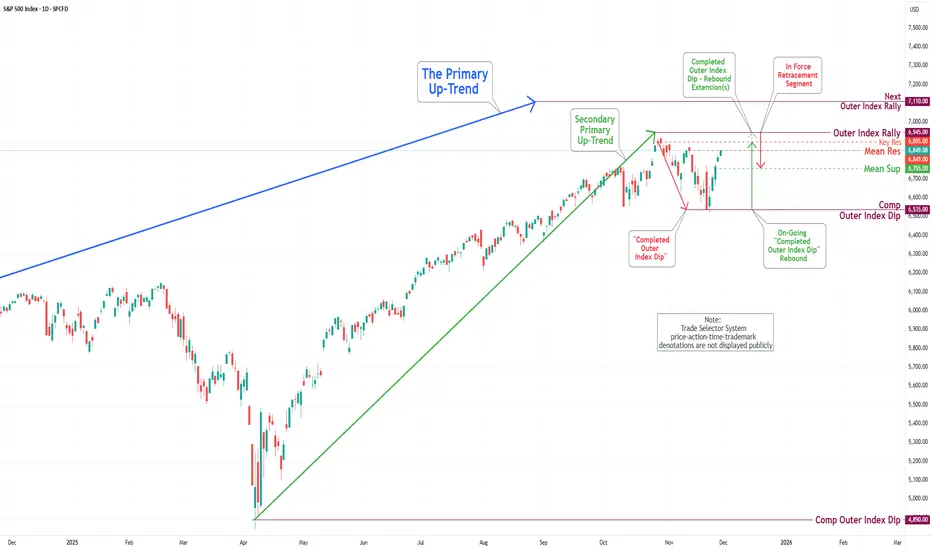
S&P 500 Daily Chart Analysis For Week of Dec 19, 2025Technical Analysis and Outlook:
In the most recent weekly trading session, the S&P 500 Index demonstrated significant downward movement followed by a notable recovery, bringing it closer to our primary target for the Outer Index Rally at 6,945.
At this time, the current market positioning indicates robust potential for continued upward momentum, with the principal objective being to reach the Key Resistance level of 6,905. This milestone is expected to contribute towards achieving the anticipated target of the Outer Index Rally at 6,945.
Nonetheless, it is essential to recognize that, given prevailing market dynamics, there is a considerable probability that prices will experience a pullback before realigning with the projected upward trajectory.

EUR/USD Daily Chart Analysis For Week of Dec 19, 2025Technical Analysis and Outlook:
In this week’s trading session, the Euro market experienced an upside breakout, reaching the Interim Inner Currency Rally target at 1.178, having crossed the Mean Resistance level at 1.175. With this completion, current market conditions demonstrate a downward trend, with the primary objective being the Mean Support level at 1.163.
On the upside, we anticipate a healthy dead-cat rebound from the Mean Support at 1.163, aiming for the price zone around 1.169. It’s important to note that some intermediate upward momentum may occur within this downward trend before prices realign with the expected trajectory.

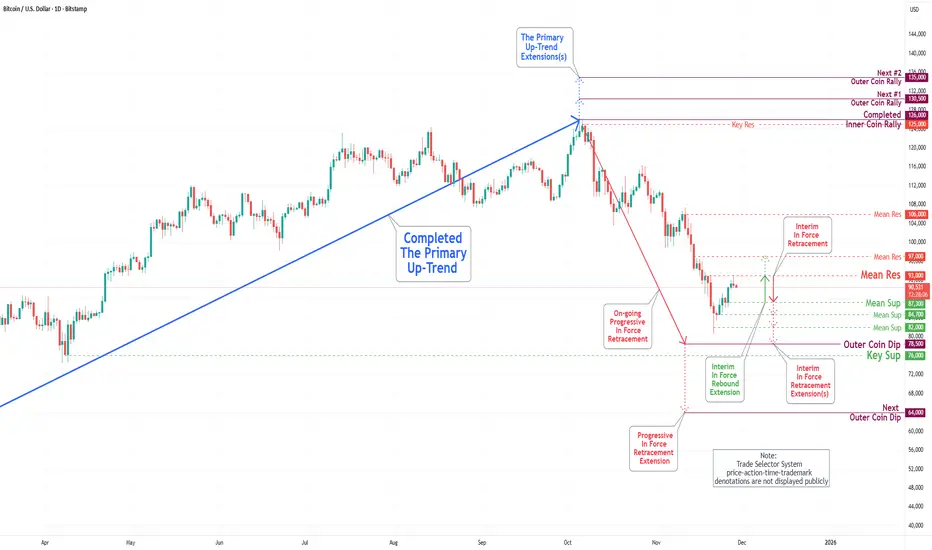
Bitcoin(BTC/USD) Daily Chart Analysis For Week of Dec 19, 2025Technical Analysis and Outlook:
The Bitcoin market in this week's trading session continued to trade within an Active Inner Trading Zone defined by the Mean Resistance level at 93,500 and the Mean Support level at 89,300.
Given the current dynamics of the cryptocurrency market, it is advisable for traders to monitor price action in this Active Trading Zone closely. A breakout may lead to additional targets, including an Interim Inner Coin Rally at 98,000 and a subsequent Interim Coin Rally at 102,500. Conversely, on the downside, the established Mean Support levels are situated at 84,700 and 82,500, with the prospect of an Outer Coin Dip occurring at 78,500.

S&P 500 Daily Chart Analysis For Week of Dec 12, 2025Technical Analysis and Outlook:
In the course of the recent weekly trading session, the S&P 500 Index exhibited significant gyrational volatility, reaching a Key Resistance level at 6,895 before retracting to the Major Mean Support level delineated at 6,816.
At present, this market positioning indicates strong potential for continued downward movement, with the primary objective focused on targeting the Mean Support level at 6,755 via heavily traded Mean Support at 6,816.
Nevertheless, it is crucial to recognize that, given current market dynamics, there is a substantial probability of a robust price surge to retest the critical Key Resistance at 6,900, which may be accompanied by a strong rebound to the Outer Index Rally target at 6,945.

EUR/USD Daily Chart Analysis For Week of Dec 12, 2025Technical Analysis and Outlook:
During the most recent trading session, the Eurodollar currency rose sharply, reaching the Mean Resistance level at 1.175, via the Mean Resistance level of 1.167. Current market conditions indicate that the price may pull back to the critical Mean Support level at 1.169.
However, it is also crucial to monitor the breakout level for this currency to the upside by a rise to the Interim Inner Currency Rally 1.178 via Mean Resistance 1.175.
Conversely, on the downside, a major re-ignited retracement may occur from the completed Interim Inner Currency Rally 1.178, with the possibility of extending to the Mean Support 1.163.

Bitcoin(BTC/USD) Daily Chart Analysis For Week of Dec 12, 2025Technical Analysis and Outlook:
During the most recent trading session, the Bitcoin market navigated within a channel defined by the Mean Resistance level at 93,500 and the Mean Support level at 89,300.
Current market sentiment suggests an upward move, with price action pointing to a retest of the Mean Resistance level at 93,500. Additional targets include the Interim Inner Coin Rally at 98,000 and a subsequent, significant objective: the next Interim Coin Rally at 102,500.
Given the prevailing dynamics of the cryptocurrency market, there exists a potential for an intermediate pullback to the Mean Support level of 89,300. This pullback could extend to further Mean Support levels at 86,400 and 82,400, ultimately culminating in the anticipated Outer Coin Dip at 78,500 before a notable upward momentum is expected to occur.

S&P 500 Daily Chart Analysis For Week of Dec 5, 2025Technical Analysis and Outlook:
In the recent weekly trading session, the S&P 500 Index recorded significant gains, achieving our primary target at the Key Resistance level of 6,895. Presently, this market position indicates potential downward movement, with the primary target set at Mean Support at 6,816, and the possibility of further decline to Mean Support at 6,755.
Nevertheless, it is essential to acknowledge that, in light of the current market dynamics, there exists a considerable probability of a repeat retracement from the Key Resistance at 6,895, accompanied by a robust bounce from Mean Support at 6,816.

EUR/USD Daily Chart Analysis For Week of Dec 5, 2025Technical Analysis and Outlook:
In the most recent trading session, the Eurodollar currency rose sharply, reaching the Mean Resistance level at 1.167. Current market conditions indicate that the price may pull back to the critical Mean Support level at 1.160.
It is also crucial to monitor the breakout levels for this currency. On the upside, there is potential for a rise to the Mean Resistance at 1.167 once again and possibly extending to 1.175. Conversely, on the downside, a breakout could take it to the Mean Support at 1.160, with the possibility of retesting the completed Outer Currency Dip at 1.148.

Bitcoin(BTC/USD) Daily Chart Analysis For Week of Dec 5, 2025Technical Analysis and Outlook:
In the most recent trading session, the Bitcoin market experienced a Pump-and-Dump scenario and continued the downward trend observed over the past week. The price has reached the Mean Resistance level of 93,500.
Market sentiment is declining, with current price action focusing on identifying the Mean Support level at 88,000. Additional support is identified at 84,500, with a further significant drop possible to the Outer Coin Dip at 78,500.
Given the current dynamics of the crypto market, there is potential for an intermediate rebound from the Mean Support level of 88,000 back up to the Mean Resistance level of 93,500. Furthermore, an external extension may target the Interm Inner Coin Rally at 98,000.

S&P 500 Daily Chart Analysis For Week of Nov 28, 2025Technical Analysis and Outlook:
In this abbreviated weekly trading session, influenced by a significant U.S. holiday and a cooling issue at the CyrusOne data centers at CME, the S&P 500 Index posted notable gains, reaching our primary target, the Mean Resistance at 6,849.
At present, this position suggests the potential for further upward movement, with primary targets established for a continuation of the robust trend toward Key Resistance at 6,895, followed by an extended target identified as the Outer Index Rally at 6,945.
Nevertheless, it is crucial to recognize that, given the prevailing market dynamics, there exists a considerable likelihood of an In-Force pullback from the aforementioned price targets.
EUR/USD Daily Chart Analysis For Week of Nov 28, 2025Technical Analysis and Outlook:
In the most recent trading session, the Eurodollar currency posted a significant upsurge, marked by substantial price movements that pushed it past the Mean Resistance levels at 1.155 and 1.159, respectively.
Current market analysis suggests that the price action is poised for a retest of the critical Mean Resistance at 1.163, with the possibility of extending towards the additional Mean Resistance at 1.169.
Moreover, it is essential to monitor the breakout thresholds for this currency, with particular attention to the Mean Resistance of 1.163 on the upside and the Mean Support at 1.151 on the downside. There is also a potential scenario in which the price action may retest the Outer Currency Dip at 1.148, with the likelihood of a further extension to the subsequent Outer Currency Dip at 1.139.

Bitcoin(BTC/USD) Daily Chart Analysis For Week of Nov 28, 2025Technical Analysis and Outlook:
During the most recent trading session, the Bitcoin market exhibited a resilient rebound, continuing a trend observed over the past week. The price has reached the Mean Resistance level of 93,000.
Market sentiment is in declining mode, and the price is likely to trend toward the Mean Support level at 87,300. Current trading activities are focused on identifying the next Outer Coin Dip, projected at 78,500, with additional obstacle support at the Mean Support levels of 84,700.
Given the prevailing trading dynamics, there is potential for an intermediate rebound from the Mean Support level of 87,300 to the Mean Resistance level of 93,000. Furthermore, an external extension may occur as the cryptocurrency market continues to fluctuate in line with current shaky market sentiment. Notably, it is essential to acknowledge the potential for a significant rebound once the Outer Coin Dip target of 88,500 is achieved.
S&P 500 Daily Chart Analysis For Week of Nov 21, 2025Technical Analysis and Outlook:
In the last trading session, the S&P 500 Index exhibited significant gyrations, implying a pump-and-dump scenario and highlighting the significance of our completed Outer Index Dip at 6,535.
At present, this position suggests the possibility of further upward movement, with the primary targets established at the Mean Resistance levels of 6,700 and possibly 6,770. Furthermore, there exists a well-defined extension towards the Key Resistance level of 6,895, with an ultimate target for the Outer Index Rally set at 6,945.
Nonetheless, it is imperative to acknowledge the risk of a potential drawdown in the forthcoming trading session. Such an event could result in prices retesting the completed Outer Index Rally at 6,535, as well as the expansion towards the next Outer Index Rally at 6,355.
EUR/USD Daily Chart Analysis For Week of Nov 21, 2025Technical Analysis and Outlook:
In the last trading session, the Eurodollar currency showed a notable decline, characterized by consequential price movement as it passed through the Mean Support at 1.159 and 1.155. However, there is an expectation of a potential rebound toward the target Mean Support level at 1.155.
Present market analysis suggests that the price action is poised for a retest of the critical target, the Outer Currency Dip at 1.148, with the case of an extension to the next Outer Currency Dip at 1.139. Furthermore, it is imperative to monitor the breakout thresholds for the currency, specifically focusing on these two essential levels: the Mean Resistance at 1.155 and the Outer Currency Dip at 1.148.

Bitcoin(BTC/USD) Daily Chart Analysis For Week of Nov 21, 2025Technical Analysis and Outlook:
In the last trading session, the Bitcoin market experienced a substantial drawdown, continuing a trend observed over the past week. The price has reached the Outer Coin Dip at 88,500. In light of these difficulties, the price has subsequently declined to the Mean Support level at 83,000, while trading activity is now focused on identifying the next Outer Coin Dip at 78,500. Notably, the price has remained below the upper boundary of the Mean Resistance at 93,000. Considering the current trading dynamics, a potential intermediate rebound towards this resistance level appears plausible. However, it is essential to recognize the possibility of a considerable rebound occurring once the Outer Coin Dip target of 88,500 is attained.
S&P 500 Daily Chart Analysis For Week of Nov 14, 2025Technical Analysis and Outlook:
The most recent trading session exhibited a significant decline in the S&P 500 Index, highlighting the significance of our Key Resistance target, marked as 6893, situated just below the Outer Index Rally 6,946. The index has now retested the Outer Index Dip at 6,642, and it tipped its hand that it wants to go higher. This current position indicates the potential for further upward movement, with the target established at the Mean Resistance level of 6,849 and a well-structured extension towards the Key Resistance level of 6,893, with an ultimate target for the Outer Index Rally set at 6,946.
Nevertheless, it is crucial to acknowledge the possibility of a drawdown in the forthcoming week's trading session, which could nibble at the Mean Support of 6,700, possibly resulting in a further decline to the "Do That to Me One More Time" Outer Index Dip at 6,642 before ultimately resuming an upward trajectory.
EUR/USD Daily Chart Analysis For Week of Nov 14, 2025Technical Analysis and Outlook:
In the most recent trading session, the Eurodollar market exhibited a notable rise, characterized by significant movements targeting key price levels, specifically Mean Resistance at 1.159 and 1.165. Initially, the prices experienced a gradual increase, followed by a sharp escalation, ultimately reaching the critical Mean Resistance level of 1.165, which currently serves as the trading point for the currency.
Current market analysis suggests a modest expectation of a potential further increase in prices toward the target Mean Support level at 1.169. Additionally, there is a cautious outlook that downward movement may result in a subsequent retest of the Outer Currency Dip at 1.148 in the near future. Moreover, it is essential to monitor the breakout thresholds for the currency, with particular emphasis on the two primary levels: Mean Resistance at 1.165 and Mean Support at 1.159.
Bitcoin(BTC/USD) Daily Chart Analysis For Week of Nov 14, 2025Technical Analysis and Outlook:
In the most recent trading session, the Bitcoin market has undergone a significant drawdown over the past week, reaching the Mean Support level of 99,000. Additionally, it has completed the Outer Coin Dip at 97,000. Compounding these challenges, the price has also declined to the Key Support level of 94,000, where trading activity is currently concentrated.
At this time, the price is being maintained within a trading range defined by the Mean Resistance at 99,700 and the Mean Support (Former Key Support) at 94,000, with a slight probability of an extension to the Mean Support level at 106,000. Nonetheless, it is crucial to acknowledge the considerable potential for pullbacks at these critical resistance levels.
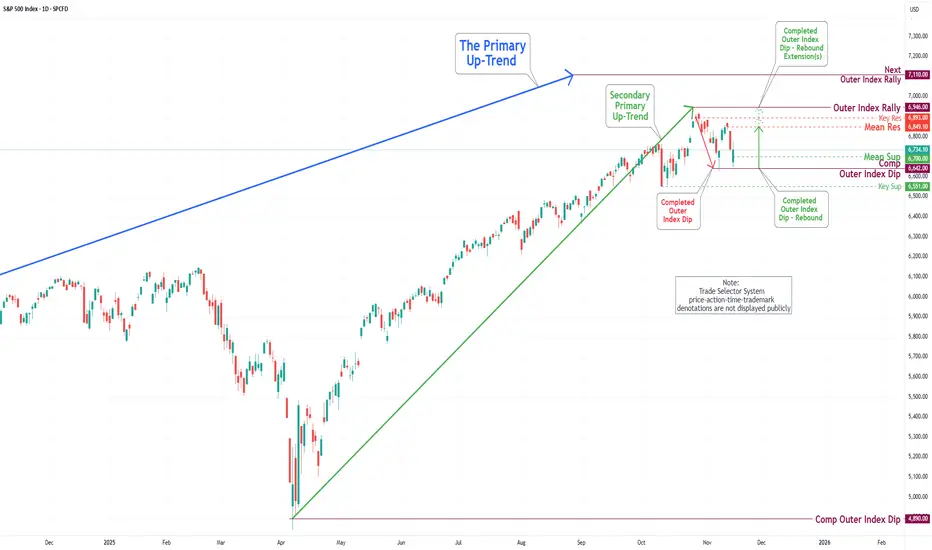
S&P 500 Daily Chart Analysis For Week of Nov 7, 2025Technical Analysis and Outlook:
During the recent trading session, the S&P 500 Index experienced a notable decline, underscoring the significance of our key target, situated at the Mean Support level of 6,740. The index has now completed the Outer Index Dip at 6,642. This positioning indicates the potential for further upward movement, with the target established at the Mean Resistance level of 6,795. The prevailing trend suggests a well-structured extension towards the Key Resistance level of 6,893, with an ultimate target for the Outer Index Rally set at 7,110.
Nevertheless, it is crucial to acknowledge the possibility of a substantial drawdown in the forthcoming week’s trading session. This may lead to a retest of the Outer Index Dip at 6,642, possibly resulting in a further decline to the Mean Support level at 6,551 before ultimately resuming an upward trajectory.
EUR/USD Daily Chart Analysis For Week of Nov 7, 2025Technical Analysis and Outlook:
During the most recent trading session, the Eurodollar market demonstrated considerable volatility, characterized by both significant downward and upward movements. The initial decline caused prices to decrease sharply, reaching and passing the Inner Currency Dip at 1.151, subsequently followed by a vigorous rebound that resulted in a retest of the Mean Resistance level at 1.159.
Current market analysis suggests that the prevailing sentiment is inclined toward a downward trajectory, with prices likely to target the Mean Support level at 1.153. There is a watchful expectation that this movement may lead to a subsequent retest of the Outer Currency Dip at 1.148. Furthermore, it is imperative to monitor the breakout thresholds for the currency, focusing on the two principal handles: Mean Resistance at 1.159 and Mean Support at 1.153.
