🔥✅HOW TO GET 70% WIN RATE USING VOLUME PROFILE🔥 Hi friends! Today we will talk about a very important trading tool that can give you 70% win rate if you will know how to use it as a pro trader. This tool is a volume profile.
📊 WHAT IS THE VOLUME PROFILE?
The volume profile is a real traded volume. Unlike the usual vertical volumes that show the amount of volume traded over a certain amount of time, the horizontal volume shows the volume traded over a certain price range.
The volume profile has 2 components:
🔥 value area (yellow areas), which is the biggest resistance/support for the price. There can be several value areas, but the largest value areas called HVN or High Volume Nodes.
🔥 liquidity gap (white area) is the area where the least volume is traded. Usually, the price "cuts" through these areas very quickly.
📊 HOW TO USE THE VOLUME PROFILE?
I want to show you how it works. If we want to understand the next price movement, we should identify the biggest value areas. So you see the most significant liquidity (value) areas and wait when the price tests it:
1. if the price breaks the value area and tests it as support , you can enter a trade because bulls are strong and the price should go higher.
🚩 The clear trade example on how to use HVN (value area) as support (+20% of clear move).
2. if the price test it as resistance , this means that bears are stronger and bulls haven`t enough power to push the price higher.
🚩 The clear trade example on how to use HVN (value area) as resistance (+26% of clear move).
So the value areas or HVN are a stop on the way of price movement in one direction or another. The better you determine where the price will go after testing this HVN (value area), the more profitable you will be.
🚩 If you use this approach on lower timeframes, you can get more trades. This is ideal if you are an intraday or swing trader.
Try using horizontal volumes yourself, and in the following ideas, I will tell you how I and other advanced traders use them.
✅ So this approach has 50-70% win rate, but if you want to increase it, you need to use additional filters.
Personally, I use the DOM and Footprint to identify the whales' orders and buy crypto with the big guys. These indicators can easily add 25-35% to your win rate. I make a lot of video lessons and articles about them, so enjoy and make money.
💻Friends, press the "boost"🚀 button, write comments and share with your friends - it will be the best THANK YOU.
P.S. Personally, I open an entry if the price shows it according to my strategy.
Always do your analysis before making a trade.
Profile

MMSMMarket Maker Sell Model/Smart Money Reversal
-great profile for sells
-low risk sells after smart money reversal (usually after a raid on buy-side liquidity
-target previous range of consolidation
-hindsight 20/20 but, learn to read these patterns to capitalize in real-time
-dxy increase = spx decrease

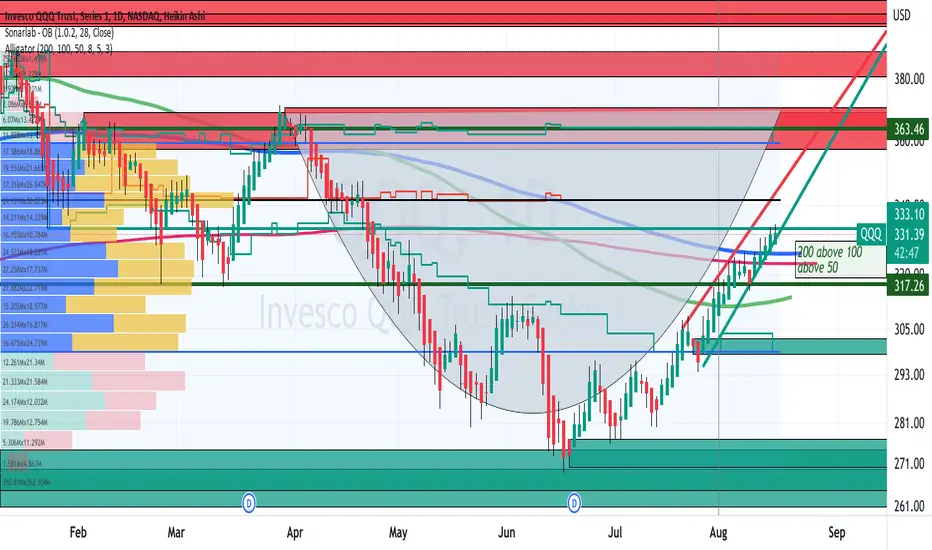
QQQ Uptrend BULL biasFrom the Daily Chart, QQQ is now in an uptrend above
the support of the daily SMA 50, 100, and 200 in somewhat of an ascending wedge pattern.
Distant support is the buy order zone while distant resistance is the
sell order zone above. Immediate ( and breakable ) resistance is
the POC of the volume profile.
I conclude that QQQ is in a sustained up-trend that could be entered
using a stop loss set just below the SMA 200 on the chart in blue.
What is your opinion? NASDAQ:QQQ Please comment.
Short Entry Setup on SPY @ POC resistanceThe Volume profile for the SPY is painting a picture of near-term resistance for SPY and using the breakdown of the august trendline as entry criteria.

S&P Volume ProfileShows LVN's, HVN's, and the POC. I pair volume profile with supply and demand and auction market theory to day trade. This larger time frame profile helps me align with the intraday profile. CME_MINI:ES1!

NQ 7/8 Daily Plan*NOT FINANCIAL ADVICE*
Bullish Scenarios:
Longs above 12073 Targeting 12170
Longs above 12170 Targeting 12235
Longs above 12235 Targeting 12284
Longs Above 12284 targeting 12333
Bearish Scenarios:
Shorts below 12024 Targeting 11980
Shorts Below 11980 Targeting 11873
Shorts Below 11873 Targeting 11833
Shorts below 11770 Targeting 11710

btc for sell now on 30 min as we see on vp and the RSI the BTC just create a big green candle but as we see that green candle have a big mech on the top bigger than the 70% of the body so we have a big sell power coming and wen he close a lees 1 red candle below the power control lign we will be on the black hole or the rejected zone so he must goo above 29935
sorry for my bad language please feel great to tell me your idea

QQQ After market observations May 31st1. Overnight inventory was in balance as compared to Friday close - a bit lower but mostly in balance.
2. Price went down in first half hour and stalled at Friday value area low - Went up from there.
3. It was a very rotational and a very choppy day but there are no serious selling. Overall volume was very low.
4. POC was 7 bar wide (>50%)
5. Value area was higher than Friday and entire last week.
Overall, insignificantly positive day.
Long term critical levels:
Weekly high/low: 309/282
Monthly high/low: 330/280
Recent high/low - 280 / 330, 372
Critical VWAP levels: Blue VWAP lines on the chart
Critical Fibb levels: 350, 330, 315, 285, 260, 200

BTC $25K CapitulationUpdate on my previous prediction for BTC capitulation.
Usually that's a bounce off the 200SMA, but rather than just relying on lagging indicators heres some additional confluence towards that...
Looking at 2018 on the left, we can see that the December 2018 capitulation dipped to the 200SMA (yellow line), and also the first point of untested support on the volume profile (left green histogram and black arrow). Interestingly, that amounts to a 159% increase from the red volume profile "point of control" line to the bottom of the capitulation.
If we apply the same setup to 2022 on the right, we can see that the same capitulation setup could play out - $25K as the bottom would line up to the 200SMA, but also the first point of untested support on the volume profile as well as a 159% increase from the red point of control line.
Every cycle is different, but lets see what plays out. Will capitulation even happen?

BTC 2022 Bottom?Whilst my previous prediction did pick out $25K as the number for a bounce, and we saw a quick move back above $30K for some easy 30%+ gains on many ALTs, I failed to predict how a falling NASDAQ would impact BTC.
Based on this, and the power law corridor turning red, we are officially in 2018 bear repeat territory.
I've draw 2 zones as possible bottoms... the green box would be the ideal scenario - a short term dip between $15-$20K followed by a slow climb back up in 2023 whilst the market settles before the next bull run.
Red would be absolute capitulation. A full 80% drop as seen in 2018, back to the point of control in the volume profile, and hitting around $10K or just below.
Let's hope the market instead settles here and moves slowly up or sideways... but personally I'm keeping a large cash position until later in the year.

HOW THE MARKET SHOULD MOVE RELATIVE VALUE AREASThis is how the market should move related to tpo value areaas learned in smb capital course because when price imbalances it goes to next zone where it can retest the edges and react from pocs

SOLANA Possible head and shouldersHello 👋
Possible head and shoulders forming on the daily chart. keep an eye out.

SOLANA TRADES Upcoming Potential trades for Solana and levels to watch...once price approaches these levels we watch for bullish moves + momentum

perfect atom short .50 fib rejection failure to cross above last swing high. were running out of volume dont be greedy bulls its up massive amounts in the past 24 hours. we will see a pretty decent size pull back. losing liquidity at the current price.

BTC Session TemplateMade some adjustments to some BTC session templates I've seen. This one has VPSV and updated session boxes as well as pivots and previous day/week/month values. Would love to know what people think.

LRC/USD 26/01/21 - Key Decision ZoneDuring the initial LRC pump, theres was a rotation area where strong buyers added to their longs, and the price continued to drive upwards from that zone - see left hand most volume profile.
This zone should have acted as an area of strong support as price settled down from the ATH, however instead price dived through this zone to a lower level.
This support should theoretically become new resistance, as it is where strong sellers added to their short positions - see right most volume profile.
There has now been a pullback, providing an opportunity for a good position long or short depending on the reaction to this key zone.

Analysis of BTCUSD levels of interest; suggested price Vmax zoneBulls will need to see this volume bar at continue to increase in magnitude. Failure to further develop the volume at the current spot price likely suggests pullback potential; pullback potential is limited, perhaps, to the next lowest volume profile peak circa ~56,965 USD. Notice, the 54,391.69 to 49,244.89 has notably low development on the volume profile; this low magnitude suggests that in the event of a pullback, price action will move with high velocity through this area. Peak velocity of price movement is expected to hit a Vmax at 52,630.94. However, this is better considered a price level of high importance, as it could easily also become a new support level, where buyers seek to buy BTC at a "discount," or, in stark contrast, breakdown into this level could potentially lead to a drawdown/correction - only time can tell. No recommendations. Not trade advice.

EurAud Short Setup2 bullish candles is retracement only! It will goes back down, 60% retracement since it goes down! I hope you enjoy and trade it! Give a like!

The Next Buy the Dip Moment ComingThe market has settled into a persistent pattern, making consistent new ATHs. Here's my prediction for the next All Time High.

BTC - Slope of Hope :)BTC - Slope of Hope :) - still in a minor trading range as indicated by the white lines. My prediction is that once it closes above the VAH around 57k - it will enter a new parabolic phase to discover a higher trading range.

BTC Analysis 28.07.2021 (part one)Part 2 is next.
1) HTF
2) Volume profile
3) Channels
4) Fibo (/ EW)

Market profile vs bars - HPQWouldn't it be cool to have the option of market profile charting here at TV?
HPQ shows a very interesting daily bar, stopping the big decline it has shown for some time.
In the coming days I'll determine the directional bias in the comments, for now this chart remains neutral.

RLong
