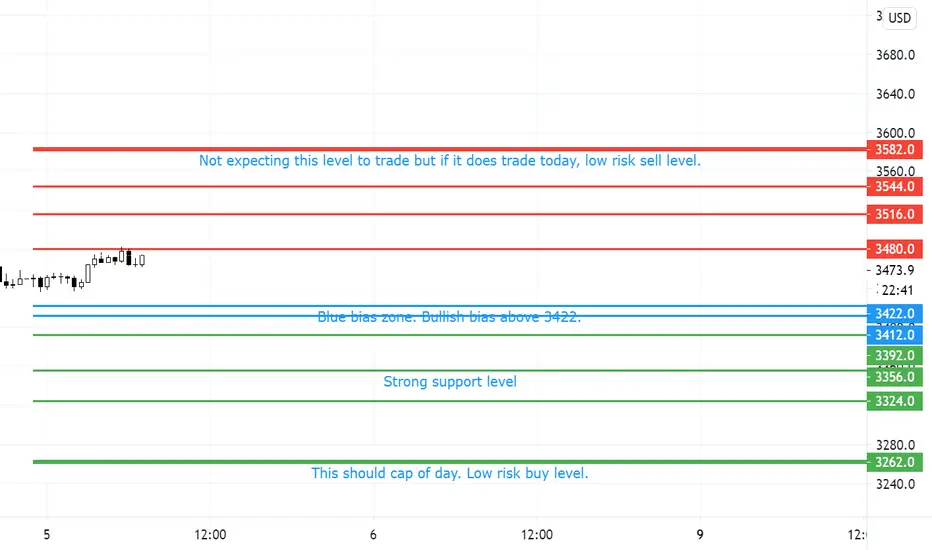
09/11/2020 #EURUSD Looking for a pullback day.Price is over-extended and based on price action, does look like due for a pullback. If we do hit 1.1910, look for possible rejection for a short - pullback
Upside is probably limited to 1.1910, 1.1946 and 1.196. Below 1.1852, look for shorts towards 1.1814-20, 1.1802, 1.1768-86 and 1.1756. 1.17220 will cap lows of day.
Lots of support below also so need to be nimble with shorts.
Profitabletrading

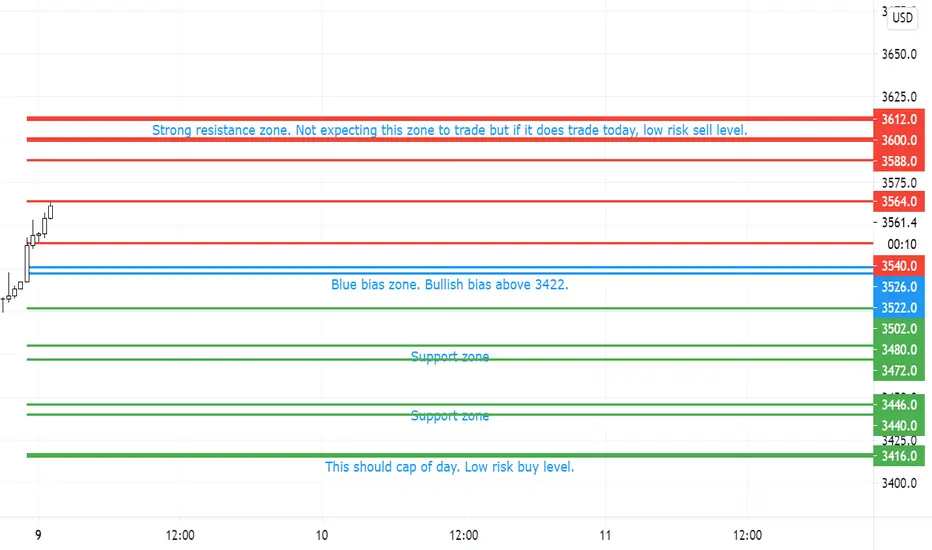
09/11/2020 #ES_F #SPX Trade what you see not what you thinkSimilarly to NDX, price gap up and is going higher. Pullback will come and difficult to short a strong market.
Initial resistance at 3540 breached and now at next R 3564. If fail, look for re-test of 3540 for a bounce. If it holds, we are looking at ATH and higher.
If 3422 breaks, look for shorts to 3502, 3472-80, 3440-47. 3416 is a low support which will cap low of day.
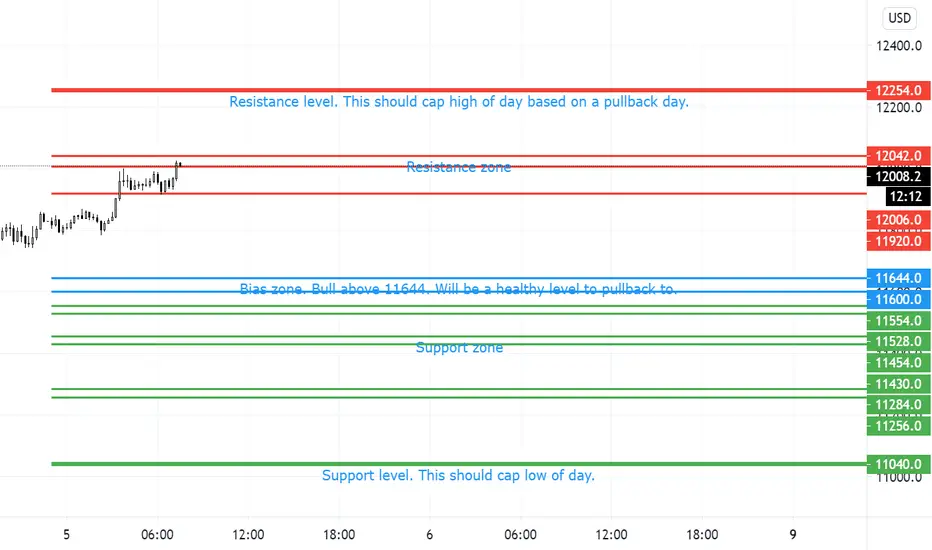
09/11/2020 #NDX #NQ_F Up and up. Till it stopsMarket opened gap up on Biden's win, though the win is probably expected since last week.
Price is going higher on momentum.
Overextended but it is difficult to call tops and you need skill to short such a market.
Price is above 1st resistance at 12270. We should get a pullback before going higher, targets above are 12428, 12502. In the event of FOMO buying, 12742 should cap high of day.
If 12158 breaks, look for shorts, targetting 12034, 11922-48 and 11858.11800 will safely cap lows of day

Proving Your Trading System with BacktestingWouldn’t it be great to see the future? To see where turning points in price will occur with a high degree of accuracy? To see if a trading system that you developed or bought or learned actually works? Well, you can, with a method called BACKTESTING.
Backtesting performs three important functions:
1: It helps you IDENTIFY the reliability / win rate of your trading system over time.
2: It helps develop and reinforce the muscle memory you need to EXECUTE opportunities in your trading strategy
3: It helps you continually REFINE / improve your strategy as you observe it work against price action, ultimately increasing your "hit rate" as a professional trader.
The first requirement of a trading system is that it works via RULES. There are no 'hunches' in the market... the market has *specific* behavior patterns and our job as traders is to recognize those patterns and *capitalize* on them.
Backtesting has three important requirements:
The first requirement is that your trading platform supports backtesting. Can you go back "x" amount of time and look at the timeframe(s) you need to make the decisions you would have made if you were "in the moment" in an efficient manner in order for you to simulate hundreds of trade setups?
The second requirement is that *you* are willing to put the energy and work into testing your trading system within an inch of its life before you risk a single penny of your trading capital. You need to know WHEN the system works, WHERE the system fails, and WHY the system worked and failed when it did, and that takes hundreds (if not thousands!) of simulated trades to do so.
As you are observing the system in action you will begin to "see" the patterns in a new light. It will become more and more intuitive and you will find opportunities to 'tweak' the system as you go along. You will identify patterns when trades fail and stop trading that pattern. You will see opportunities that got away and you can 'tweak' your system to take advantage of those opportunities. Most importantly, you will see whether the system even works reliably at all and ditch it if it doesn't. It may be frustrating to decide to do so, but the good news is you will not have lost a single penny trading a faulty system to begin with!
TRACKING YOUR TRADING SYSTEM
To track the accuracy of your trading system you will need to setup a spreadsheet that will record the important variables you want to track. For example, you may want to include the headers,
Asset / Date / Time In / Time Out / Long or Short / Reward to Risk Ratio / Gain or Loss / Account Balance
The "Reward to Risk Ratio" column is the most important. If you read my previous column, "Trade Like a Pirate" ...
... I discuss that you need to think in terms of Percent Risk per trade ("R") and not Dollars. This will show you how well your strategy works. For Example, if after tracking 100 trades you find out that your system has a 33% success rate, your account will grow by 1% for every three trades if you follow a minimum 3:1 Reward to Risk Ratio (3 -1 -1 = +1). If you find on average 6 trades per day, your account can potentially grow by 2% per day. Under the "Account Balance" column, if you add the trade's win/loss to your previous account balance you can determine how long it would take to get 'x' amount of money from where you started (or how long it will take and inferior system to lose it all as well!)
Testing your trading system also shows you how many opportunities present themselves per day / per hour and when the best time is to go 'fishing' for trades. Backtesting might tell you that you need to wake up 2 hours earlier (and go to bed 2 hours earlier) if you want to achieve the goal of replacing your car in 6 months. Or fire your boss in 24 months. Or pay off the mortgage in 3 years. Having a plan to *make* money should also include your plans on how and when you want to *spend* that money - how you will 'pay yourself'.
Socrates famously said “The unexamined life is not worth living.” Likewise the unexamined trading system is not worth putting your hard earned money into. The more you backtest your system, the more you will gain (or lose) confidence in the system which will ultimately determine the actions you will take.
Another happy by-product is that not only will you be able to refine your trading system, but you yourself will be continually refined in the fire of the market, exercising your mental muscles looking for opportunities that meet your particular trading system. For instance, by analyzing all my losing trades in my first batch of 100, I was able to identity a pattern in the formations common to all failing trades but not winning trades. I then modified my trading system to exclude trades which showed that pattern, increasing my success rate by 30% in the next 100 trades I tested with the new system. Not happy with that, I went through my losing trades from Round 2 and found another common pattern among them. Eliminating those, I modified my system and increased my success rate by yet another 20%.
Finding what works is often a product of finding out what doesn't work, and just stop doing that!
If you need advice on how to stop a bad habit, just listen to Bob Newhart:
www.youtube.com
Finally, just as any athlete will you tell you that you should "Warm Up" before performing any strenuous exercise, one thing my backtesting system has taught me is that I need to spend the first 30 minutes of my trading day "warming up" by finding all the opportunities that presented themselves in the Futures market during the overnight session and log them in my spreadsheet. Likewise at the end of the day I look at all opportunities I might have missed so I can reduce the likelihood of missing them again. The original title of this article was "Backtesting to the Future" which reflected this habit: by 'warming up' before actually trading I got my mind prepared to "see the opportunities" for the future day ahead, and I identified these patterns a lot better than I would have if I entered the pool cold and experienced the 'cramp' of a losing trade.
Admittedly, backtesting a highly visual concept, so I will be following up this article with a video showing an example of my backtesting strategy and how you can model my system to meet the needs of *your* system. As I love to say, "Good artists copy, great artists steal." Likewise, "Good traders copy... Great traders steal." I hope you can steal some of these ideas and have them help improve your trading game!
Share your thoughts and success below! As always, I'd love to hear if this has helped you become more confident and profitable in your trading. Like and Follow if you haven't already and you will be alerted to when I post the followup video!
Trade hard and trade well!

05/11/2020 #NDX Trend is up. Will we get a pullback?According to my system, price is bullish on monthly, weekly and daily.
Bullish above 11600-40. If 11920 breaks, can try short to 11640, else better play safe.
Below 11600, downward support are at 11528-54, 11430-54 and 11256-84. Should market somehow sell off (idk why), 11040 should offer low risk buy level
05/11/2020 #SPX #ES_F Bullish yes but pullback will be healthy
Yesterday was US Presidential Elections Day. Outcome still not known but seem like Biden is going to win it. Lots of up down in between and fake downs but bulls win it.
No doubt price is bullish but based on price action, pullback is possible today. Price now at my 1st R and pullbacked 20pts. See if this level will hold.
Bias still up above 3412-22. But in the event that this breaks, look for 3392, 3356 (strong support level) to trade. If 3324 breaks, look for reaction at 3324. In the event 3262 trades today, it will be a low risk buy level.
04/11/2020 #ES_F #SPX Today decides the next trendAt time of this plan, price has made alot of reaction with my levels, which is a gd sign that such levels still hold during volatile times like this.
I have a hunch, yes HUNCH that we are going to sell off by end of day. I am often wrong so #comeandfademe.
Upside targets above my blue bias zone (3356-70) are 3402, 3415.2, 3436, each of which have nicely held some advances. Upper resistances are 3480 and 3544.
Below short targets are 3322-24 support zone, 3316.6, 3304, 3276, 3242, 3224. In the event of heavy sell off, 3196 should cap low of day.
Trade safe

04/11/2020 #EURUSD #FOREX Elections outcome will decide it allThis is a late post and price has already moved. But my levels are not based on what's past so everything is moving according to levels.
From yesterday's strong up candle, we would expect today to continue but as can be seen, it has been whipsawing.
My bias zone would be at 1.1712-20; safer to go long above and short below.
As the election results is going to come out, it remains anyone's guess as to how the day will pan out. For now, bearish momentum still persist, but as I always say, news can change anything.
Upside targets will be 1.1766, 1.1786, with resistance zone at 1.1802-12 capping high of day.
Downside targets will be 1.1692, 1.1678, 1.1646, 1.1616-18 and 1.1562-72. In the event of strong selling, I will be looking at 1.15 to cap low of day.
Trade safe.

03/11/2020 #SPX #ES_F Either way is possible Elections day.
Market was up yesterday and do look to continue - though on my system it is bearish on both monthly and weekly. But expect some volatility today (or maybe tomorrow) and thus either direction is possible.
My bias zone is at 3306-12. Currently price is up, supported by my 3320-24.6 resistance zone. Upside targets are 3345.2-50. 3362-64 should cap high of day.
Based on price action, we might have a deeper pullback to 3292-98.6 but still go up. Do nothing between 3298.6-3306.
Below 3292, look for shorts, target 3266, 3212-8.6. If 3196 trades, it should cap low of day, presenting low risk buy level.

03/11/2020 EURUSD - looking for a pullback dayEURUSD is bearish on daily, weekly, monthly timeframe, with 5 days of down candle. But with sell slowing down, looking for a pullback.
My blue zone for low risk buy/sell is at 1.1634-40. Admittedly my post came late and we had moved up. Immediate resistance is at 1.1656, 1.1672, 1.1690. 1.1712-22 is a resistance zone and should cap high of day.
In the event 1.1634 does not hold, 1.1624, 1.16060, 1.1590, 1.1560-70 are the support/short targets. 1.15020 is very far out. In the unlikely event this level trade today, it will offer a low risk buy level.

02/11/2020 #NDX #NQ_F Bullish for TodaySimilarly to SPX, cautiously bullish above 11015.
Immediate resistance is at 11117 (where price is at now). Acceptance above this, we should see 11254-80, where I expect a pullback if we get there. This zone should cap high of day, thus providing low risk sell zone.
If 10987 breaks, look for 10925-42 for support. Below support are 10781-803. In the event of strong sell, 10607-20 will provide low risk buy level

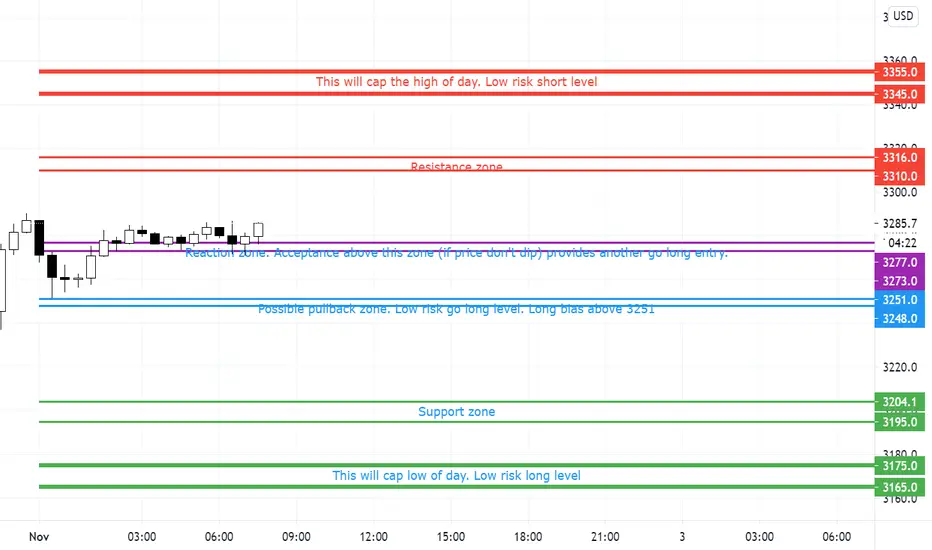
02/11/2020 #SPX Possible Up DayOn monthly, weekly, daily, #SPX is on a downtrend based on my system.
But price action wise, with Friday's doji close, we look to go higher.
This post is later than my usual, some opportunity might be lost already. Price already pullback to 3251 which was my long/short zone. 3273-77 is the other reaction zone to go long, and price is currently above.
Upside resistance will be at 3310-16. 3345-3355 is strong resistance, and it should cap high of day.
In the event 3248 breaks, unlikely today IMO, 3195-3204 will be support. 3165-3175 is strong support, and should cap low of day.
30/10/2020 #FTSE Where next?FTSE looks like a bear flag is forming.But with yesterday's reasonable daily close, both sides can be played today.
My blue zone - above 5587 for longs, target 5603, 5637, 5685. Be nimble and trail stops. I have a hunch we will see 5685, but hunch are hunch. Trade what you see.
Below 5569, be short. 5539 should offer a bounce as it is yesterday's low. We might even bounce here and rally. Below are 5489. 5443 is strong support, should cap low of day.

30/10/2020 #SPX Cautiously BullishI tweeted on 22 Oct when SPX is at 3422, we will see a down before end of year to 3140, 3062, 2888.
I called a possible pullback yesterday (29/10) in #NDX. Pullback occurred. When everyone is bullish, news out. Market tanked 300 pts - just at the hit of my R zone (see my other #TradingView post). So where next?
I am bearish longer term but intraday, we MIGHT see price go up today. Yesterday's daily candle was a doji. Price action wise, going up 1st looks more likely. It is not easy to call another up day when a pullback has already happened. But I shall.
3267-73 is support zone. Going long here with a tight stop below 67 offers good R:R, targets are 3295, 3323, 3331, 3355. If some news cause some rally, 3363 should cap high of day. Low risk sell level.
If you are conservative, close above 3295 will provide confirmation for a up day.
If 67 breaks, target 3249, 3212.5. 3185 should offer strong support to cap down move.

29/10/2020 #NDX Massive sell but good for a pullbackIn my previous #NDX levels given on 22 Oct, my heading was #NDX trying to find a bottom. I hope you heed the advice. All my levels played out perfectly.
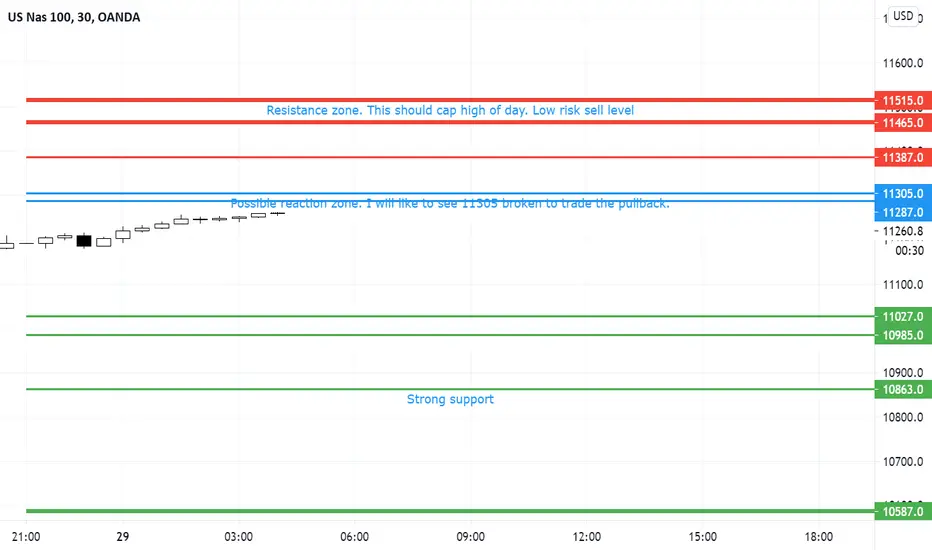
We had a massive sell yesterday. It will continue but I sense a pullback first. How deep it might be, I don't know but path of least resistance is still down imo. So play both sides.
Price has moved up slowly since open, around 70pts. If you aren't long yet, do note 11287-305 is my reaction zone. Possible reaction (rejection) for further down, targeting 11027, 10985, 10863. In the event of massive sell and 10587 trade, it will be a low risk buy level. If we do reach the lower levels, I sense there will be buying pressure to try to bring it up.
I will only trade the long if 11305 breaks, targeting 11387, 11465. 11465-11515 is a zone of lots of resistance. I expect rejection from there.
29/10/2020 #EURUSD Obviously bearish but patience is keyYesterday EURUSD tanked quite a bit. If you have been following my tweet, you should be warned. 500 pip movement I see coming, given during last weekend.
Yesterday's very bearish candle signal more downside coming. But I sense (yes sense) that we should have a pullback 1st (price did stall yday later in the session)
Thus you can either play the pullback(go long) or wait for pullback to happen to short or of cos, if it doesn't pullback, to trade the breakout.
Price now ranging in my orange zone for past 6 hours.
If 1.1741 breaks, look to target 1.1711, 1.1677. In the event of heavy selling and 1.1637-47 trades, look for rebound to go long.
If you want to trade the pullback, 1.1773-87 will be a zone with possible reaction to go short, targeting the below levels.
1.1813 should cap high of day. Almost unlikely it will trade, as it will give a bullish engulfing candle on a bearish candle yesterday. I will definitely go short there.
If you want to trade the pullback, probably on break of 1.1755 with stops at low (1.1741). Upside is little - 30pips imo

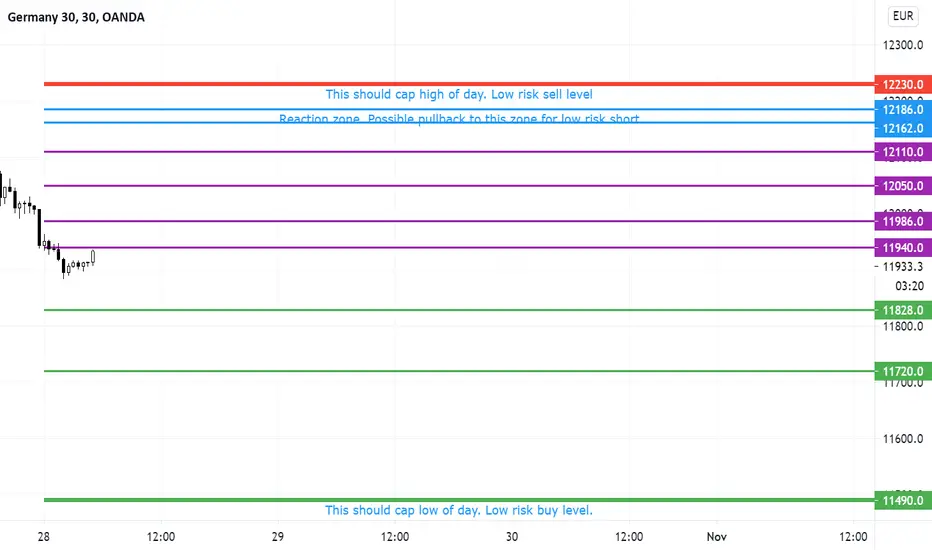
28/10/2020 #DAX30 Looking for more sell but open to pullbackLots of selling yesterday (27 Oct) for #DAX30 #FDAX, closing at the lows.
Selling pressure still on but there might be possibility of pullback. A lot of room to play for the pullback.
12162-86 will present a low risk short zone with purple lines 11940, 11986, 12050, 12110 resistance along the way.
If 12162-86 does not hold, 12230 should cap high of day.
Below targets are 11828, 11720. In the event of panic selling, 11490 should cap low of day - low risk buy level.
28/10/2020 #SPX #ES_F looking for more sell, till I am wrongYesterday (27 Oct) #SPX #ES_F closed at the lows. It is still ranging now. Normally if we are to pullback, it should come quickly from open, but not so yet, thus probably we will sell in Europe session. But do note that 3402-3406 is a valued area of yesterday, there is always a probability we might pullback to there. That will present a low risk short level.
Purple lines 3382 and 3390 are probably R. If you want to trade the pullback you can trade level to level, but as per my plan, the upside (above the blue zone) is limited - 3412 and 3420.
Below support are 3364.8, 3350.8. If 3323.8 hits, it should present a low risk long level.

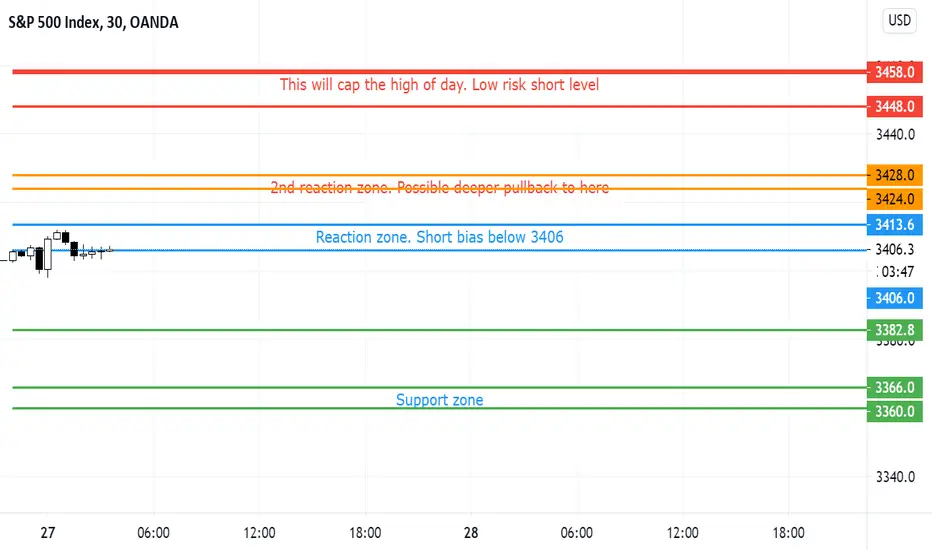
27/10/2020 SPX ES_F Let the sell continueMy post yesterday was titled "Let the crash begin?"
Probably will be more apt without the ?
We had a 100pts downmove then a pullback of 50pts. I still see further down; as I tweeted yesterday, no news is bad news.
Blue zone is usually my buy/sell level.But given the large movement yesterday, I actually put in an orange zone.
Be short below 3406 target 3382.8,3360-66 and even 3318. 3272, if we somehow reach there, will offer low risk buy level.
Do nothing between 3413.6 and 3424. If price pullback to this deeper levell, 3424-28 is the level to hold. If rejected, lower targets as mentioned above will be in play.
I will only want to look for longs above 3428, targetting 3448. 3458 should cap high of day - low risk sell level.
27/10/2020 EURUSD - where next?EURUSD has been ranging for the past 4 days, rather wide swings.
For now, EURUSD looks support above 1.1806 but I cannot ignore the possibility of further down move if 1.1806 breaks. Lower support at 1.1780-88, 1.1764-68, 1.1748. 1.1734 should cap low of day, presenting low risk buy level.
If 1.1824 break, we might see 1.1842, 1.1876. 1.1898 should cap high of day, low risk short level.

26/10/2020 EURUSD Possible pullback dayFri 23 Oct we had a down move, supported and a rally to close the day. However price is overextended and according to price action, we should see another pullback.
Below 1.1836 go short, target 1.18080-14. 1.1780 will act as strong support, thus I expect a strong bounce from there. If support breaks, 1.1758 should offer low risk buy level.
Above 1.1850 can be a level to go long, targeting 1.18860 and 1.1896. 1.1914-24 zone should offer strong resistance, capping the high of day and offering low risk sell level

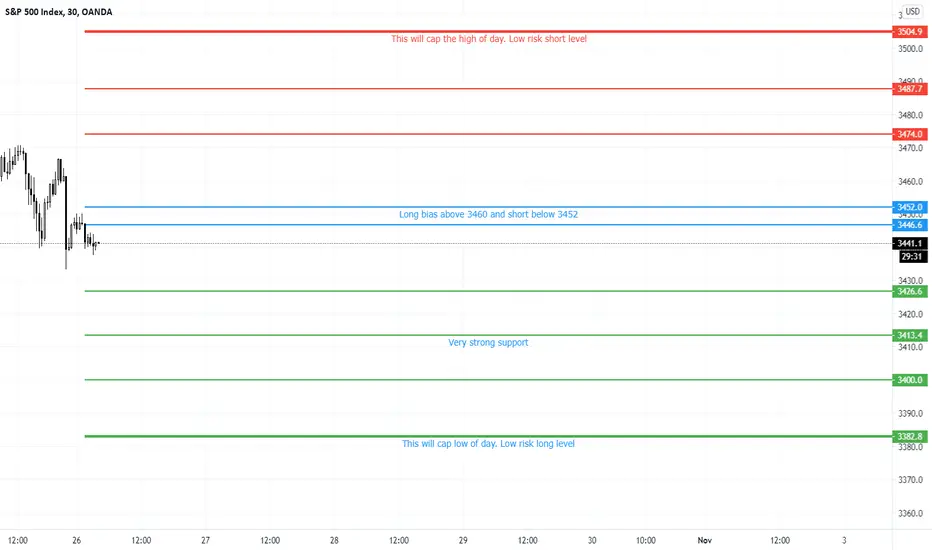
26/10/2020 ES_F SPX Let the crash begin?Price still ranging, in balance. 3 things which could affect the next move in SPX are the earning announcement, elections news, stimulus talk.
On a broader picture, as per my tweet last week, I am seeing a set up for a bigger correction coming before end of year.
Anyway for 26 Oct, look for longs only above 3460, targeting 3474, 3487. 3504 should cap high of day, offering low risk sell level.
Below 3452, bias is to the downside, targeting 3426, 3400. 3382 should cap low of day, offering low risk buy level
23/10/2020 #FTSE Based on yesterday's daily candle close with rejection off new lows, price action looks bullish.
Bias will be long above 5791, targeting 5822, 5839.4, 5858 and 5879. 5896 if hit will present low risk short level.
Below 5778, bias will be to the downside, targeting 5744 and yesterday's low near 5722. 5682 should present low risk buy level.
