PROMUSDT Forming Falling WedgePROMUSDT is forming a clear falling wedge pattern, a classic bullish reversal signal that often indicates an upcoming breakout. The price has been consolidating within a narrowing range, suggesting that selling pressure is weakening while buyers are beginning to regain control. With consistent volume confirming accumulation at lower levels, the setup hints at a potential bullish breakout soon. The projected move could lead to an impressive gain of around 50% to 60% once the price breaks above the wedge resistance.
This falling wedge pattern is typically seen at the end of downtrends or corrective phases, and it represents a potential shift in market sentiment from bearish to bullish. Traders closely watching PROMUSDT are noting the strengthening momentum as it nears a breakout zone. The good trading volume adds confidence to this pattern, showing that market participants are positioning early in anticipation of a reversal.
Investors’ growing interest in PROMUSDT reflects rising confidence in the project’s long-term fundamentals and current technical strength. If the breakout confirms with sustained volume, this could mark the start of a fresh bullish leg. Traders might find this a valuable setup for medium-term gains, especially as the wedge pattern completes and buying momentum accelerates.
✅ Show your support by hitting the like button and
✅ Leaving a comment below! (What is your opinion about this Coin?)
Your feedback and engagement keep me inspired to share more insightful market analysis with you!
PROM

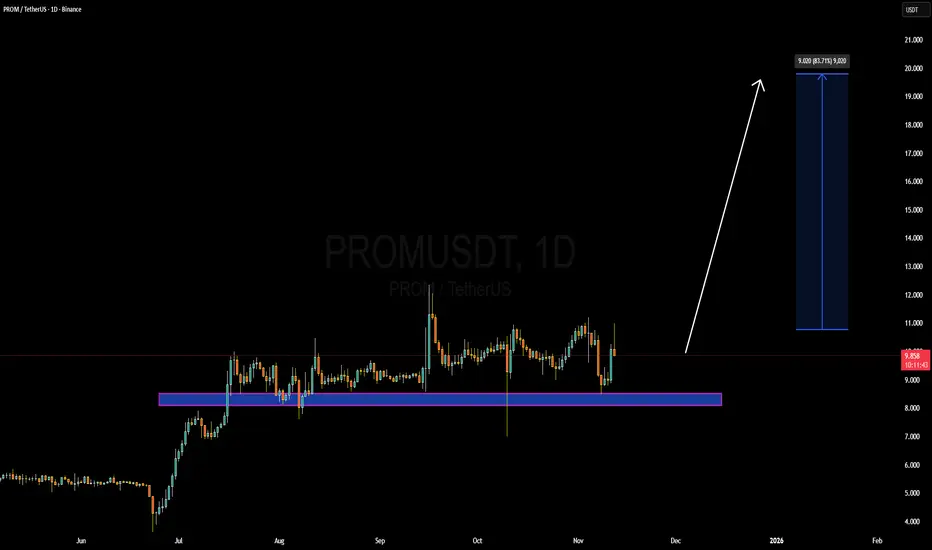
PROMUSDT Forming Bullish MomentumPROMUSDT is forming a clear Bullish Momentum pattern, a classic bullish reversal signal that often indicates an upcoming breakout. The price has been consolidating within a narrowing range, suggesting that selling pressure is weakening while buyers are beginning to regain control. With consistent volume confirming accumulation at lower levels, the setup hints at a potential bullish breakout soon. The projected move could lead to an impressive gain of around 90% to 100% once the price breaks above the wedge resistance.
This falling wedge pattern is typically seen at the end of downtrends or corrective phases, and it represents a potential shift in market sentiment from bearish to bullish. Traders closely watching PROMUSDT are noting the strengthening momentum as it nears a breakout zone. The good trading volume adds confidence to this pattern, showing that market participants are positioning early in anticipation of a reversal.
Investors’ growing interest in PROMUSDT reflects rising confidence in the project’s long-term fundamentals and current technical strength. If the breakout confirms with sustained volume, this could mark the start of a fresh bullish leg. Traders might find this a valuable setup for medium-term gains, especially as the wedge pattern completes and buying momentum accelerates.
✅ Show your support by hitting the like button and
✅ Leaving a comment below! (What is your opinion about this Coin?)
Your feedback and engagement keep me inspired to share more insightful market analysis with you!

PROMUSDT Forming Bullish ReversalPROM/USDT is currently forming what looks like a consolidation base after a prior downtrend, indicating that accumulation may be underway and a bullish reversal could be on the horizon. The token’s price has held firm around the $9-$10 range while trading volume shows improvement, suggesting that institutional interest and market participation may be increasing. This kind of scenario often sets the stage for a breakout when both price structure and volume align.
On the fundamental side, PROM is the native token of the PROM network, a modular zkEVM Layer-2 built for high throughput, cross-chain interoperability and developer-friendly dApp support. It has a relatively low circulating supply (around 18 million tokens) and a market cap in the range of US$150-180 million, which places it in the small-cap category with significant upside if adoption picks up. The project is gaining attention in the blockchain infrastructure space, which is a key keyword in crypto searches right now.
From a trading strategy perspective, one could watch for a breakout above recent resistance (around the $10-$11 zone) with increased volume as a long entry signal. If the breakout holds, the measured move could project a substantial gain, thanks to the structural base and strong fundamentals. Risk control would dictate placing a stop below the recent swing low or the bottom of the consolidation range to keep the trade’s reward/risk favourable.
THE UNEXPECTED BREAK OF PROM TO $15Prom is one of the coins that did show before a signal of fall, but unexpectedly, a whale trend did save it, with now the possibility that it can break to $15 in the coming time.

PROMUSDT Forming Bullish WavePROMUSDT is showing a bullish wave pattern, signaling strength and the potential for a continuation move to the upside. This type of formation often develops after a strong rally, followed by healthy consolidation, which allows the market to reset before pushing higher. The structure suggests that buyers are still in control, preparing for another leg up, and the technicals point toward a steady but promising gain.
Trading volume has remained supportive, which confirms the interest from market participants in this phase. Strong and consistent volume often acts as validation for bullish wave patterns, as it reflects confidence from both retail and institutional traders. With momentum building, PROMUSDT looks well-positioned to deliver gains in the 10% to 20%+ range in the short term.
Investors are paying attention to this project, with the market sentiment leaning toward optimism as the wave structure continues to play out. Such setups generally attract more traders who want to capitalize on a relatively lower-risk entry before the next move higher. If the current momentum sustains, PROMUSDT may gradually approach higher resistance levels, offering profitable opportunities for both swing traders and investors.
✅ Show your support by hitting the like button and
✅ Leaving a comment below! (What is You opinion about this Coin)
Your feedback and engagement keep me inspired to share more insightful market analysis with you!

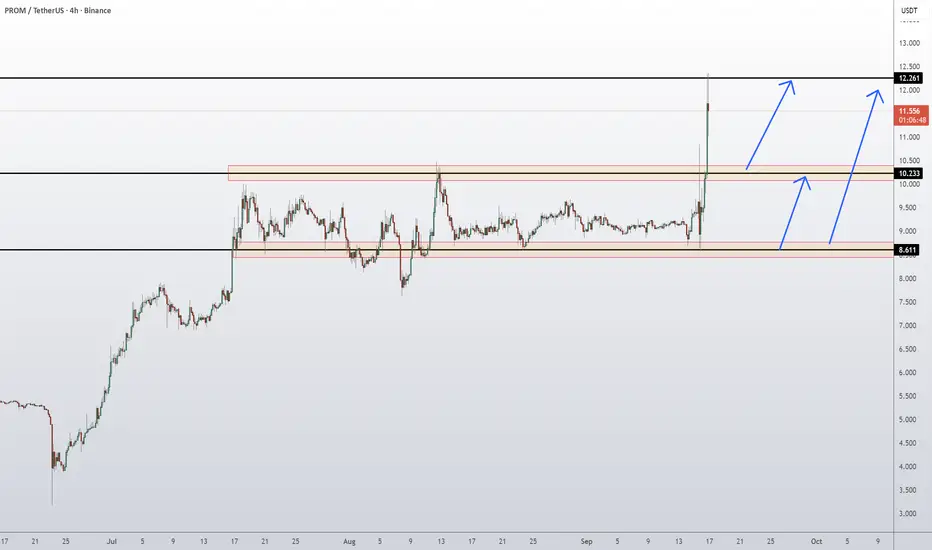
Prom Coin Token Price Prediction and Technical AnalysisPROM/USDT has broken out of its extended consolidation range, surging from the 10.233 resistance-turned-support and spiking toward the 12.261 resistance zone. This breakout confirms strong bullish momentum, but price is now consolidating just under the major resistance. If buyers manage to hold above 10.233, continuation toward 12.261 and potentially higher is likely. However, a failure to sustain could see a pullback into the 8.611 demand base before another leg higher.
📈 Key Levels:
Buy trigger: Retest/hold above 10.233 support
Buy zone: 10.23 – 10.50 region (secondary entry at 8.61 if deeper retrace)
Target: 12.261 resistance
Invalidation: Daily close below 8.611 (would weaken bullish setup)
👉 Follow me for More Real Time Opportunities.
Share your Thoughts if you have any?
PROMUSDT Forming Bullish SegmentPROMUSDT has delivered an impressive breakout after a long period of consolidation, confirming a strong bullish sentiment among traders. The chart highlights a clean accumulation range where price held steady before surging upward with momentum. With good volume accompanying this breakout, it suggests that buyers are taking control and fueling the next wave of the rally.
This breakout signals that PROMUSDT has the potential to target higher resistance levels, with traders now eyeing gains of around 40% to 50%+. The shift from consolidation to bullish expansion is a key technical setup that often leads to sustained upward trends. The surge in volume confirms the strength of this move, making it one of the more promising setups in the market.
Investor interest is clearly building, as seen from the sharp price action and heavy inflows. As long as price sustains above the breakout zone, momentum could carry this pair toward fresh highs in the coming weeks. PROMUSDT has now positioned itself as an attractive opportunity for traders seeking strong upside potential.
✅ Show your support by hitting the like button and
✅ Leaving a comment below! (What is You opinion about this Coin)
Your feedback and engagement keep me inspired to share more insightful market analysis with you!

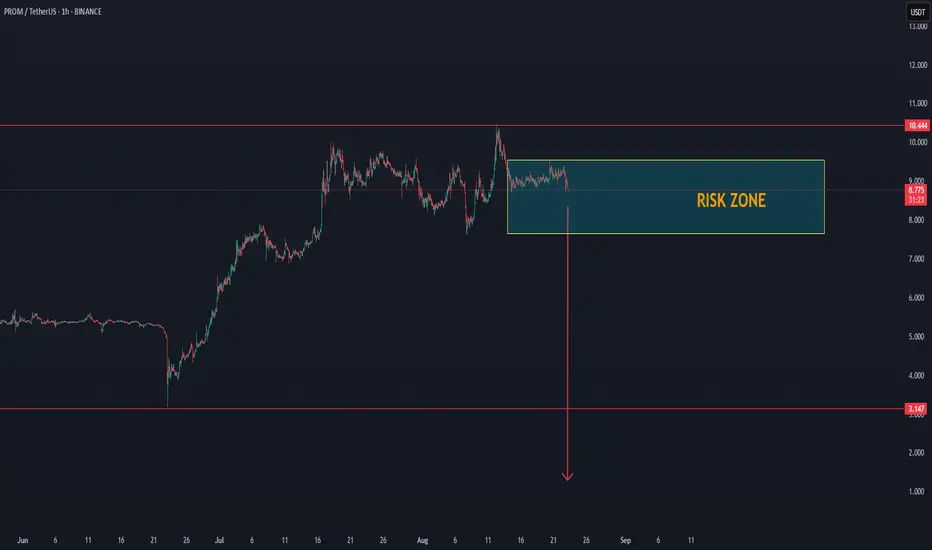
PROM AT RISK ZONE FREE FALL POSSIBLEThe latest data indicate that PROM is in a risk zone and could experience a breakdown.
The signal is present; it is now a matter of whether it will be confirmed or not.
This provides a reason to monitor the coin closely, tracking the data step by step.
This is not trading advice, as markets are inherently unpredictable.
We have observed similar signals before on other coins that subsequently experienced a free-fall breakdown. For this reason, we are providing this update.
PROMUSDT Forming Bullish FlagPROMUSDT is currently forming a bullish flag pattern, a strong continuation signal that often indicates the potential for further upside after a preceding rally. This pattern develops when price consolidates in a downward-sloping channel following a strong upward move, allowing the market to reset before the next bullish push. The structure suggests that buyers are preparing for another leg higher, which could potentially deliver gains of 30% to 40% or more once the breakout occurs.
The current trading volume for PROMUSDT is healthy, reinforcing the strength of this bullish setup. High and consistent volume during consolidation phases typically points to strong market participation and confidence among both retail and institutional traders. This indicates that the pullback within the flag is being supported by underlying demand, reducing the likelihood of deeper corrections and increasing the probability of a breakout continuation.
Investor interest in PROMUSDT has been growing steadily as traders look for short- to mid-term opportunities with strong technical backing. The bullish flag pattern, combined with favorable market conditions, could attract momentum traders looking to capitalize on a swift price move once resistance levels are breached. Monitoring the breakout point and confirming it with volume spikes will be essential for validating the trade setup.
In conclusion, PROMUSDT’s bullish flag pattern is signaling a high-probability opportunity for traders seeking steady yet meaningful gains. If the breakout occurs as anticipated, this setup could deliver a well-structured and timely rally, aligning with broader bullish sentiment in the market.
✅ Show your support by hitting the like button and
✅ Leaving a comment below! (What is You opinion about this Coin)
Your feedback and engagement keep me inspired to share more insightful market analysis with you!

Long Entry Signal for PROM/USDTBased on the daily chart for PROMUSDT on Bybit, here's a concise analysis:
MLR vs. SMA: The MLR (blue) is above the SMA (pink), indicating a bullish trend.
MLR vs. BB Center: The MLR is above the BB Center Line (orange), suggesting bullish momentum.
PSAR: The PSAR dots (black) are under the price, confirming a bullish trend.
Price vs. SMA 200: The price is above the 200-period SMA (red), supporting a long-term bullish trend.
Current Strategy: Since all entry conditions for a long position are met (MLR above SMA, MLR above BB Center, PSAR under price, price above SMA 200), you might consider entering a long position.
Stop Loss (SL): Set the stop loss at the current level of the PSAR dots to manage risk.
Monitor My Idea: Keep monitoring my idea for any changes in trend or for potential profit-taking opportunities.

prom/usdt new day trade movementsprom/usdt new day trade movements
This coin shows new volume patterns, which can be confirmed in the coming time as a day trade coin. We are going to follow this coin to see if it can be confirmed.
This times with BTC breakdown it's hard to find confirmed day trend coins.
The goal is to have a system that even if you have it wrong with 4 trades, that 1 trade will still be profitable over the 4 1/4

PROMUSDT (Prom) Updated till 14-01-25PROMUSDT (Prom) Daily timeframe range. its holding pretty well compare to many other alts. despite recent market dump it had pump thats good performance there. now PA trying to stay over 7.804 if it can next resistance to look at is 10.513.

PROM (1M_Journey) Entry ( 5.39 ) T( 8.1)Stop ( 4.89)BINANCE:PROMUSDT
1 Million Journey.
It is a long journey with NO FOMO & NO RUSH.
In those trades i will try to make 1 million USD from 1000 USD.
__________________________________________________________
(7)
Entry (5.39) 1000$
Target ( 8.1)
Stop ( 4.89)
This trade notes
*******************
* Risk is (9%), Reward (50%)
* the coin made (CHOCH) on daily time frame & price now in very nice range.
* the coin is retesting for going more up but i am enough with 50% profit
* if the coin price came more down may be i will add some more to minimize my entry price and the stop loss is same.
__________________________________________________________
General information
************************
1. throw this challenge i will try to make 1 million USD from 1000 USD
2. It will be very long journey not fixed by time with NO FOMO & NO RUSH.
3. I will take this challenge by my personal money and my personal decisions so please if you need to follow ( do your own plan).
4. May be i can achieve that target and may be not.
5. I think it will be educational challenge.
6. May be a lot of challenges Throw the journey, i will try to correct the path every fall.
6. I do not need 1000X in one coin but i need small profit with a lot of successful trades depend on the following formula for 10% Profit
NST= ( IN(FV/C) ) / ( IN (1+P) )
NST = Number of successful trades (NST)
FV = Final value
C = Capital
P = Profit percentage
IN = Natural logarithms ( IN from calculator)
NST = ( IN ( 1000 000 / 1000 ) / ( IN ( 1 + 10% ) ) = 6.908 /.09531 = 73.5 Successful trade. with no loses.
Risk management
**********************
1. Entry by 50% or 75% depend on the market situation.
2. Maximum 5% loses per trade.
3. Maximum 1 lose per day.
4. Maximum 2 loses per week.
5. Maximum 2 trades per day.
6. Minimum rewards has to be 5% and the maximum depends the coin targets & market situation.
Trading rules
****************
1. Figuring the best entry point.
2. After achieving more than 5% profit moving stop loss to secure 5% profit .
3. Trading available opportunities in the market ( everyday - every week - every month)
4. Trading will be spot only.
5. Trading will be with trusted & high liquidity platform ( Binance coins).
6. (Monitoring coins - low liquidity coins) will not be traded .
7. (High rewards -low risks - fast trades - lower time frames ) will be traded.
Notes
********
1. these rules can be changed due to the market situations and new challenges.
2. You can check the journey tags in the below Tags....
www.tradingview.com
www.tradingview.com
3. You can check my total posts in the below tag....
www.tradingview.com
__________________________________________________________
Golden Advices.
*******************
* collect the coin slowly in the entry range.
* Please calculate your losses before the entry.
* Do not enter any trade you find it not suitable for you.
* No FOMO - No Rush , it is a long journey.
__________________________________________________________
Thank you for reading,
@Crypto_alphabit
*****************************

PROMPROM is a High-performance scalable network based on Polygon CDK. PROM is an innovative gaming NFT marketplace that allows users to buy, sell, and trade NFTs.
Anyway, PROM chart seems very promising. A huge rise followed by a correction phase which seems unfolding in a big triangular pattern. Currently, PROM is at the bottom of this triangle, the best place to buy. When PROM breaks this triangle upward, that mean the next upward phase has already started. Let's see what happens.

PROMUSDT (Prom) Updated till 26-10-24PROMUSDT (Prom) Daily timeframe range. we can see a nice pump from its local low. which was pretty expected and it got more space to move around depends how retail acts. a valid close above 8.601 would be nice. recent support at 6.503.

PROMUSDT.4HThe chart for PROM/USDT on a 4-hour timeframe presents a detailed analysis of Prometheus (PROM) against USDT. Here's my in-depth analysis based on the chart:
Current Situation
Price Level: PROM is currently trading at $4.924.
Recent Price Action: The chart shows a significant downward trend followed by a period of stabilization and a slight upward rebound.
Support and Resistance Levels
Resistance Levels (R1 and R2):
R1: $5.809
R2: $6.436
Support Levels (S1 and S2):
S1: $4.406
S2: $4.002
Analysis and Conclusion
From the chart, PROM has broken through a major descending trendline, indicating a potential reversal or at least a slowdown in the previous bearish trend. The current price is testing the middle ground between the first resistance at $5.809 and support at $4.406.
Trading Strategy
Bullish Scenario: If PROM continues to gain and successfully breaches the $5.809 resistance, it could target the higher resistance at $6.436, suggesting a stronger bullish sentiment.
Bearish Scenario: Conversely, if PROM fails to sustain its current level and falls below the $4.406 support, it might seek lower grounds towards $4.002, which could signify a resumption of the bearish trend.
Final Thoughts
Monitoring PROM’s interaction with these key levels is crucial for any trading decisions. Given its current position and recent breakout from the descending trendline, there is a cautious optimism, but it remains vital to watch for any changes in volume and market sentiment that could indicate a more definitive direction. Setting stop-loss orders just below critical support levels can help manage risks in case of a sudden downturn. Always ensure your trading decisions are aligned with your overall risk management strategy and market analysis.

PROMUSDT.4HIn my analysis today, I’m focusing on the PROM against USDT, viewing the 4-hour chart on the Binance exchange. PROM is currently trading at approximately $5.517, with a noticeable downtrend observed over the recent periods.
Key Resistance and Support Levels:
PROM shows critical resistance at R1 ($5.809) and a further high point at R2, though not precisely identified on the chart. The nearest support level (S1) is identified at $4.406, which is slightly below the current trading price. This setup suggests a crucial juncture; if the price falls below this support, there could be further decline towards the lowest observed price around $4.373.
Technical Indicators Analysis:
• MACD: The MACD line is above the signal line but very close, indicating a potential slowdown in bearish momentum or an upcoming bullish crossover. However, both lines are near the zero line, indicating low momentum in either direction.
• RSI: The Relative Strength Index is just above 55, indicating neither overbought nor oversold conditions but tilting towards a more stable or bullish sentiment in the short term.
Analysis:
The chart reveals that PROM has been in a decline but shows signs of stabilizing or attempting a mild recovery as it approaches critical support levels. The proximity to R1 and the current RSI level suggests there could be a slight bullish momentum building, possibly testing the R1 level soon if the support holds.
Conclusion and Trading Strategy:
Considering the current price dynamics and technical indicators, my strategy would involve monitoring PROM for any signs of sustained bullish momentum or reversal patterns near the support level. If the price maintains above $4.406 and shows signs of an upward move, entering a long position with a target close to R1 ($5.809) might be feasible, while setting a stop-loss just below S1 to mitigate potential losses.
This scenario hinges on the market’s reaction near these critical technical levels and the overall market sentiment. Close observation of MACD and RSI developments will also be key in confirming the trend direction and strength before making any trading decisions.

PROMUSDT(PROM) Daily tf Range Updated till 15-05-24PROMUSDT(PROM) Daily timeframe range. even within decent volume its holding well for a while now. and not very far away from price discovery. for now to reach there it needs to break out of 12.375.recent support at 9.019.

SOL DOUBLE TOP PATTERNIn this post, a double top pattern could materialize on the price movement of BINANCE:SOLUSDT on an intraday perspective.
Upcoming full chart breakdown on the idea threads below. Happy trading to everyone!

PROM Coin Price Prediction🔥 Price on the 4H chart might come at these support area and we might get a potential bounce🔥
Potential bounce areas for Buying 9.526 and 6.731
👉 Follow me for More Real Time Opportunities.
Share your Thoughts if you have any?

Prom/BTCWill Prom will be the next greatest pump on Binance Like TRB?
I see a big wide divergence on weekly RSI which can cause a good pump for Prom btc and usdt next days
Circulating supply: 18,250,000 PROM only.
PLZ DYOR.
PLong

PROMUSDT.4HBased on the provided market data, the PROM token is currently priced at 6.69 USDT.
From a technical perspective, the Relative Strength Index (RSI) for 4 hours, 1 day, and 7 days are 52.51, 58.84, and 64.02 respectively. These values suggest that the token is neither overbought nor oversold, but is closer to being overbought on a 7-day basis.
The Moving Average Convergence Divergence (MACD) for 4 hours, 1 day, and 7 days are 0.269, 0.326, and 0.440 respectively. These positive values suggest that the token is on an upward trend.
The Bollinger Bands (Bb) for 4 hours, 1 day, and 7 days are 8.68, 7.67, and 7.67 respectively. The current price is closer to the lower band, indicating a potential upward price movement.
The token has support levels at 6.56, 5.95, and 5.29 for 4 hours, 5.95, 4.48, and 3.67 for 1 day, and 4.85, 3.71, and 3.707 for 7 days. The resistance levels are at 8.89, 9.44, and 10.007 for 4 hours, 9.44, 10.058, and 11.050 for 1 day, and the same for 7 days.
In conclusion, the PROM token shows signs of an upward trend. However, any investment decision should be made cautiously considering other factors like market conditions, news related to the token, and risk tolerance.

PROM Coin Price Prediction🔥 Price on the 4H chart might come at these support area and we might get a potential bounce🔥
Potential bounce areas for Buying 7.162 and 5.269
👉 Follow me for More Real Time Opportunities.
Share your Thoughts if you have any?
