PROVE/USDT — Volume Range Expansion Forming, Eyeing $1.38 PROVE/USDT — Volume Range Expansion Forming, Eyeing $1.38 Breakout 🚀
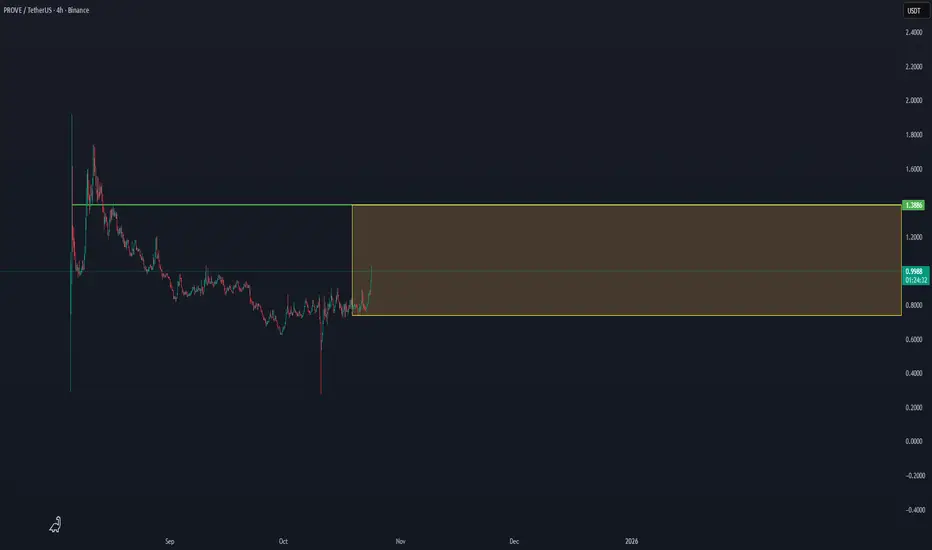
Prove Network (PROVE) is gaining momentum after a long accumulation phase, now trading near the mid-point of its volume box between $0.74 – $1.38.
This structure indicates a potential accumulation-to-expansion pattern, where sustained buying pressure could push the price toward the upper boundary of the range.
If PROVE confirms a close above $1.38, it would likely initiate a strong breakout continuation, supported by previous high-volume reactions around that zone.
📊 Technical Overview:
Support Zone: $0.74
Range Mid-Level: $0.99
Breakout Level: $1.38
Bias: Accumulation → Bullish continuation
Volume is gradually building, suggesting that buyers are re-entering the market, and the breakout confirmation at $1.38 could trigger a rapid move toward the next major resistance area.
📈 Outlook: Range expansion setup
🎯 Targets: $1.38 → $1.80
Prove
PROVEUSDT Forming Falling WedgePROVEUSDT is displaying a falling wedge pattern, one of the most reliable bullish reversal formations in technical analysis. This pattern often signifies that downward momentum is losing strength and that a potential trend reversal to the upside may be imminent. The price action within the wedge suggests gradual compression, typically followed by a breakout driven by renewed buyer interest. With good trading volume, the pair is showing healthy market participation, which supports the possibility of a strong upside movement once resistance levels are broken.
The expected gain of 140% to 150%+ highlights the potential for a substantial price rally if PROVEUSDT successfully confirms a breakout above the wedge’s upper trendline. Increased investor attention in this project reflects growing confidence in its fundamentals and market potential. If the coin sustains higher lows with volume-backed buying pressure, this could mark the beginning of a strong bullish wave that propels the pair toward key resistance targets in the coming sessions.
The overall technical setup for PROVEUSDT looks promising, as it aligns with broader bullish sentiment returning across the altcoin market. Investors appear to be positioning themselves early, anticipating a significant breakout phase. A confirmed breakout from this pattern could serve as a strong signal for trend continuation and possibly ignite further momentum across related assets.
✅ Show your support by hitting the like button and
✅ Leaving a comment below! (What is You opinion about this Coin)
Your feedback and engagement keep me inspired to share more insightful market analysis with you!

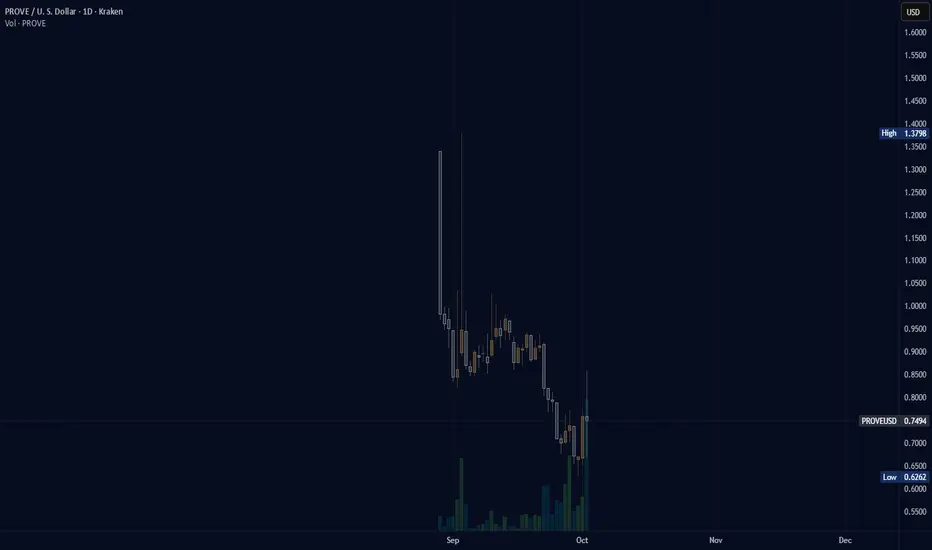
(PROVE) succinct "listed to kraken"When I was doing the end of month tally I did notice a few companies that were listed on Coinbase that were not available on Kraken. The next day I noticed PROVE was on Kraken. Did it slip by unnoticed inpublicly based on the new listings page of kraken or did I not write it down at the time. I check new listings for Kraken daily, practically, and even if a day or two goes by when I miss checking I usually catch up quickly.
PROVEUSDT UPDATE#PROVE
UPDATE
PROVE Technical Setup
Pattern: Bullish falling wedge breakout
Current Price: $0.7489
Target Price: $1.41
Target % Gain: 85.91%
$PROVE is breaking out of a falling wedge pattern on the 1D timeframe. The breakout suggests strong bullish momentum with a target near $1.41, offering nearly 86% upside potential. Structure favors continuation if momentum holds. Always use proper risk management.

PROVEUSDT Forming Falling WedgePROVEUSDT is showing a classic falling wedge pattern, which is one of the strongest bullish reversal signals in technical analysis. This structure forms when price action trends lower while converging within a narrowing channel, suggesting that bearish momentum is fading and bulls are preparing to take control. With volume remaining solid, the chances of an explosive breakout are increasing, signaling a strong opportunity for traders.
The technical setup points toward an impressive gain potential of 190% to 200%+, making this pair one of the more aggressive bullish candidates in the market right now. A breakout above the resistance line of the wedge could trigger a wave of momentum-driven buying, further fueled by investor confidence and accumulation already visible on the charts.
Investor sentiment around PROVEUSDT is improving, and as interest continues to grow, the breakout could accelerate quickly. With good trading volume and strong market participation, this pair has all the technical ingredients to deliver a substantial rally once the breakout confirms.
✅ Show your support by hitting the like button and
✅ Leaving a comment below! (What is You opinion about this Coin)
Your feedback and engagement keep me inspired to share more insightful market analysis with you!

PROVEUSDT Forming Bullish ContinuationPROVEUSDT is showing a strong bullish continuation pattern, signaling the possibility of a powerful upward move in the coming days. After consolidating within a well-defined range, the breakout structure is now becoming clear, with price action building momentum. The setup suggests that the pair has the potential to deliver gains of around 140% to 150%+, making it an attractive opportunity for both traders and long-term investors.
The volume profile is also supportive of this bullish outlook, as consistent buying pressure indicates increasing market confidence. High volume on upward moves and steady accumulation during retracements often confirm that strong hands are entering the market. This provides further strength to the continuation pattern and raises the probability of sustained growth in the next phases of the trend.
Investor sentiment toward PROVEUSDT is improving rapidly, with growing interest in its technical structure and market potential. As the bullish continuation pattern unfolds, we may see a significant breakout that could establish new higher resistance levels. This creates an exciting window for those looking to capitalize on momentum-driven opportunities.
✅ Show your support by hitting the like button and
✅ Leaving a comment below! (What is You opinion about this Coin)
Your feedback and engagement keep me inspired to share more insightful market analysis with you!

Prove Possible buying zoneBINANCE:PROVEUSDT has reached a good support area and has shown a positive reaction once, and most likely after the retest we can expect a good rise to $1.3.
⛔ Disclaimer: No Guarantee of Profit or Loss
Please be aware that all investments, trading, and financial decisions involve risk. The information provided is for general informational purposes only and should not be considered as financial advice. We do not guarantee any specific outcomes, profits, or returns.
You are solely responsible for your own investment decisions. The past performance of any investment or strategy is not a reliable indicator of future results. We recommend conducting your own research and consulting with a qualified financial advisor before making any financial decisions.
By using this information, you acknowledge that you will not hold us liable for any losses or damages incurred as a result of your financial activities.

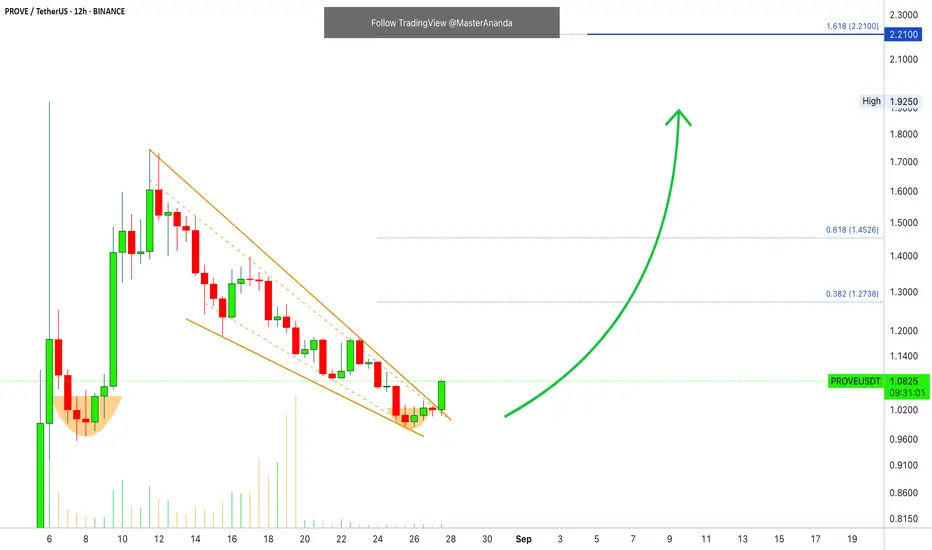
Prove · Futures Trade-NumbersHere we have an easy chart setup. It will be a great one with Bitcoin just turning green. This whole market is about to blow up.
The chart is good here PROVEUSDT. We have a perfect falling wedge pattern, with the trend-lines matching perfectly the candle wicks. What's better is the current bullish breakout after a higher low. These signals are strong when combined—bullish.
________
LONG PROVEUSDT
ENTRY: 0.9900 - 1.10 (STOP: 0.9815)
TARGETS: 1.16, 1.27, 1.45, 1.74, 2.21
________
This is an interesting pair and can be easy to trade. Our strategy is more based on great entry prices and timing, so we only need to buy; once bought, the market takes care of the rest.
We try to spot the reversal, so always a bottom or support; and at this point we are bound to see growth, if we get it right of course.
PROVEUSDT is in this reversal point. We have the reversal pattern and the bullish breakout happening just now. If I decide to buy in, I just hold. Because we are already ready for growth.
Enjoy the numbers.
I am wishing you great profits and success on the long run.
Keep moving towards your goals.
Keep reading. Keep trading.
Thanks a lot for the support.
Namaste.
PROVE : PROVE Find out.Hello friends🙌
✅We have come with an analysis of the PROVE currency, which has just been listed and is in a good range. If this pattern fails, you can enter a purchase transaction in steps and with risk and capital management. We have also specified the stop loss for you and the targets are also specified...
⚠Be careful not to involve more than 1 to 2% of your capital in buying these types of currencies and be sure to manage your capital.⚠
🔥Follow us for more signals🔥
*Trade safely with us*

$PROVE (PROVE) 4HPrice rallied sharply to $1.52 before retracing, showing early signs of local profit-taking. Current consolidation above $1.35 keeps the short-term bullish structure intact. Watching for a potential retest of $1.25–$1.28 as support before the next leg higher.
$PROVE is gaining traction as a newly listed token with increasing on-chain activity and early investor interest. Liquidity remains healthy post-launch, and positive sentiment is building as more exchanges consider listing it.

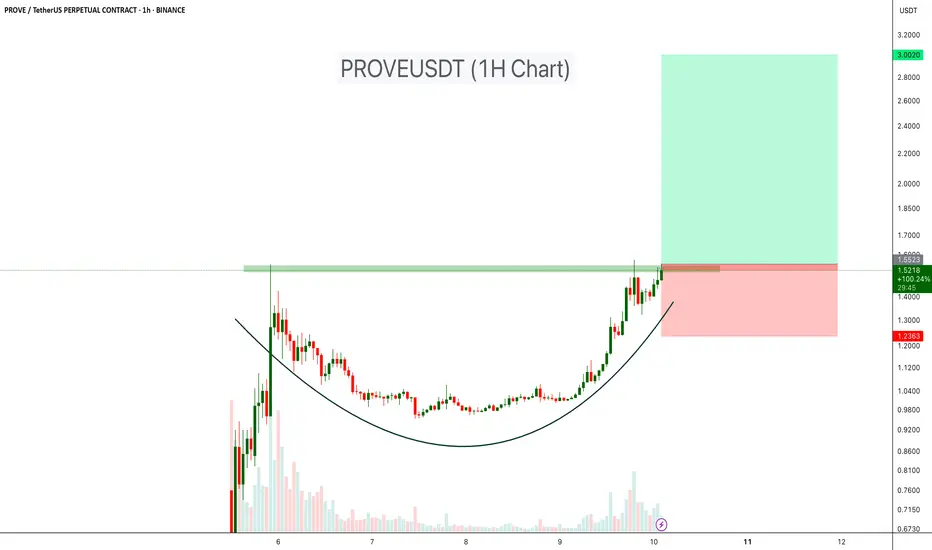
PROVEUSDT About to Break Out of Cup Formation!BINANCE:PROVEUSDT has formed a well-defined Cup pattern on the 1-hour chart, signaling strong accumulation after a prolonged consolidation phase. Price declined sharply before bottoming out and gradually curving upward, creating the classic rounded base that reflects a shift from selling pressure to steady buying interest.
The breakout zone is around $1.55, which has acted as a key resistance level. A confirmed close above this level, supported by strong volume, would validate the pattern and could spark a move toward the projected target near $3.00 - $4.00 level.
Cheers
Hexa
BINANCE:PROVEUSDT.P
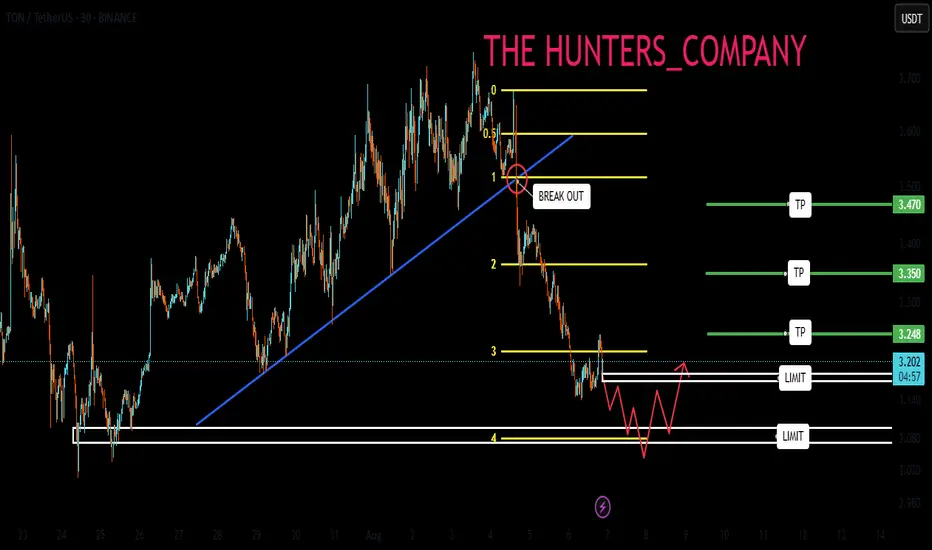
TON : Does the TON ecosystem have growth potential?Hello friends🙌
✅Given the decline we had in the entire market, TON was no exception and had a decline that has plunged the market into fear as to whether the decline will continue or whether the price will finally grow.
✅Well, as you can see, there is still no sign of serious buyers on the chart, and we are planning based on observations, not assumptions...
✅In this chart, the price is likely to move to the support area specified by Fibonacci and buyers will show their support, but what is the best way?
✅The best way to buy safely and with capital and risk management is in steps, where we have specified the purchase steps for you and the goals are also specified.
🔥Follow us for more signals🔥
*Trade safely with us*