Slowly towards its target of 290+27-01-2026
Slowly towards its target of 290+
a Very Strong Support seems to be around
260 - 265
PSX

POWERPOWER is completing a ~4 months consolidation, similar to the previous base that led to a strong upside move. Price is now attempting a range breakout with improving volumes, indicating fresh participation.
Buy above: 20.6
Immediate resistance: 24
Targets: 24 → 25.5
Upside potential: ~16–25%
RSI: Rising and supportive of momentum
Structure favors continuation if price holds above the consolidation high. A clean close above resistance can trigger the next leg up.

WAVES Technical Outlook
📊 Technical View – WAVES
Price is at an important horizontal support, showing a rebound attempt. The same zone is also supported by a rising trendline and aligns with the Fibonacci Golden Zone, creating a strong confluence area 🔁✨
🔹 Trade Idea
Entry: CMP 13.37
Stop Loss: 12.60 🛑
🎯 Upside Targets
14.30
14.85
15.38
16.00 (Breakout Zone) 🚀
The trend will maintain a bullish bias as long as the price holds above the support zone 📈.
A volume expansion breakout can accelerate upside momentum.
⚠️ Strict SL discipline is essential.

Hascol key levelsThese are key levels for hascol
12.69
13.41
14.15
14.91
15.70
16.50
17.32
18.16
19.03
19.91
20.81
21.73
22.67
23.64
24.62
25.62
26.64
27.69
28.75
29.83
30.93
32.06
33.20
34.36
35.54
36.75
37.97
39.21
40.47

BML Golden Ratio Support SetupBML has retraced to the 0.618 Fibonacci golden ratio, aligning with a strong daily support zone. A buy can be considered in this region, with a stop loss below the last low and profit targets around 7.5 and 10.

FFL Bullish ABCD Breakout Setup FFL has closed above its supply zone and is currently trading above it, suggesting the start of a new bullish leg. Based on the ABCD harmonic projection, the next leg could extend toward 27 rupees. A buy at the current market price is recommended, with a stop loss below the last demand zone.

21/01/2025 - KSE100 Index Retracement ExpectedExpecting Retracement in KSE100 Index
As prominent Divergence occur and Evening Star Is also formed.
Disclaimer : This is not a Trading or Investment Advise.

GATM – Bullish Setup
GATM is trading inside a well-defined rising channel and is now approaching the upper boundary resistance. Price action suggests strong buyer dominance.
Technical Highlights:
Trend: Bullish (HH–HL structure intact)
Pattern: Rising channel, breakout attempt near resistance
Momentum: Strong continuation behavior
RSI (Daily): 68, healthy with no bearish divergence
Volume: Improving, supportive for upside breakout
A successful breakout above the channel can lead to strong upside continuation.
Trade Setup:
Buy 1: CMP 31.91
Buy 2: 30.00 (pullback opportunity)
Stop Loss: 28.80
Targets:
35.00
36.50
38.00
39.50
Bias: Bullish
Approach: Buy on dips, trail profits near upper targets.

THCCL - PSX - BUY CallOn Daily TF, THCCL has recovered back from Golden Pocket. At present, price is almost going sideways with bare minimum volumes. Technically correct buying is BUY-1 (105) but one can also take entry at BUY-2 (78) if price drops there with SL at 69.
(I'm using Volume Candles which adjust there size according to volume; but on request of a subscriber, I'm also showing Volume Indicator who is acquainted with it better).

DGKC Technical Analysis ( PSX, PAKISTAN STOCK EXCHANGE )DGKC Technical Analysis
The price is currently Making a Bullish Pennant . A breakout above the upper boundary could lead to further upward momentum. T1,T2,T3 are mentioned on the chart.

MUGHAL Technical Outlook MUGHAL – Swing Idea
The stock has taken strong support from the Fibonacci golden zone.
RSI is stable and the overall price structure remains bullish, indicating that the recent pullback looks healthy rather than a trend reversal.
CMP and the 101–98 zone remain active for buy-on-dips.
Stop Loss (closing): 95
Targets: 109 – 115 – 123 – 129
This is a trend continuation setup — patience can lead to better rewards. 📈
Analysis for educational purposes only.

NBP is heading to 400+ areaNBP could cross 400 level in future as its momentum.
These are key levels.
238.70
248.06
259.21
270.60
280.56
292.41
304.50
315.06
327.61
340.40
351.56
364.81
378.30
390.06
404.01

GAL Technical Outlook📈 GAL (Ghandhara Automobiles Ltd) – Technical Observation | Bullish Structure
GAL is maintaining a higher highs and higher lows market structure, indicating a healthy uptrend. After a controlled pullback, price has reacted positively from the rising trendline support, suggesting buyers are still active.
At the time of observation, price is trading around 547, where a short-term reaction from support is visible.
🔹 Key Technical Levels:
• 570 acted as a strong accumulation and resistance zone
— A decisive breakout with strong momentum above this level may open the path for further upside continuation.
🎯 Potential Upside Zones (if breakout sustains):
• 590
• 620
🚀 633 is a major structural breakout level. A sustained move above this level could indicate trend acceleration.
📊 Overall bias remains bullish as long as price holds above the ascending channel support.
📚 This analysis is for educational purposes only and reflects technical observations, not a trading recommendation.

Important Level??RSI Divergence appearing on shorter tf.
a bounce is expected from this Zone 180000 - 180600

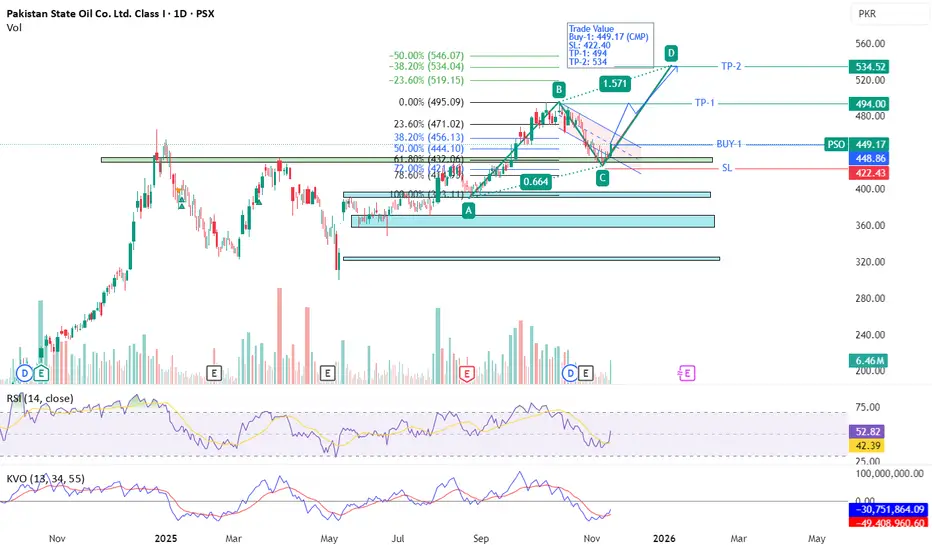
PSO - PSX - Technical Analysis AB=CDOn daily TF, PSO has retraced to Fib 62% and then went up after staying there for a few days. Closing of a Green Candle with volumes indicates that Buyers are active now. Also noted that KVO trigger line (Blue) has just crossed over the Signal line (red) indicating interest of Buyers although it is yet below zero level but its direction seems quite vertical. Also RSI is also moving up very sharply and still it has room to move up quote a bit. AB=CD pattern has been drawn to arrive to the TP.
Trade Value
Buy-1: 449.17 (CMP)
SL: 422.40
TP-1: 494
TP-2: 534
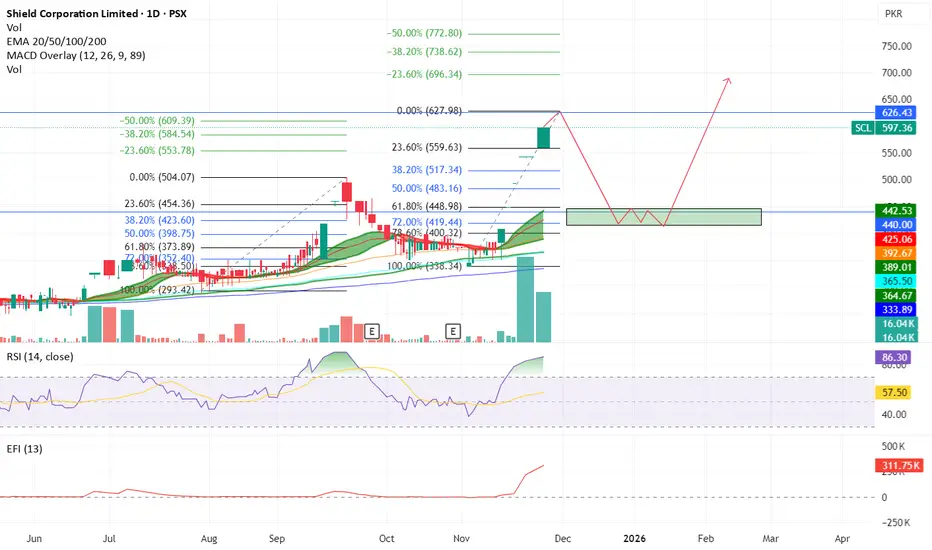
SCL - PSX - Technical AnalysisOn daily TF, price has been making cap after cap. Now volume has started to fall, therefore, it is expected that price will test 625~630 region and will drop sharply due to profit booking.
New entries should be avoided.
Then it is expected to drop around 425~440 region and will stay there for around 6 weeks before again going up.
Ideally buying should be initiated once price bounces back from 425~440 region and crosses 450. Then Target Price should be 620 and then 7690.
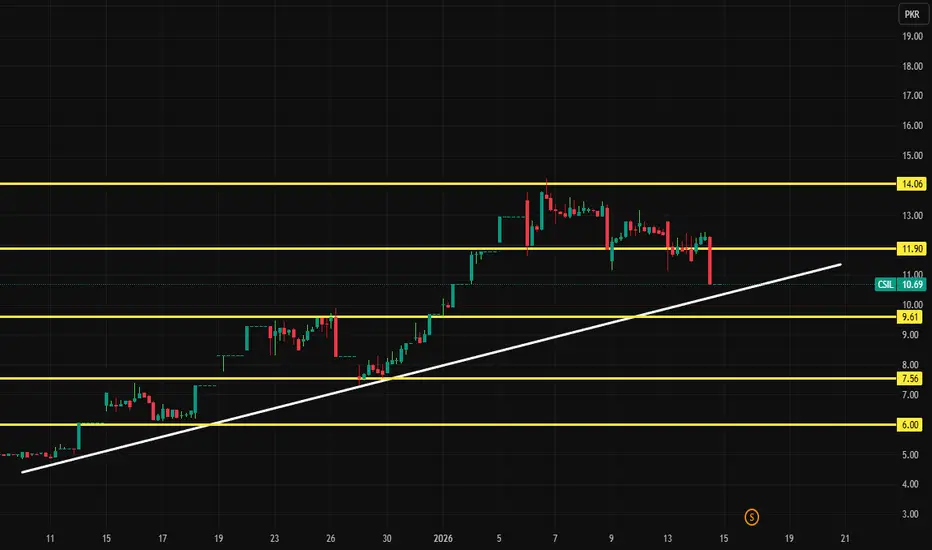
Pace Key levelsThese are key levels
9.61
10.24
10.89
11.56
12.25
12.96
13.69
14.44
15.21
16.00
16.81
17.64
18.49
19.36
20.25
21.16
22.09
23.04
24.01

FFL – Breakout From 42-Day Accumulation ZoneFFL has broken out from a 30-candle / 42-day accumulation range, which aligns perfectly with the weekly Fibonacci golden zone, adding strong confluence to the bullish setup.
Today’s move shows a decisive candle-body breakout with rising volume, indicating renewed buying strength.
As long as the 18.00 support holds, the structure remains bullish.
Upside Targets:
📍 21.00
📍 21.60
📍 22.65
Trend continuation looks likely unless price re-enters the previous range.

MUGHAL STEELMUGHAL STEEL PSX
Follow the plan | Manage Risk–Reward strictly
🔹 Price retracing → offering two strong buying zones
🔹 Good share to accumulate for medium–long term (2026 view)
🔍 Fundamental Strength
✅ Strong group backing (Conglomerate exposure)
✅ Diversified earnings streams (core + growth segments)
✅ Healthy cash flows & balance sheet support
✅ Long-term growth visibility aligned with economic recovery
📊 Technical View
📉 Retracement from recent highs — healthy correction, not trend reversal
📍 Buying Zone 1: First demand area (for partial entry)
📍 Buying Zone 2: Strong support / value zone (for accumulation)
📈 Primary trend intact (higher-highs & higher-lows structure)
🛑 Clear invalidation level — risk well defined
⚠️ Trading Plan
🎯 Staggered buying on dips
🎯 Hold for 2026 unless structure breaks or USE TPs mentioned.
❌ Avoid over-leveraging
🧠 Let price confirm — no emotional entries
This is a structured accumulation setup, not a chase trade.

ANL - Technical Outlook ANL has given a rounded arc resistance breakout after a long consolidation phase. Along with this, price has also broken out of an ascending channel, which clearly indicates strong buying interest.
The RSI (14) is around 67, showing strong bullish momentum while still remaining below the overbought zone. Improvement in volume further validates the breakout and supports continuation.
🟢 Buy Plan
First Buy: CMP
Second Buy: 11.70 – 11.90 (Dip buying zone)
❌ Stop Loss
11.30 (Daily close basis)
🎯 Targets
TP1: 13.10
TP2: 13.70
TP3: 14.40
📌 Note
A daily close below 11.30 will invalidate this trade.
Book partial profits at each target
Risk management is compulsory

RPL - PSX - Buy CallRoshan Packages Ltd on daily time frame, has experienced SMA 21 (blue) crossing over SMA 200 (yellow) - which is also known as Golden Cross. When this happens prices tend to move very sharply. One can Buy here at CMP however, technically very correct entry would be on crossing the Resistance nearby at 19.65.
RSI indicator also suggest that sentiments are going bullish steadily; however, KVO is suggesting a likely reluctance as volumes have dropped down.
Trade Values
Buy-1: 19.09 (CMP)
Buy-2: 19.65 (technically even better)
SL: 18.00
TP-1: 22.00
TP-2: 24.00

PAEL - Technical Outlook PAEL is showing a potential breakout above a long-term descending resistance trendline, supported by increased volume and a firm base on the ascending trendline near 52. A sustained move above 54 could signal a strong bullish continuation with clearly defined targets:
• TP1: 56.03
• TP2: 57.82
• TP3: 60.20
• TP4: 62.63
Stop-loss is recommended at 51.30 to protect against false breakouts. Momentum indicators support a cautiously optimistic outlook.
