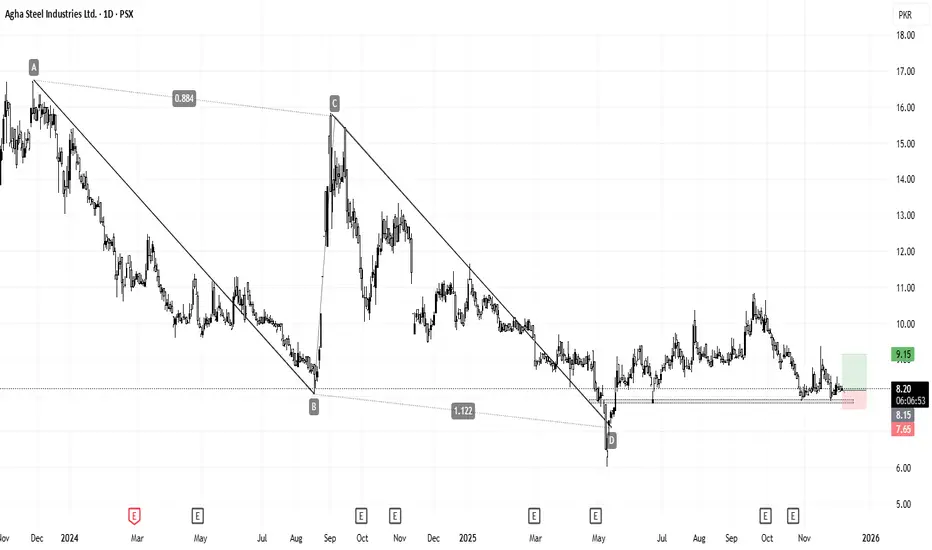
AGHA Potential Reversal Zone SetupAGHA is currently trading around its potential reversal zone , aligned with the ABCD projection . Strong accumulation suggests a possible upside move. A buy at the current market price is recommended, with a stop loss below the support area.
PSX
PSO - Short Term Round bottom formationPSO is developing a well-defined rounded bottom on the 1H chart, with price now approaching the major neckline at 480. A decisive breakout above this zone would confirm the reversal pattern and open the door for continuation toward higher resistance levels. Bullish structure remains intact while holding above 450–455

PPL - Technical OutlookPPL is moving firmly within its ascending channel on the 1D timeframe and is now approaching the major breakout level at 216. A confirmed break above this zone can open the next leg higher, with the first short-term target near 230, which aligns with the channel’s upper resistance. Beyond that, the 240 level stands as an external structural resistance outside the channel. Bullish structure remains intact as long as price holds within the rising channel.

OGDC - Technical Update - Round Bottom OGDC is forming a strong rounded bottom on the 1h chart. Price is pressing against the 273 neckline, while the major breakout level sits at 286. A clean breakout above these zones could open room toward 305+. Watching for either a direct breakout or the formation of a small handle. Overall structure remains clearly bullish.

SLGL Golden Ratio Bounce SetupSLGL has broken its supply zone and continues to form higher highs and higher lows. The price is currently bouncing from the 0.618 Fibonacci golden ratio . A buy can be made at the current market price, with take profit around the last high and the ABCD projection , and a stop loss below the last higher low.

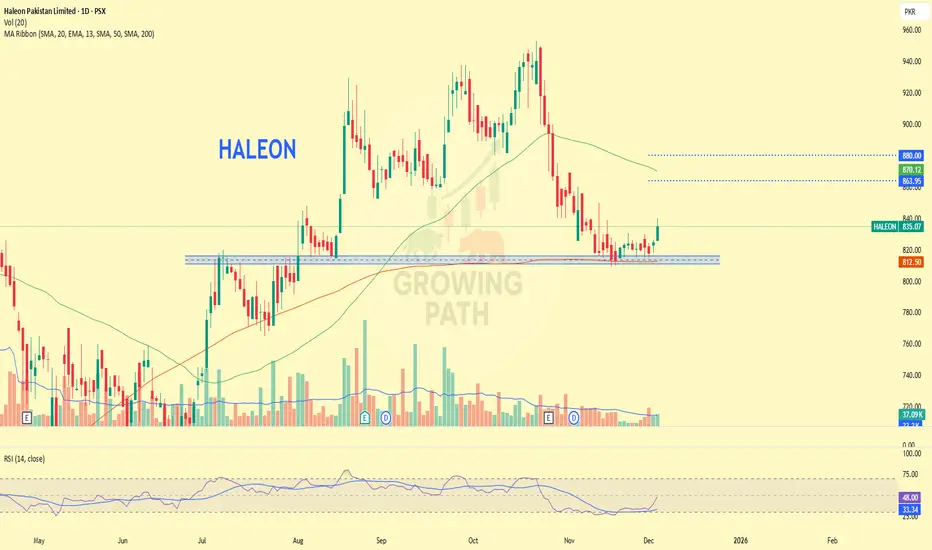
HALEON – Double Bottom ConfirmationHALEON Price has formed a clear double bottom, and the major support zone has now been tested for the third time, strengthening the bullish reversal setup. With today’s breakout candle and improving momentum, the stock shows strong potential for a continued move upward toward the 863 → 880 resistance band.
📈 Trade Plan
Buy between: 827 – 836 area
Stop-Loss: 809
Targets: 863 / 880
Holding above support keeps the bullish structure intact.
KSE-100 – Pullback Toward 164k Before Next Leg Up?The index is holding near the 166.2k short-term support, but current momentum suggests a deeper retracement is still on the table.
A dip toward the 164k zone remains likely, where strong confluences align:
🔹Fib Golden Zone (50–61.8%)
🔹Touch of the rising channel support
🔹Retest of the higher-timeframe breakout structure
If buyers defend the 164k region, the setup remains bullish toward 170k+ on the next impulse

LPGL — Ready for 160–180 MoveCMP: 110.80
Risk: Medium–High
Structure: Accumulation + Early Reversal Signs
Tenure: 2–6 months
LPGL has respected its long-term demand zone and continues to hold the ascending support line, indicating steady accumulation after a prolonged correction. The recent bullish weekly candle suggests early strength, with price aiming for a move towards the major supply zone at 160–180, which remains the first meaningful target region. As long as LPGL stays above the recent swing low (~84–88), the upside structure remains intact. Clearing the horizontal resistance will open the path for a cleaner continuation toward the upper range.
Targets: 124 - 140 - 160–180
Stop Loss: 84–88 (Weekly close basis)
Bias: Bullish above support; re-evaluation if weekly structure breaks.

BNWM - Technical OutlookBNWM is attempting a clean breakout from its descending channel after a strong reaction from the Fibonacci Golden Zone (61.8%–50%). With momentum shifting, the next upside levels align with major Fibonacci resistances:
• TP1: 68.87 (50%)
• TP2: 79.11 (38.2%)
• TP3: 91.77 (23.6%)
• TP4: 112.24 (0%)
Structure remains positive as long as price holds above the breakout zone, and partial profit-taking before the higher Fib levels is advised for disciplined risk management.”

JVDC - Technical Outlook Price has successfully defended both the major ascending trendline and the horizontal support, and is now pressing into the upper boundary of a mini descending channel. A confirmed breakout above 77-78 can open the path toward the following targets:
• TP1: 81
• TP2: 86
• TP3: 90.50
• TP4: 99-100 (if 90 holds)
with SL kept at 70 (closing basis). Traders are advised not to wait for the final 99 target but with (10/20% only)—booking profits earlier around 80–90% of each TP zone is a safer and more disciplined approach if the breakout remains valid.

MWMP – Demand Zone ReversalMWMP – Technical Rebound Outlook
MWMP has shown a strong rebound from the key 61.8% Fibonacci retracement zone (82–76), indicating solid demand absorption after a sharp decline. This reaction suggests a potential short-term recovery toward the 50% Fibonacci level at 107, followed by the 38.2% level at 122, while the major downtrend resistance near 130 remains the critical ceiling. As long as the price holds above 76 on a closing basis, buyers retain control; however, a breakdown below this zone would invalidate the setup and expose the stock to further downside toward the 78.6% retracement at 70.46.
Disclaimer: This analysis is for educational and research purposes only. It is not financial advice. Trade based on your own risk tolerance.

International Industries Limited (INIL) – Double Bottom Bullish INIL has formed a double bottom pattern around the 180 support level, indicating a potential bullish reversal. While the volume is not very strong yet and RSI is still around 38, the price structure suggests a breakout could confirm soon — possibly in upcoming sessions. 📈
Setup Details:
• Entry Options:
– Sniper entry at CMP for small SL ⚡
– or Buy after breakout confirmation ✅
• Stop-Loss (both entries): 175.50 ❌
Targets:
• Short-term: 196, 210, 221.50, 230.69 🎯
• Long-term double bottom target: 243.84 🏆
Note: Momentum structure is positive, but some patience is necessary.
⚠️ Key Fundamental Concerns:
• EPS negative / declining
• High short-term debt
• ROE relatively low
These factors make the trade technically valid but carry higher risk, so proper risk management is essential.

International Steels Limited (ISL) – Bullish Setup Price has made a strong rebound from the Fibonacci golden zone, which was previously a resistance and has now turned into solid support. The price has moved above the MA200 moving average, and RSI is climbing above 52, indicating powerful bullish momentum. 📈🔥
Trade Details:
• Entry 1: 96 (Current Market Price) 🎯
• Entry 2: 90 (Pullback Opportunity) 🔄
Risk Management:
• Stop Loss: 86 ❌
Take Profit Targets:
• TP1: 110 (First resistance level) 🥅
• TP2: 118 (Next resistance zone) 🥅
• TP3: 128 (Major resistance level) 🏆
This setup offers a well-balanced risk-reward and presents a promising swing trading opportunity. Keep a close watch on the momentum! 👀💪

PAEL - Technical Outlook PAEL is showing a potential breakout above a long-term descending resistance trendline, supported by increased volume and a firm base on the ascending trendline near 52. A sustained move above 54 could signal a strong bullish continuation with clearly defined targets:
• TP1: 56.03
• TP2: 57.82
• TP3: 60.20
• TP4: 62.63
Stop-loss is recommended at 51.30 to protect against false breakouts. Momentum indicators support a cautiously optimistic outlook.

IMAGE - Technical Outlook 📈 Price has shown a decisive rebound from the long-term ascending trendline and is now challenging a key breakout zone. Structural momentum is improving, and the setup favors continuation if price sustains above the breakout level (MA200 + trendline). Breakout validity will strengthen further if rising volume supports the move.
A swing setup is in play with clearly defined targets:”
• 🎯 TP1 — 27.50
• 🎯 TP2 — 29.60
• 🎯 TP3 — 31.70
🛡️ Stop-Loss — 22.40 (if breakout fails)

GAL Technical Analysis: Bullish Setup in PlayGAL (Ghandhara Automobiles Limited)
Price is trading above the 89 Fibonacci EMA, a level it has historically respected, confirming the overall bullish trend. It is also moving above the upward trendline and recently respected horizontal support since August. Stop loss can be placed aggressively below the horizontal support and 89 EMA on closing basis, or conservatively just below the trendline.
Price has broken out of an ascending triangle, and RSI is in sync with the move, adding further confirmation. The first target aligns with the all-time high, while the second target corresponds to the D point of the AB=CD harmonic pattern. A trailing stop is recommended to ride the trend beyond these levels.
Fundamentals: GAL is a strong company, showing positive revenue growth, operating income, net income, and EPS over recent quarters.
Recommended Levels:
Buy: 560.5 (CMP)
Stop Loss: Closing below 530
Take Profit 1: 620
Take Profit 2: 700
Take Profit 3: Ride the trend with a trailing stop
Potential upside remains as long as price sustains above 89 EMA and upward trendline. Happy trading!

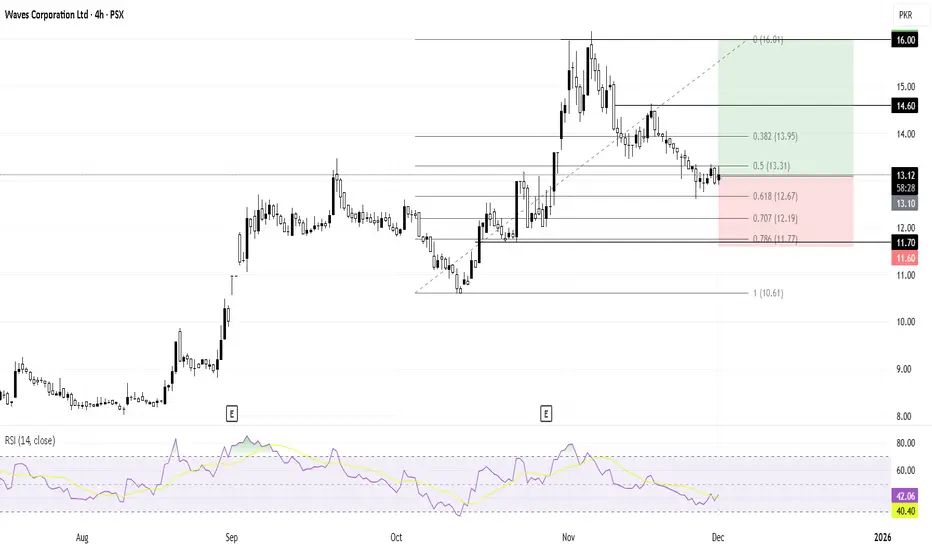
WAVES Golden Ratio Support SetupWAVES has retraced to the 0.618 Fibonacci golden ratio on the daily timeframe, which is considered a strong support area. A buy can be made at the current market price, with a stop loss below the last support and take profit around the previous highs.
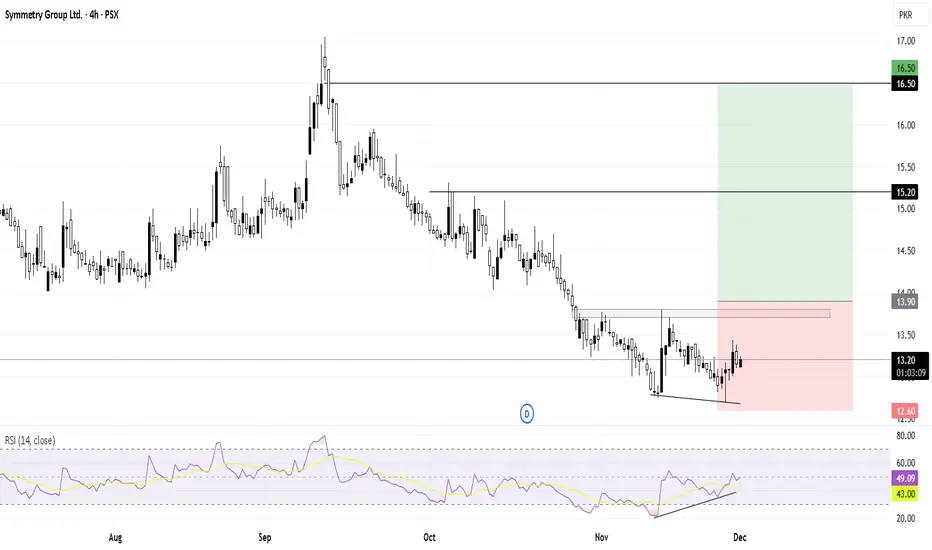
SYM Double Bottom Reversal SetupSYM has formed a double bottom along with bullish divergence , indicating a potential trend reversal. Confirmation will come on the breakout of the last supply zone. A stop loss can be placed below the last low, with take profit around the previous high.
HUBC – Short-Term Bullish SetupThe price is consolidating in the 217–221 zone and attempting a breakout.
RSI remains above 60 and the price is trading above the 50-day MA, indicating
bullish momentum.
Buying Zones: 217–221 (CMP), and around 210 on dips.
Stop-Loss: 205 (Closing Basis)
Targets: 239 / 250
Long-term structure also remains positive; dips can be considered for accumulation.

SYS — Swing Trade SetupSystem Price is showing strong bullish momentum after holding the key support zone around 146–152 PKR.
The recent volume spike and RSI moving above 60 confirm positive momentum.
Ideal buying zone: Between CMP 156.39 and 152 PKR.
Stop Loss (SL): 145 PKR (closing basis) to protect downside risk.
Targets (TP):
• 165 PKR (first target)
• 171 PKR (second target)
• 180 PKR (extended target)
Structure favors continuation as long as the price stays above SL zone. Good swing trading opportunity with clear risk-reward levels.

ENGROH — Technical OutlookThe price gave an initial bounce due to RSI bullish divergence, indicating buying interest.
A clear Cup & Handle formation is developing in the long term, which is a strong continuation pattern with a target of 365 PKR.
In the short term, even if we ignore the handle, a Double Bottom formation is confirmed with a target of 260 PKR.
Short-term stop loss (SL): 208 PKR (closing basis).
For confirmation of the higher target, a daily close above the handle is necessary.
Volume support and RSI momentum validate the pattern.
Targets:
• 260 PKR (Short-term Double Bottom)
• 365 PKR (Long-term Cup & Handle)
Support Zone: Near the handle base at current levels.
Note: If you are a long-term investor, adding on dips is the best strategy to target 365 PKR.

PREMA — Technical OutlookPrice is holding at its long-term key support zone, a level that has historically produced strong reactions.
On the daily timeframe, an RSI bullish divergence is active, which confirmed the bounce seen on Thursday.
Key Level:
• 42 — A daily close above this level will open the door for bullish continuation.
Targets:
• 46 (initial target)
• Further upside is possible if price sustains above 42.
SL: 36 (Closing basis)
Structure continues to maintain a support-driven bullish bias.

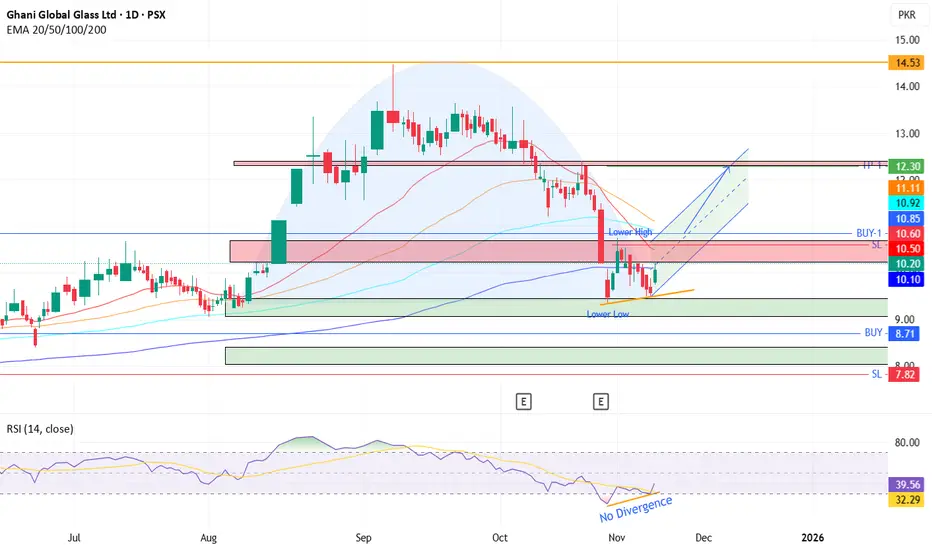
GGGL- PSX - Technical AnalysisOn daily time frame, GGGL has made an inverted Cup and now Handle is likely in the making as drawn.
On RSI there is NO bullish divergence. Hence price going up from the support level which can even continue down wards after a few days. Moreover, there is a resistance channel just above whereby price can be pushed down.
Technically, very correct entry is at BUY-1, after crossing the previous Lower High with TP around 12.30 and SL 10.60.