BECO – Weekly | Bearish Divergence + Golden Zone Support TestPrice has formed Higher Highs while RSI has formed Lower Highs — a textbook bearish divergence indicating weakening momentum.
The Fibonacci Golden Zone (4.94–4.01) aligns with a major structural support cluster.
This zone will likely decide the next trend direction.
Holding this zone may trigger continuation to the upside, while a breakdown from this area could lead to a deeper correction.
Key Levels:
• Resistance: 8.85
• Supports: 5.00 – 4.60 – 4.00
• Bearish divergence active
• Volume weakening near highs
PSX

Octopus Digital is reacting strongly from a major sell-side liqOctopus Digital is reacting strongly from a major sell-side liquidity zone, showing early signs of accumulation after sweeping liquidity below 40. The price has reclaimed the zone and is now pushing upward, with a clean upside path toward the 56 area, offering nearly 30% upside if momentum sustains. Risk remains defined below the liquidity sweep near 37.50, which acts as the invalidation level if price falls back into the zone.
Disclaimer: This is a brief technical overview for educational purposes only and not financial advice. Always conduct your own research before trading or investing.

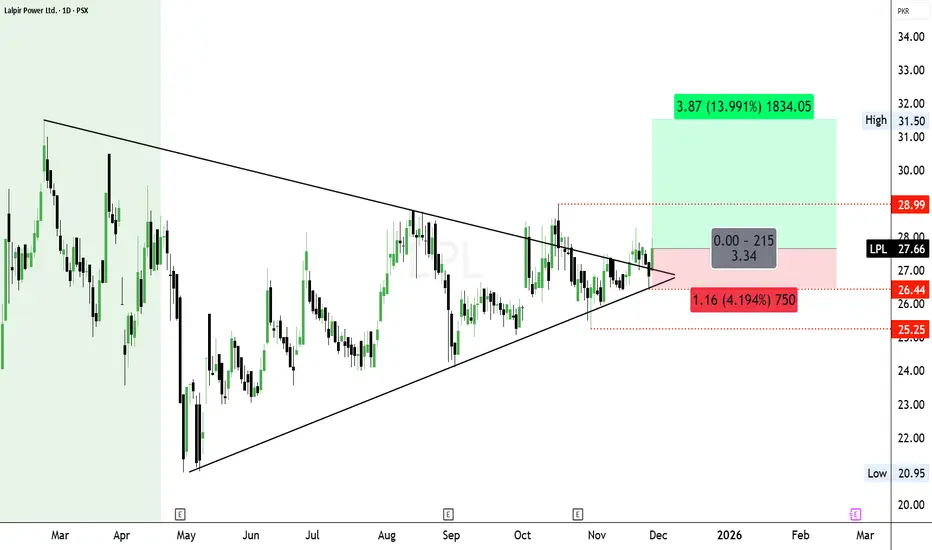
LPL - Breaking out from a tightening symmetrical triangleLPL is breaking out from a tightening symmetrical triangle, indicating growing bullish strength as price pushes above the resistance trendline. With momentum picking up, the chart shows room toward the upper target near 31.50, offering a potential upside of around 14%. A conservative stop is placed near 26.44–25.25 to manage risk in case the breakout doesn’t sustain.
Disclaimer: This is a brief technical view for educational purposes only and not financial advice. Always do your own research before making any investment decisions.
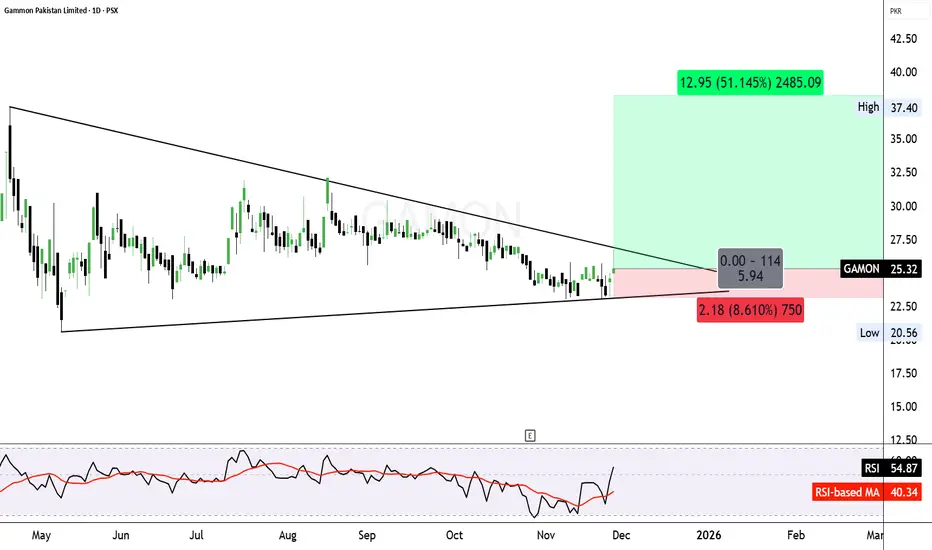
GAMON -Breaking Out Symmetrical TriangleGAMON is breaking out of a long symmetrical triangle on the daily chart, showing fresh bullish momentum as price moves above the upper trendline. With RSI also crossing above its moving average, momentum supports a potential move toward the projected target near 37.40, offering strong upside potential. A protective stop near 23.14 keeps downside risk controlled if the breakout fails.
Disclaimer: This analysis is for educational purposes only and is not financial advice. Always conduct your own research before making any investment decisions.
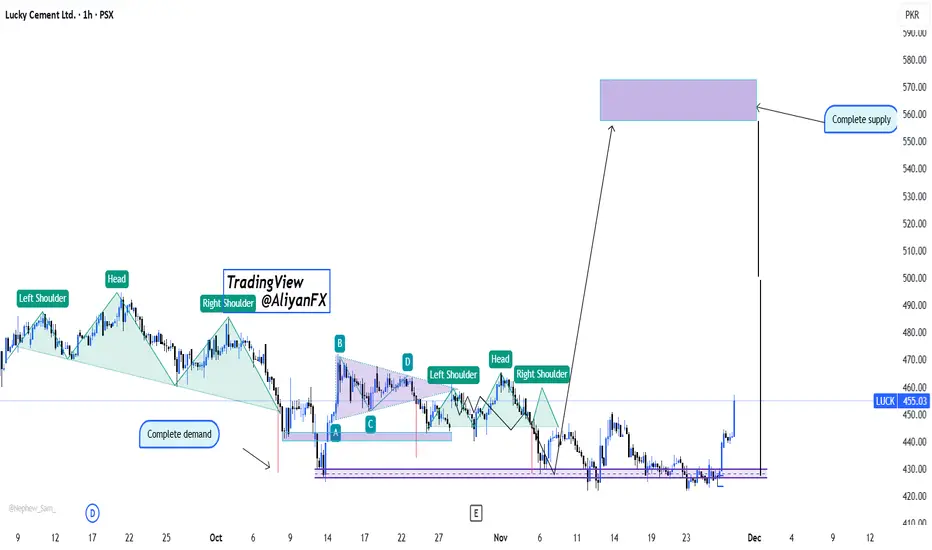
LUCK – Demand Completed|Reversal Patterns Targeting Supply ZoneLucky Cement (PSX: LUCK) has completed a series of bullish reversal structures after tapping into a major completed demand zone. Price has reacted strongly, confirming the possibility of a medium-term bullish leg toward the 560–575 PKR supply zone.
🔍 Key Technical Highlights:
🟢 Completed Demand Zone triggered a clean bullish reaction.
🧩 Multiple Inverse Head & Shoulders patterns forming across different price swings.
📉 Previous bearish leg has fully balanced its inefficiencies, enabling bullish continuation.
🟣 Major supply zone sits at 560–575, expected to be the next target for Smart Money.
⚡ Current momentum indicates strong institutional activity from discount pricing.
📈 Outlook:
If price holds above the 430–440 area, LUCK has high probability to continue upward with clean structure until the complete supply zone. Break of minor resistance levels will add confirmation for position traders.
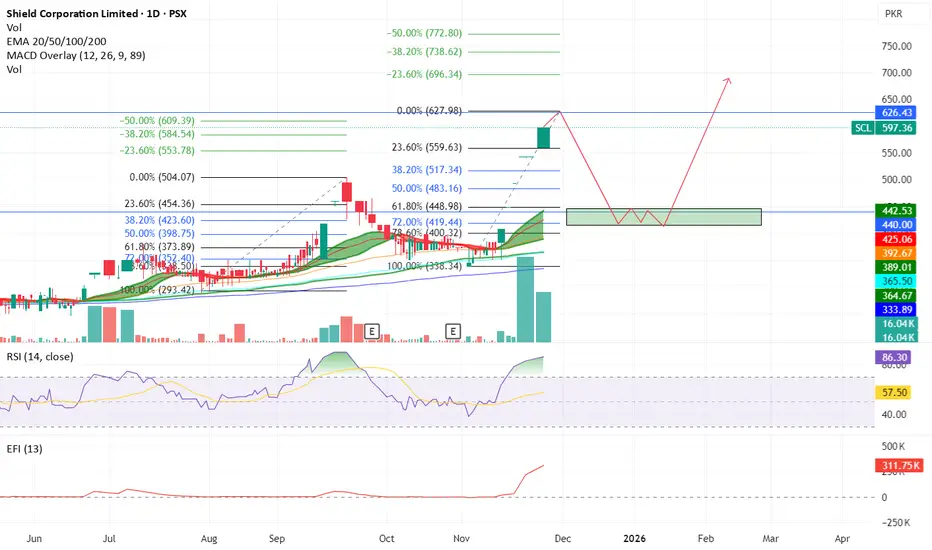
SCL - PSX - Technical AnalysisOn daily TF, price has been making cap after cap. Now volume has started to fall, therefore, it is expected that price will test 625~630 region and will drop sharply due to profit booking.
New entries should be avoided.
Then it is expected to drop around 425~440 region and will stay there for around 6 weeks before again going up.
Ideally buying should be initiated once price bounces back from 425~440 region and crosses 450. Then Target Price should be 620 and then 7690.
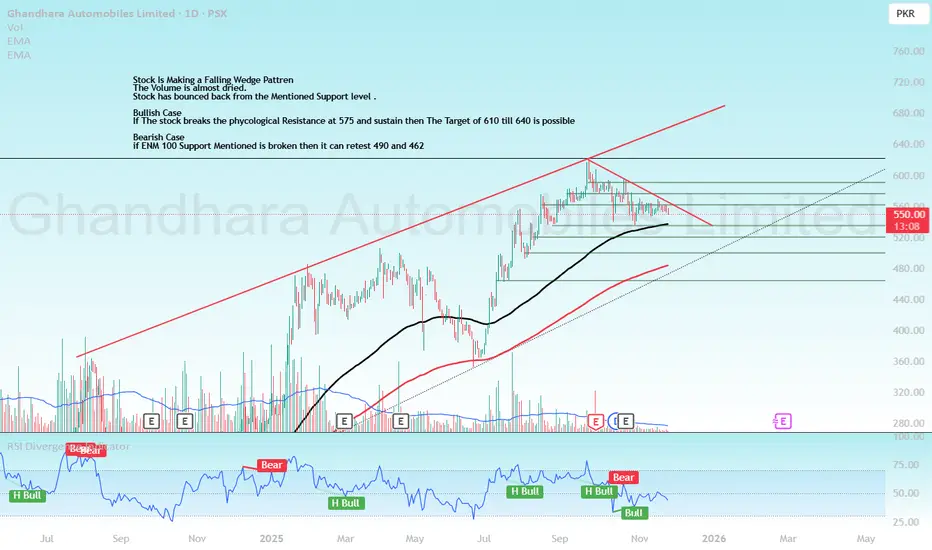
GAL Technical Analysis PSX , PakistanStock Is Making a Falling Wedge Pattren
The Volume is almost dried.
Stock has bounced back from the Mentioned Support level .
Bullish Case
If The stock breaks the phycological Resistance at 575 and sustain then The Target of 610 till 640 is possible
Bearish Case
if ENM 100 Support Mentioned is broken then it can retest 490 and 462
ARPL, 1D - Bullish divergence with volumes supportingARPL, 1D,
Bullish divergence with volumes supporting the move. Now RSI is also showing momentum.
Investment item (Enjoy Dividends too) :)
Arsalan Anwer
Stags

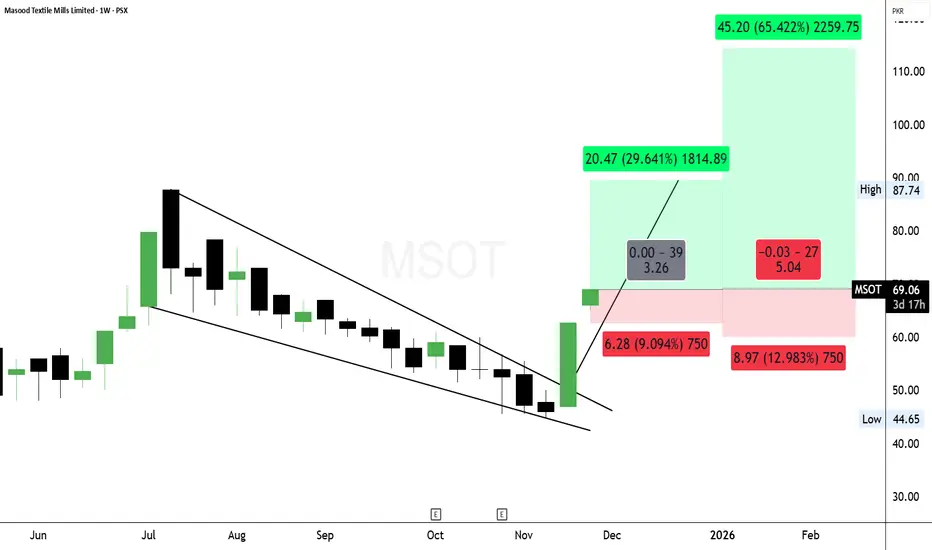
MSOT - Post Breakout Continuation; Targeting 88 - 114MSOT has broken out of a long falling wedge with strong volume. Price is now above key Fibonacci levels (50% & 61.8%), showing a clear trend reversal. Holding above 66 keeps momentum strong, with next resistance at 71. Above that, upside opens toward 88–114. SL below 61.
This is not financial advice. All stock market investments carry risk. Always conduct your own research and consult a licensed financial advisor before acting on any analysis.
AMTEX Supply Retest SetupAMTEX has broken its supply zone and is now pulling back to retest it, lining up with the 0.5 Fibonacci level . A buy can be initiated here, with a second entry planned around 4.9 , which aligns with the breakout level and the 0.618 Fibonacci golden ratio . Profit targets can be set toward the last high.

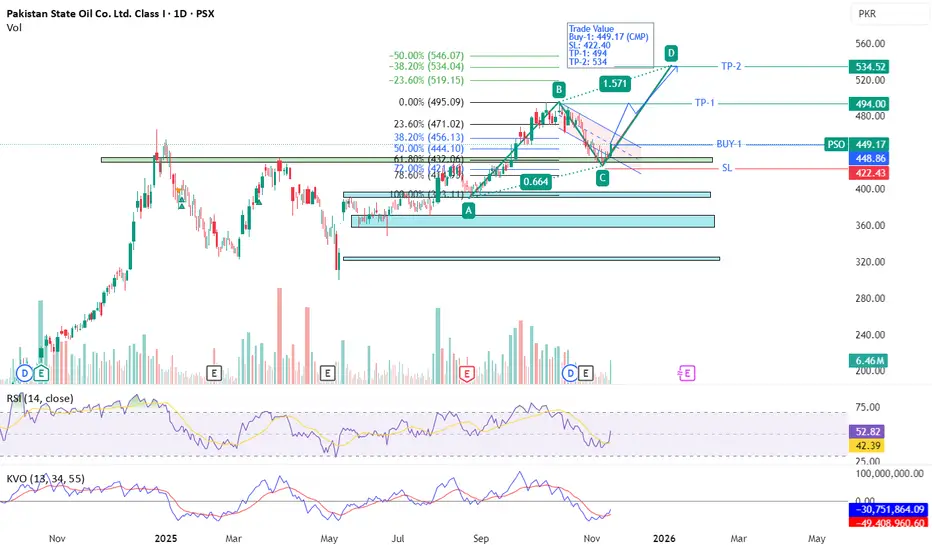
PSO - PSX - Technical Analysis AB=CDOn daily TF, PSO has retraced to Fib 62% and then went up after staying there for a few days. Closing of a Green Candle with volumes indicates that Buyers are active now. Also noted that KVO trigger line (Blue) has just crossed over the Signal line (red) indicating interest of Buyers although it is yet below zero level but its direction seems quite vertical. Also RSI is also moving up very sharply and still it has room to move up quote a bit. AB=CD pattern has been drawn to arrive to the TP.
Trade Value
Buy-1: 449.17 (CMP)
SL: 422.40
TP-1: 494
TP-2: 534
BECO - PSX - 4H Technical AnalysisBECO on 4H time frame, is moving in a parallel channel making HHs and HLs. At the moment it seems as if it is going to make HL at 6.95 before going up again in the channel to make at HH. Therefore, ideally one can get in to Buying on seeing a 4H Green Candle closing after price would have already retraced to 6.93~6.97 zone. TP should then be 8.50 with SL 6.80.
On the other hand If price continues to go down below the parallel channel, as divergence on Volumes as well as on RSI is observed, then it may bounce at Fib level 38% or 50% or 61%. This will give even better opportunity for getting into the trade.
Since BECO's this bull run is phenomenal therefore, I expect that price will drop to Fib 50% level at least. Double bottom at Fib 50% will be a sign of trend going back up and hence ideal time to get in to buying this SCRIPT. Even Fib 60% can be possible.

PSOPSO has bounced strongly from the 430–440 support with RSI turning upward, signalling renewed momentum. On the weekly timeframe, the structure has formed a classic Cup & Handle, adding confluence to the bullish bias.
Upside Targets: 494, 522, 560, 614
Bias remains bullish as long as price holds above 435–440.

HINOHINO PAK PSX buy for mid to long term
NOTE: Not a trade Plan buy for mid to long term (accumulate on support)
Further update for will provided on 26/27 Nov 2025
📉TECH:
Currently In accumulation phase previously it took 123 days from top HH to HL then made upward move and made another HH.
Currently it has complted 113 days , and we are assuming it move up next few days
📍 Accumulation Areas → we acuumulted it on 470 to 505
⚡ If Support Breaks: Next attractive Buy Zone →475, 455,
360–390(if PSX market goes down)
FUND:
Strengths: Revenue growth is very strong recently, interest coverage is good, leverage is low.
How ever strong EPS growth company turnaround story.
Deals in busses & trucks
🚌 Buses & Trucks: Orders surged 80% 🚀

BFAGROBUY Call BFAGRO
Trend line breake with volume and bullish news Barkat Frisian Agro Ltd
🚀 Barkat Frisian Agro Ltd (PSX: BFAGRO) – BUY CALL
📣 Bullish Fundamental Update – Fresh Catalyst Alert
Barkat Frisian has officially established its wholly-owned UAE subsidiary in the **Meydan Freezone, Dubai
Because the company is:
Expanding internationally
Increasing exports
Creating a base in UAE (a major business hub)
Seeking higher sales
Strengthening its brand
Enhancing long-term profitability

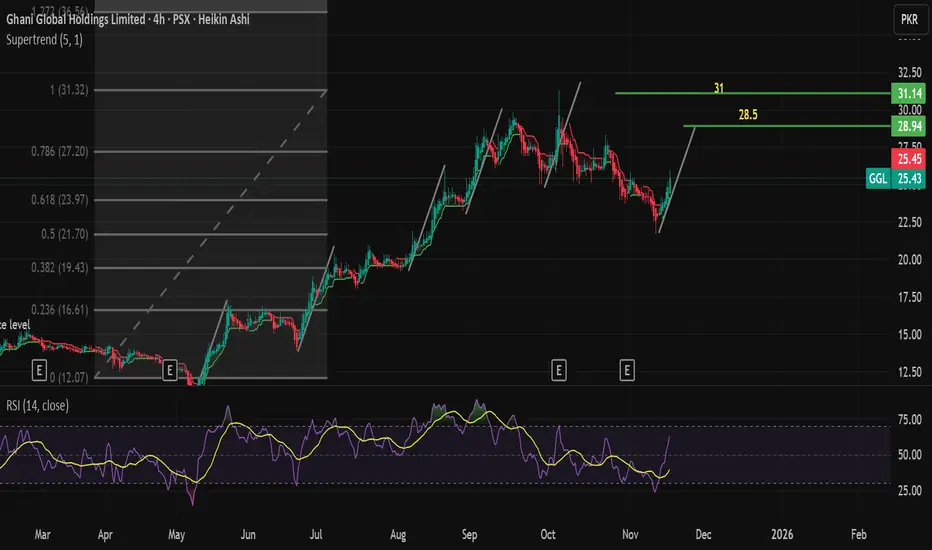
GGLGGL bouncing strongly from the 0.618 retracement zone. Structure remains bullish as long as 23 holds. Momentum turning up with RSI recovery — next upside targets sit at 28.5 and 31.
PSO possible short trade setupUpon the basis of monthly range,
This can be a good short setup idea.
Only one confirmation is required more which will make it high probability A+ setup.
The candle body close below 429 before further retracement.
We can expect this setup on coming Tuesday or Wednesday

PSX - Cement Sector ComparissionOn Daily TF, price increase percentage of cement sector has been plotted wef 01 Oct 2025 till date 04 Nov 2025.
Top performers are:-
FECTC: 40.03% gain
THCCL: 26.50% gain
FLYNG: 14.39% gain
Rest all are in negative.
Both FECTC and THCCL are poised to go even further up. However, THCCL is facing a very strong resistance at top and once this resistance will break then we will see sharp increase in its share price. On the other-hand, FECTC is on a roll with cap after cap. Its TP for first profit booking is around 170~178 mark and that is expected in next week.

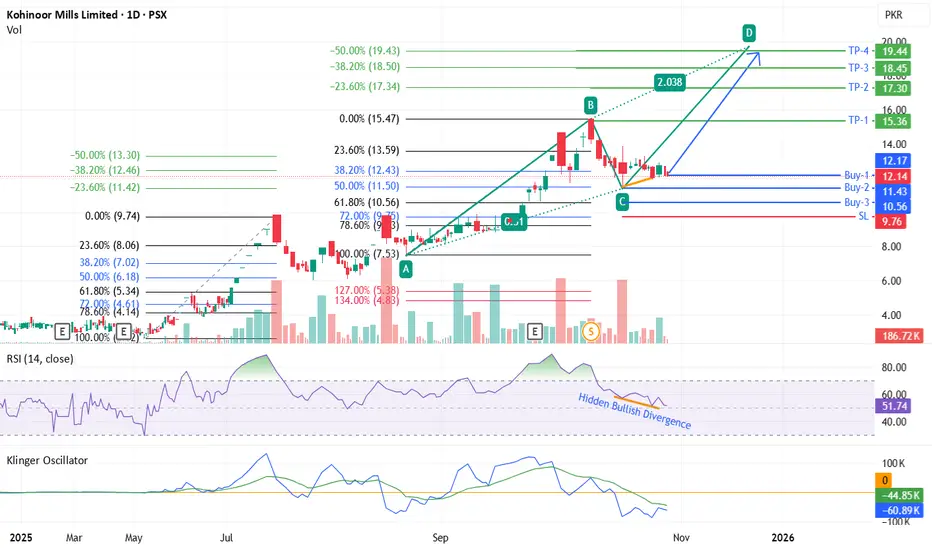
KML - Daily TF, Technical AnalysisKML after the 10/1 split share price dropped from PKR 146.77 to 14.67 and then it continued its price drop due to profit booking. Historically, this SCRIP retraces to 50% Fib level before starting its next run for HH.
At present, the price after retracing to 50% Fib level is almost maintaining 38~42% for the last 2 weeks consolidation. It may take even 1 to 2 weeks for once again going upwards but you never know it may go up even in one day as hidden bullish divergence has been observed on RSI. KVO is below zero level but its signal line (blue) is almost parallel to Klinger oscillator (green), suggesting slow transition but both lines are very close as well, therefore, any good news or bad news will give its immediate results.
For trade consider buying at levels mentioned on the chart.
ABCD harmonic pattern has been plotted to arrive to the TP-4.
GAL Head & Shoulders Breakdown Ahead? | Smart Money Targeting FAThe Ghandhara Automobiles Limited (PSX: GAL) chart is showing a clear Head and Shoulders reversal pattern at the top of a long-term ascending channel — hinting at potential bearish movement before any new bullish cycle begins.
📊 Technical Insights:
🧩 Head & Shoulders Pattern signaling trend exhaustion.
🟪 IMB Zone (Imbalance) yet to be fully mitigated — price likely to rebalance before continuation.
🔻 Fundamental Area around 400–420 PKR could act as a major demand zone for Smart Money accumulation.
🟢 Long-term channel still intact, suggesting possible rebound after discount pricing.
💡 Outlook:
Expect short-term bearish pressure targeting the IMB and Fundamental Zone before the next potential bullish leg. Patience and confirmation at the lower levels will be key for investors and SMC traders.

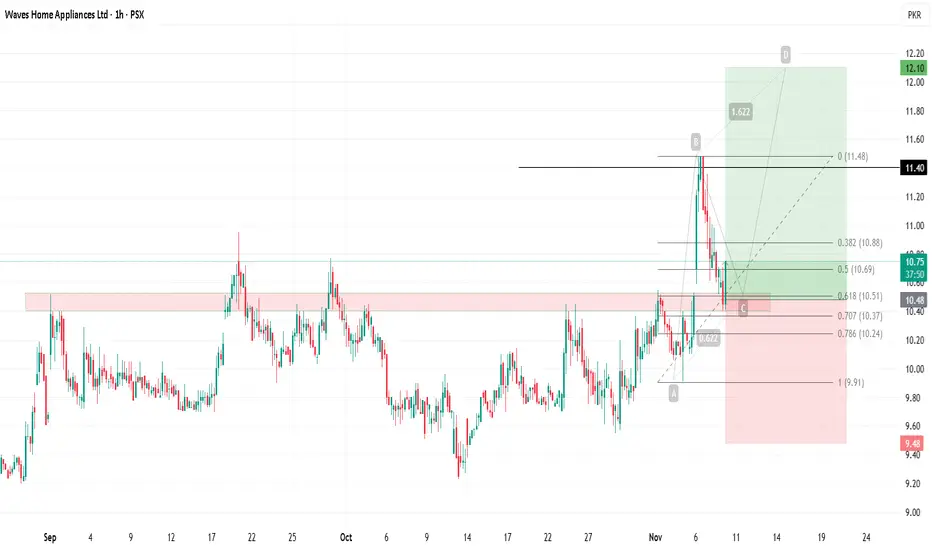
WAVESAPP Supply Zone Breakout SetupWAVESAPP has broken above its supply zone and is currently retesting it, aligning with the 0.618 Fibonacci golden ratio. A buy can be taken at the current market price, with a stop loss below the last low, TP1 around the previous high, and TP2 around 12.
HUBC – Smart Money Retracement Setup| Liquidity GrabThe HUB Power Co. Ltd (PSX: HUBC) chart is developing a clean Smart Money Concept (SMC) structure — showing signs of a short-term liquidity sweep before a strong bullish continuation.
📊 Market Insights:
🔹 Equal Lows / Liquidity Zone (SSS) forming near key support
🟪 Expecting short-term pullback to sweep liquidity around 160–170 zone
🟡 Order Block (OB) remains unmitigated — potential re-entry area for Smart Money
🔻 Bearish retracement before a strong bullish reversal
🎯 Long-term target zone around 280+ levels
💡 Smart Money Outlook:
Price may first hunt liquidity below current structure to tap into discounted OB, then shift momentum bullish for the next impulsive leg up.

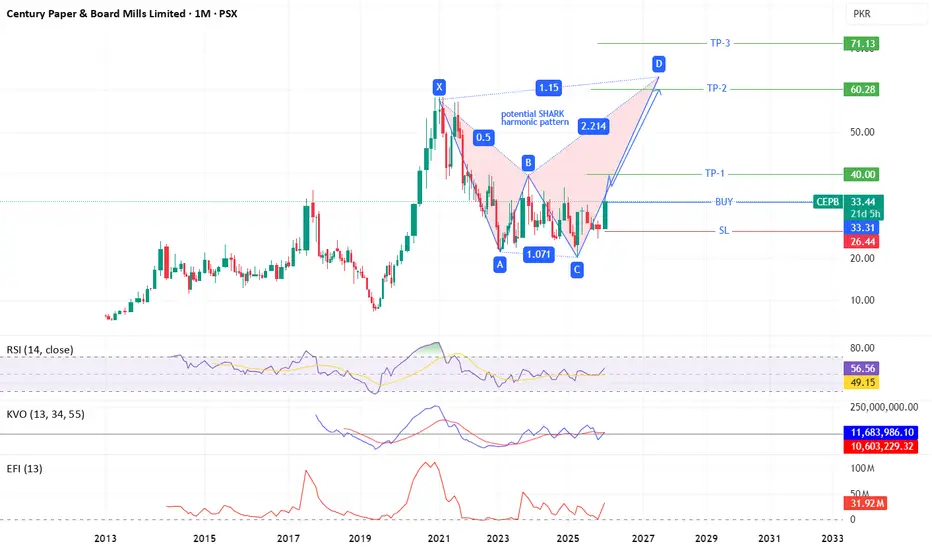
CEPB - PSX - Monthly Technical AnalysisOn monthly TF, potential SHARK harmonic pattern has been drawn.
It is expected to test TP-1 (40) and after retracing a bit will go up to test ATH (TP-2).
Trade values are marked on the chart