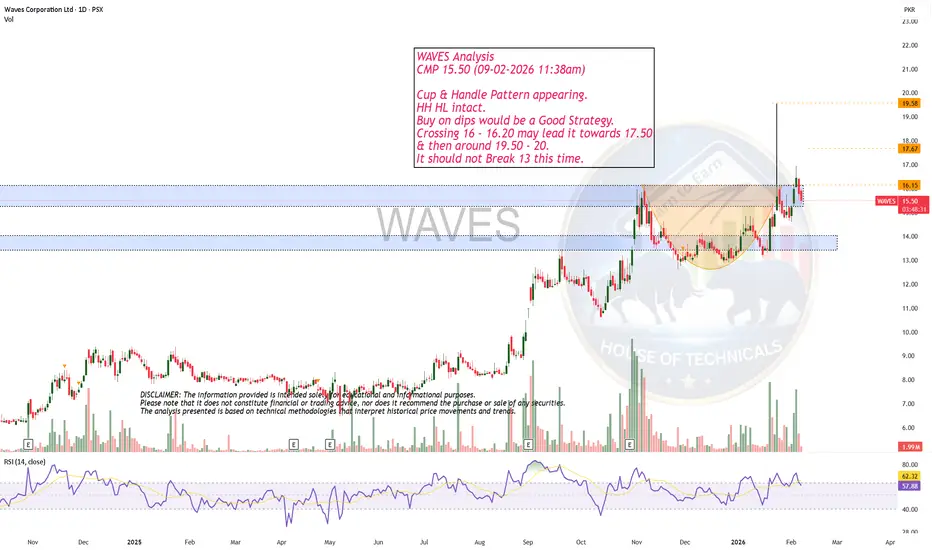
Strong Setup!WAVES Analysis
CMP 15.50 (09-02-2026 11:38am)
Cup & Handle Pattern appearing.
HH HL intact.
Buy on dips would be a Good Strategy.
Crossing 16 - 16.20 may lead it towards 17.50
& then around 19.50 - 20.
It should not Break 13 this time.
Psxlong
Good Consolidation Zone.ANL Analysis
CMP 12.60 (09-02-2026)
Good Consolidation Zone.
Crossing 13.50 with Good Volumes may lead it towards 15 - 15.50
& then 18.
Channel bottom is around 11 - 11.30.
However, it should not break 10 this time.

Ascending Triangle pattern.GLAXO Analysis
Closed at 427.50 (04-02-2026)
Ascending Triangle pattern.
Bullish on biggger tf.
Crossing 465 - 470 with huge volumes may trigger the
bullish pattern targeting 550 & then around 630 - 636.
On the flip side, 395 - 400 is an important Support zone.
Breaking 377 would bring more selling pressure.

Bullish on Bigger tf.TOMCL Analysis
Closed at 51.76 (04-02-2026)
Bullish on Bigger tf.
ABCD pattern appearing.
68 - 70 should be crossed with Good Volumes
& Sustained for the Point D Target.
Immediate Resistance is around 55.
On the flip side, Immediate Support levels are
around 50 & then around 45 - 46.

Beautiful Cup & Handle formation.MUGHAL Analysis
CMP 94.50 (04-02-2026 10:06am)
Beautiful Cup & Handle formation.
Crossing & Sustaining 107 - 115 may lead
it towards 150+
Immediate Support seems to be around 91 - 95
However, breaking 76 may bring more selling pressure.

Continuously making HH HL.DCR Analysis
Closed at 38.77 (03-02-2026)
Continuously making HH HL.
Currently at Important Support level around 37 - 38.
Sustaining this level may lead it towards 40 - 42.
ABCD pattern will trigger if 42 is crossed with Good
volumes & sustained, targeting 49 - 50.

Beautifully making HH HL. FATIMA
Closed at 169.12(29-01-2026)
Beautifully making HH HL.
Possibility of re-testing the Breakout Level
around 157 - 160 & print HL.
Crossing 187 - 188 may lead it towards 199 - 200
& then around 213 - 215.
It should not break 143 now.

Now at Important Level!30-01-2026
Bearish Div. played well & brought the
price down towards 185 - 186.
Now this level is important.
Sustaining this will confirm HL & upside
targets can be around 230+

Around Good Support!ENGROH Analysis
CMP 261.75 (30-01-2026 10:41am)
Currently around Strong Support Zone (255 - 260)
Upside it has the potential to touch 300 & then 320.
However, if the 250 is broken, next Support seems to
be around 228 - 231.

Bullish Flag Pattern appearing.MLCF analysis
Closed at 113.52 (29-01-2026)
Bullish Flag Pattern appearing.
Crossing 130 with Good Volumes may lead it towards
New Highs targeting around 160+
However, for Fresh Entry, wait for the Green Candles in
the range of 106 - 112.

HL is still intact around 581.FFC Analysis
CMP 596.62 & Lower Locked (29-01-2026 02:54PM)
HL is still intact around 581.
If this breaks, next support is around 568 - 570
It may continue its uptrend after crossing 685.

Play on Levels!PAEL Analysis
Closed at 57.21 (28-01-2026)
Rising Wedge!
Shooting Star on Bigger tf appearing.
Monthly Closing Matters!
One positive point is a Morning Star formation on Monthly basis.
Immediate Support lies around 54.50 - 55.50.
a bounce is expected from this support.
Upside Resistance 64 - 65 can be touched again with mid way
resistance around 59 - 60.

BML Golden Ratio Support SetupBML has retraced to the 0.618 Fibonacci golden ratio, aligning with a strong daily support zone. A buy can be considered in this region, with a stop loss below the last low and profit targets around 7.5 and 10.

FFL Bullish ABCD Breakout Setup FFL has closed above its supply zone and is currently trading above it, suggesting the start of a new bullish leg. Based on the ABCD harmonic projection, the next leg could extend toward 27 rupees. A buy at the current market price is recommended, with a stop loss below the last demand zone.

BGL Accumulation Breakout SetupBGL has broken out of its accumulation zone and is now forming a higher low. A buy can be made at the current market price, with a stop loss below the last low and take profit target toward the recent highs.

WAVES Accumulation Breakout SetupWAVES has broken out of its accumulation zone and is now forming a higher low. A buy can be made at the current market price, with a stop loss below the last low and take profit targets toward the recent highs.

SLGL Golden Ratio Bounce SetupSLGL has broken its supply zone and continues to form higher highs and higher lows. The price is currently bouncing from the 0.618 Fibonacci golden ratio . A buy can be made at the current market price, with take profit around the last high and the ABCD projection , and a stop loss below the last higher low.

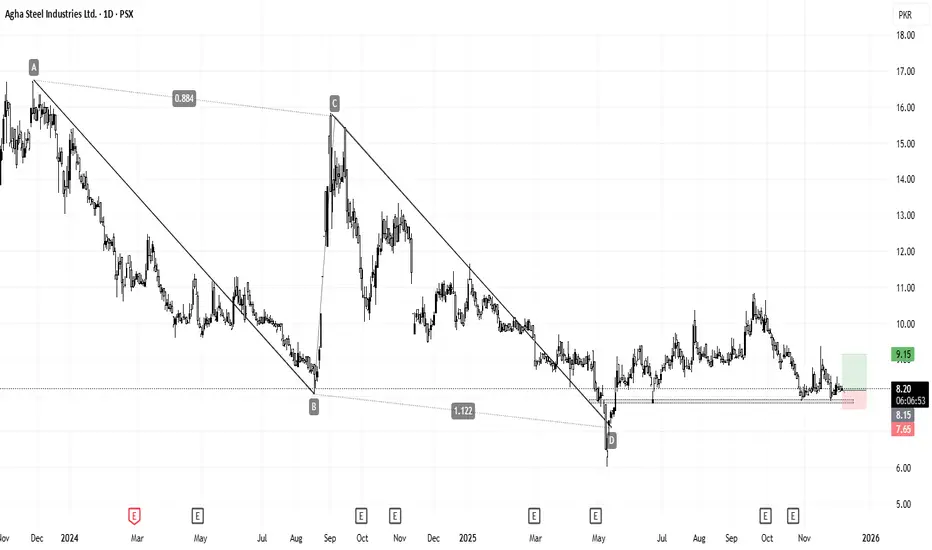
AGHA Potential Reversal Zone SetupAGHA is currently trading around its potential reversal zone , aligned with the ABCD projection . Strong accumulation suggests a possible upside move. A buy at the current market price is recommended, with a stop loss below the support area.
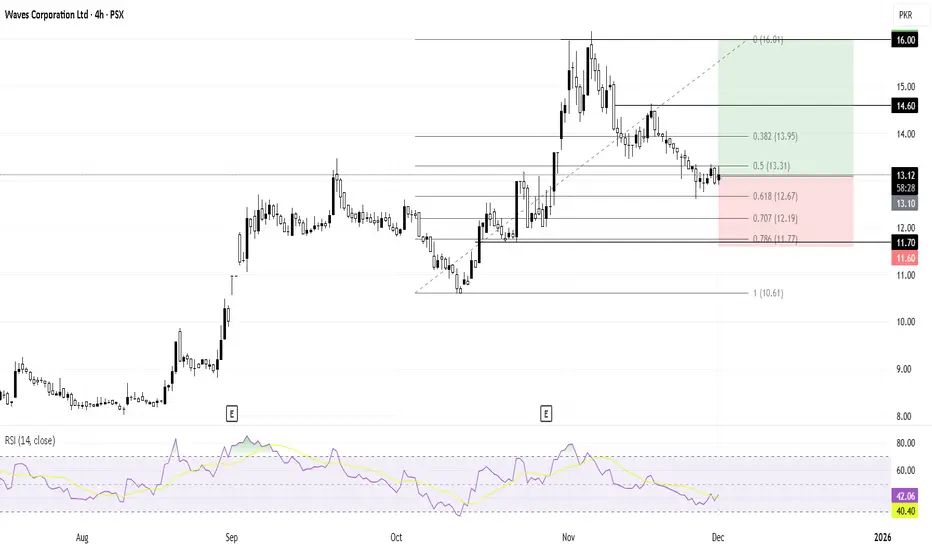
WAVES Golden Ratio Support SetupWAVES has retraced to the 0.618 Fibonacci golden ratio on the daily timeframe, which is considered a strong support area. A buy can be made at the current market price, with a stop loss below the last support and take profit around the previous highs.
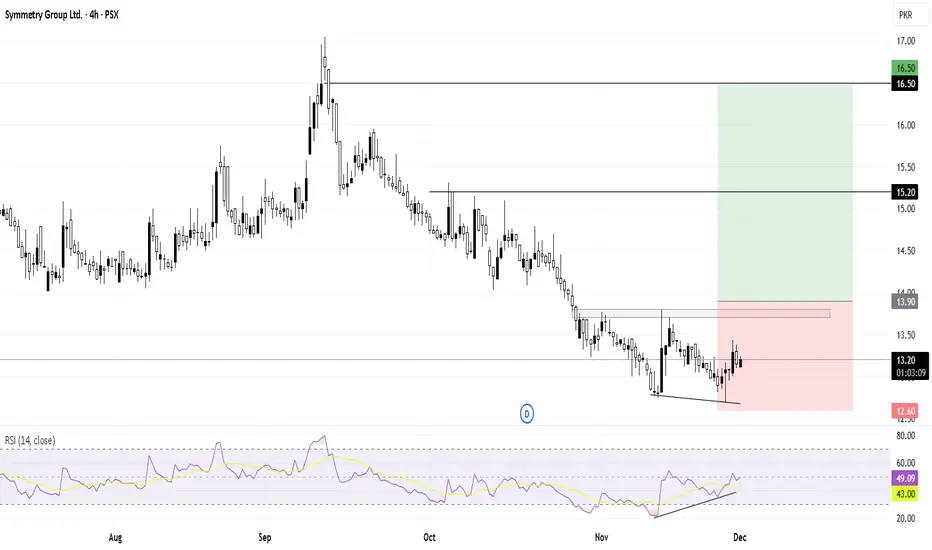
SYM Double Bottom Reversal SetupSYM has formed a double bottom along with bullish divergence , indicating a potential trend reversal. Confirmation will come on the breakout of the last supply zone. A stop loss can be placed below the last low, with take profit around the previous high.
AMTEX Supply Retest SetupAMTEX has broken its supply zone and is now pulling back to retest it, lining up with the 0.5 Fibonacci level . A buy can be initiated here, with a second entry planned around 4.9 , which aligns with the breakout level and the 0.618 Fibonacci golden ratio . Profit targets can be set toward the last high.

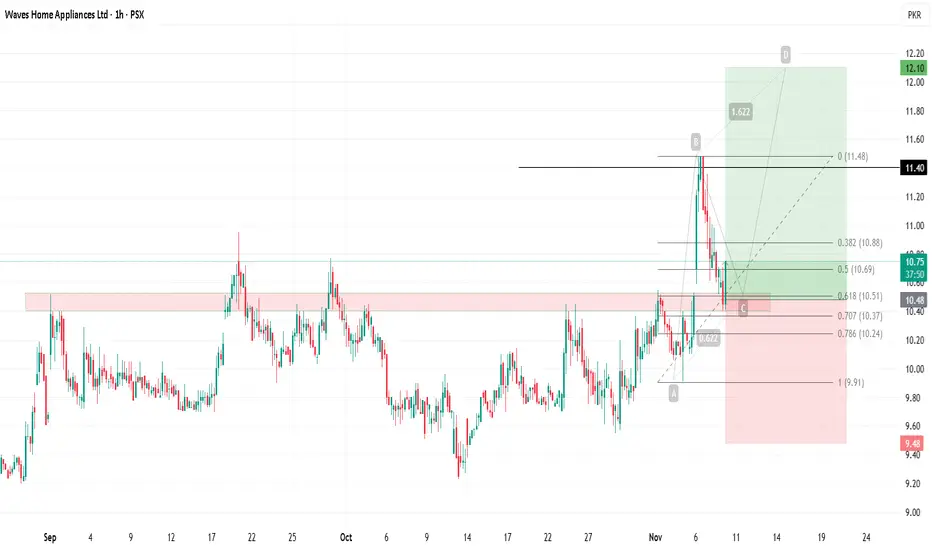
WAVESAPP Supply Zone Breakout SetupWAVESAPP has broken above its supply zone and is currently retesting it, aligning with the 0.618 Fibonacci golden ratio. A buy can be taken at the current market price, with a stop loss below the last low, TP1 around the previous high, and TP2 around 12.
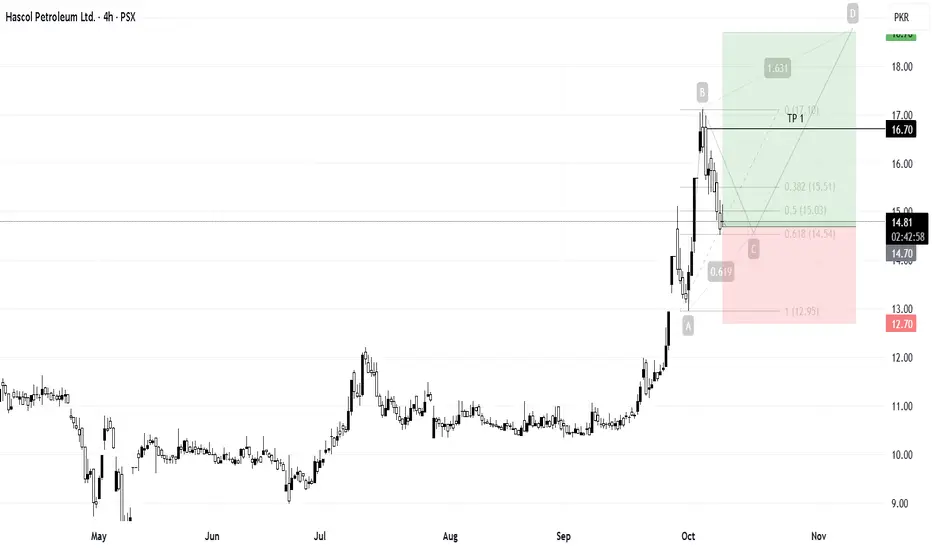
HASCOL Bullish Retracement SetupHASCOL has recently shown bullish momentum. After making a high, the price has retraced to the 0.618 Fibonacci golden ratio , presenting a potential buy opportunity at the current market price. A stop loss can be placed below the last low, with take profit targets around the last local high and the ABCD projection.