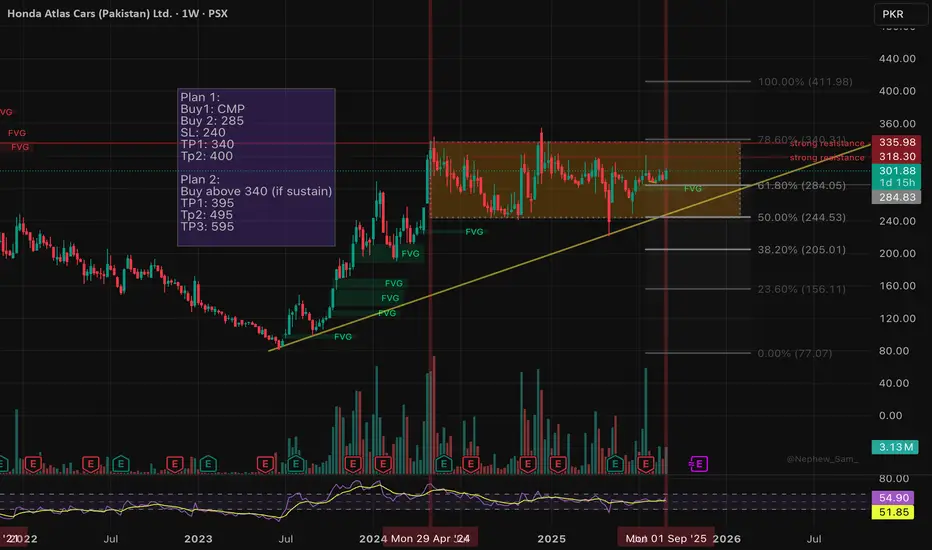
HCAR – Time Cycle Complete, Ready to Ride!The chart is showing strong accumulation with massive volumes, signaling smart money activity. Price has spent significant time in a sideways cycle, suggesting consolidation is now near completion.
🔑 Key Levels & Plans
Plan 1: Buy near CMP / 285 | SL: 240 | TP1: 340 | TP2: 400
Plan 2: Buy above 340 (on sustained breakout) | TP1: 395 | TP2: 495 | TP3: 595
⚠️ Caution: Strong resistance around 318–340. A breakout above this zone could trigger the next rally, but failure may lead to another pullback.
📌 Conclusion: Stock looks ready for a potential ride, but breakout confirmation is crucial before entering aggressively.
Psxlong
BBFL – Big Bird Foods Limited: Range Breakout SetupBBFL has been moving sideways for months, locked inside a consolidation box 🟧. Price is holding well above the key support zone and building energy for the next decisive move. A breakout above the range could open the door to strong upside momentum.
🔑 Key Levels:
CMP: 47.37
Support / Stop-loss: 44 🛡️
Range Resistance: 55.5 🚧
📌 Trading Plans:
Plan 1 (Aggressive):
Buy @CMP or on dips to 45.5
SL: 44 ❌
TP1: 52 🎯
TP2: 55 🎯
Plan 2 (Conservative):
Buy only above 55.5 on closing basis ✅
TP1: 63.7 🎯
TP2: 69.5 🎯
TP3: 77.7 🚀
⚡ BBFL is at a make-or-break zone. Holding above support keeps bulls in control, while a breakout above 55.5 could trigger the next rally.

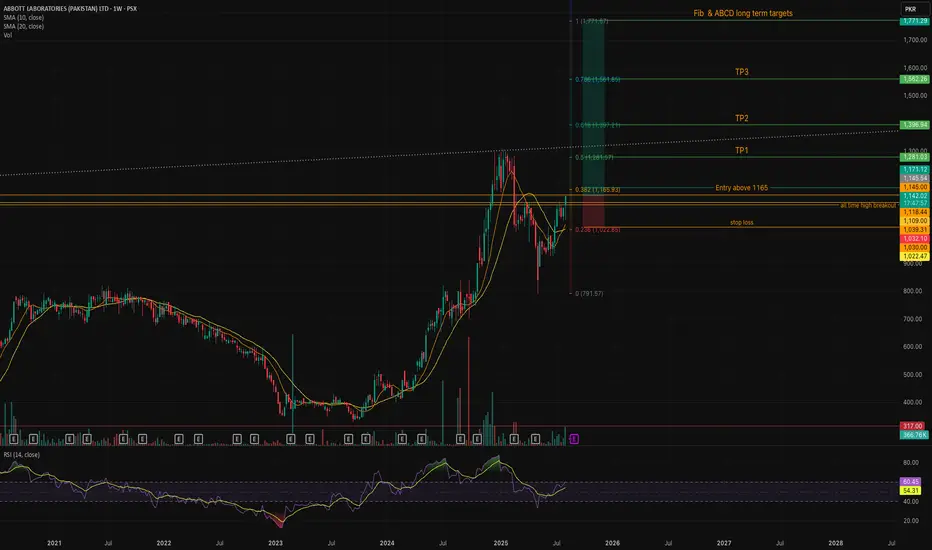
ABOT Weekly Technical Outlook – Long-Term Bullish Setup in PlayABOT has presented a compelling long-term bullish setup following a strong recovery and consolidation phase. Here's a technical breakdown:
🔍 Chart Overview (1W TF):
Entry Trigger: Confirmed breakout above PKR 1165, reclaiming the 0.382 Fibonacci level.
Stop Loss: Below key support zone near PKR 1022–1039, aligned with SMA 10 & 20.
Breakout Zone: ABOT is now retesting its previous all-time high zone between PKR 1145–1172, setting up for a potential continuation.
📐 Fibonacci & ABCD Projections – Long-Term Targets:
📌 TP1 (Fib 0.5): PKR 1281
📌 TP2 (Fib 0.618): PKR 1396
📌 TP3 (Fib 0.786): PKR 1562
🎯 Extended Target (Fib 1.0): PKR 1771
These levels align with a classic AB=CD harmonic projection, signaling potential for sustained upside over the coming months.
📈 Indicators Insight:
✅ SMA 10/20 crossover bullish; price now trades well above both.
✅ RSI (14) currently at 60.45, showing healthy momentum but still below overbought levels – room to run.
📊 Volume spikes on breakout candles confirm buyer interest.
💡 Strategy Summary:
📥 Buy Zone: Above PKR 1165
🛑 Stop Loss: Below PKR 1022
🎯 Targets: PKR 1281, 1396, 1562, and 1771
This is a textbook trend continuation setup following correction and consolidation. Keep a close watch on volume follow-through and strength above the breakout zone to confirm trend expansion.
Bullish on All Time Frames.MERIT Closed at 13.95 (13-06-2025)
Bullish on All Time Frames.
Immediate Support lies around 13 - 13.20 &
then around 12 - 12.20
However, 11 - 11.10 may be re-tested in extreme
pressure.
On the flip side, once 14.20 is Sustained, we may
witness upside towards 16 - 17 & then 19 -20

Another Possible Setup of Cup & Handle
Closed at 120538.01 (03-06-2025)
Another Possible Setup of Cup &
Handle is appearing on Top.
But still Resistance od 120660 - 120700
is there.
If crossed, 123000 is on the cards.
On the flip side, slight bearish divergence is
there on shorter tf, so dip can be a buying
opportunity.
Hoping for a Good Move Upside! Inshaa ALLAH!

Hidden Bullish Divergence will play?as mentioned during market
timings, 36.50 was important to
sustain. It could not and hit the
Lower Lock at 36.03
Next Support is around 34.50 - 34.62
Now it is Important to Sustain 36.50 - 36.70
on Weekly basis.
Monthly Support is around 35.
One +ve sign: Hidden bullish divergence has
also appeared.

PAEL SETUP ONCE AGAINPAEL is currently at its orderblock zone where the liquidity is resting if volumes come in at this level then we can expect a bounce again if the orderblock fails and there is no liquidity in OB then wait for downside levels and if the weekly ema 21 is broken then i see 30 level coming but still we will look into some more levels for now just focus on this orderblock
the previous supply is completed here

Cup & Handle Formation.Cup & Handle Formation.
170 - 174 is the Resistance Zone.
Targets can be around 200 - 205.
On the flip side, If 145 is broken,
we may witness further Selling Pressure.

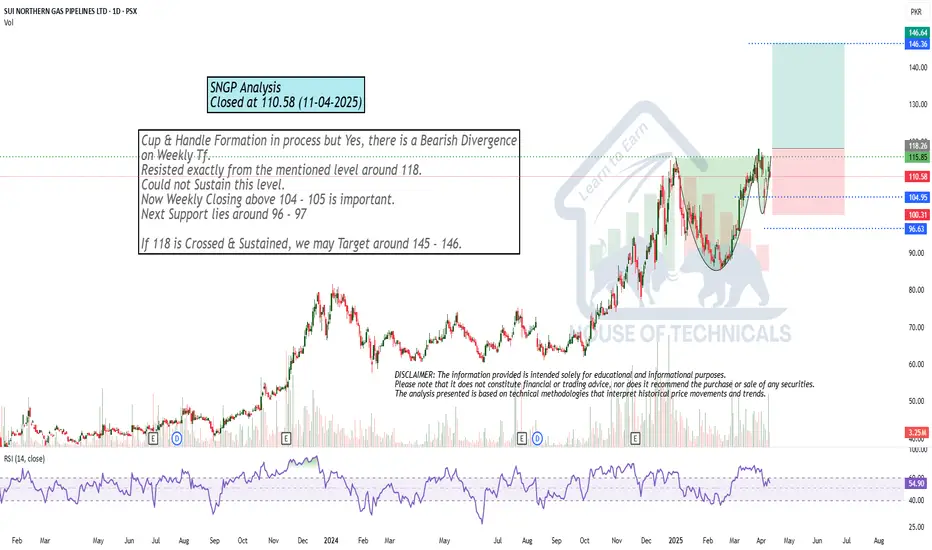
Cup & Handle Formation in process but Cup & Handle Formation in process but Yes, there is a Bearish Divergence
on Weekly Tf.
Resisted exactly from the mentioned level around 118.
Could not Sustain this level.
Now Weekly Closing above 104 - 105 is important.
Next Support lies around 96 - 97
If 118 is Crossed & Sustained, we may Target around 145 - 146.
FFL THE PERFECT SETUP REVIEW AS DEFINED FFL tested the same key levels which I find through secret price action and institutional order flows. I don't want to repeat you can just look at the chart and its beauty.

Bullish on All Time Frames.Bullish on All Time Frames.
Breakout above 46.50.
Already re-tested the Previous Breakout
around 38.
Immediate Support is around 42.50 - 44
Immediate Targets can be around 49 - 50
However, It has the potential to touch 59 - 60.
It should not Break 40 now.

Bullish on All Time Frames.Bullish on All Time Frames.
Crossing & Sustaining 208 will lead
it towards 260 - 265 & then 300+
Immediate Supports lies around 200 &
then around 183 - 187
Fresh Entry can be made once 208 is
Sustained.

Morning Star Formation on Weekly TF.Morning Star Formation on Weekly TF.
Strong Trendline Support around 9.40 - 9.50
However, Accumulation can be started from
Current Level (10 - 10.50);
Should not Break 8 (even in worst cases)
Upside Targets can be around 13 - 14 & then
16 -18

Bullish DivergenceBullish Divergence at a Support Level.
10.52 should be Sustained on Monthly Basis.

Systems Buy Idea!Systems has been accumulating for exactly the same time now as last time
if it breaks above 600-700 could be the final target

PSO:PSX Buy CallPSO printed a Bullish Divergence with a Falling wedge pattern suggesting a Bullish shift in momentum.
Market entry is suggested with Stop Loss on previous Lower Low. Take profit levels are recommended on 1:2 Risk Reward Ratio.
Happy Trading!

NRL:PSX Bullish RunNRL-PSX is expected to continue it's bullish run on daily timeframe. It printed a cup and handle pattern with no divergence.

GTYR-PSX: Bullish Continuation GTYR Printed a Bullish Flag with no signs of Divergence. A bullish trend continuation is expected, entry is suggested on the breakout of pole with stop loss on previous Higher Low.

PSO: Bearish Trend ShiftPSO:PSX printed a rising wedge pattern followed by a bearish divergence suggesting a Bearish Shift. Shorting is recommended as per the levels mentioned in the chart.

KSE 100 INDEX BUYas Pakistan stock exchange has given an access to this portal and my first analysis is on KSE 100 INDEX i see a potential buy setup to a Daily Resistance Level and the first confluence for this setup is a GAP UP opening on Monday which is buy Signal the 2nd confluence is 200 EMA which is below candles and shows that it will be a buy setup third confluence is formation of a hammer candle which also shows us a buy setup but as i know the political situations and Geo economical position of Pakistan any move could be possible if everything goes smooth we will buying this 100 index

PSX Inverse Head and ShouldersPSX has completed an inverse Head and Shoulders pattern but failed to breakout above the neckline. It's possible that this could be due to the imminent earnings report which will be released BMO on Friday. In my opinion investors - traders are waiting for this release before entering a long position. PSX is once again approaching the neckline area and a nice beat on Friday could be the catalyst that is needed to push the price above the neckline towards $100.
PSX has beaten the earnings estimates the last 5 quarters but looking at the chart, PSX typically does not seem to make huge moves one way or the other on earnings results. That being the case I still believe a nice beat on Friday could propel PSX toward the $100 area. I am currently long PSX but I am also waiting to see the earnings results before adding or reducing my position.
