BGL Accumulation Breakout SetupBGL has broken out of its accumulation zone and is now forming a higher low. A buy can be made at the current market price, with a stop loss below the last low and take profit target toward the recent highs.
Psxtrading

WAVES Accumulation Breakout SetupWAVES has broken out of its accumulation zone and is now forming a higher low. A buy can be made at the current market price, with a stop loss below the last low and take profit targets toward the recent highs.

SLGL Golden Ratio Bounce SetupSLGL has broken its supply zone and continues to form higher highs and higher lows. The price is currently bouncing from the 0.618 Fibonacci golden ratio . A buy can be made at the current market price, with take profit around the last high and the ABCD projection , and a stop loss below the last higher low.

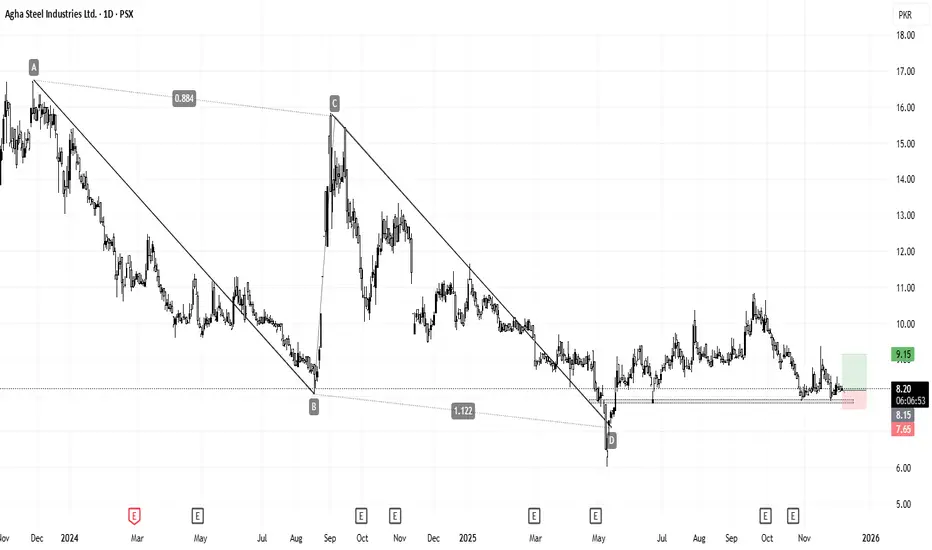
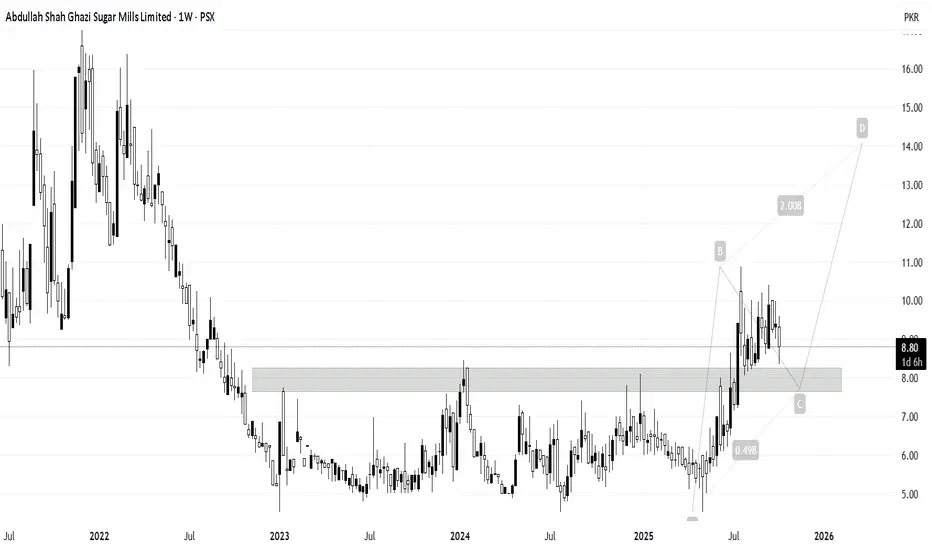
AGHA Potential Reversal Zone SetupAGHA is currently trading around its potential reversal zone , aligned with the ABCD projection . Strong accumulation suggests a possible upside move. A buy at the current market price is recommended, with a stop loss below the support area.
KSE-100 – Pullback Toward 164k Before Next Leg Up?The index is holding near the 166.2k short-term support, but current momentum suggests a deeper retracement is still on the table.
A dip toward the 164k zone remains likely, where strong confluences align:
🔹Fib Golden Zone (50–61.8%)
🔹Touch of the rising channel support
🔹Retest of the higher-timeframe breakout structure
If buyers defend the 164k region, the setup remains bullish toward 170k+ on the next impulse

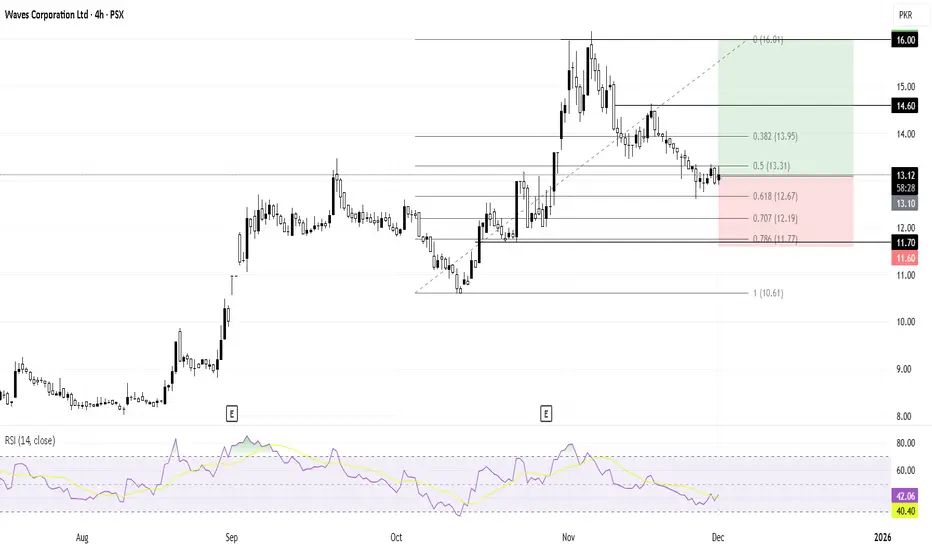
WAVES Golden Ratio Support SetupWAVES has retraced to the 0.618 Fibonacci golden ratio on the daily timeframe, which is considered a strong support area. A buy can be made at the current market price, with a stop loss below the last support and take profit around the previous highs.
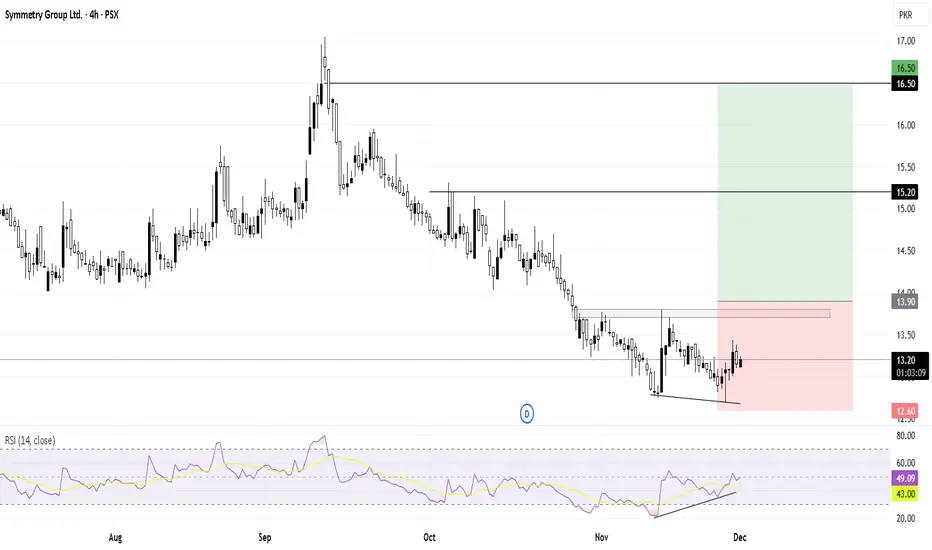
SYM Double Bottom Reversal SetupSYM has formed a double bottom along with bullish divergence , indicating a potential trend reversal. Confirmation will come on the breakout of the last supply zone. A stop loss can be placed below the last low, with take profit around the previous high.
AMTEX Supply Retest SetupAMTEX has broken its supply zone and is now pulling back to retest it, lining up with the 0.5 Fibonacci level . A buy can be initiated here, with a second entry planned around 4.9 , which aligns with the breakout level and the 0.618 Fibonacci golden ratio . Profit targets can be set toward the last high.

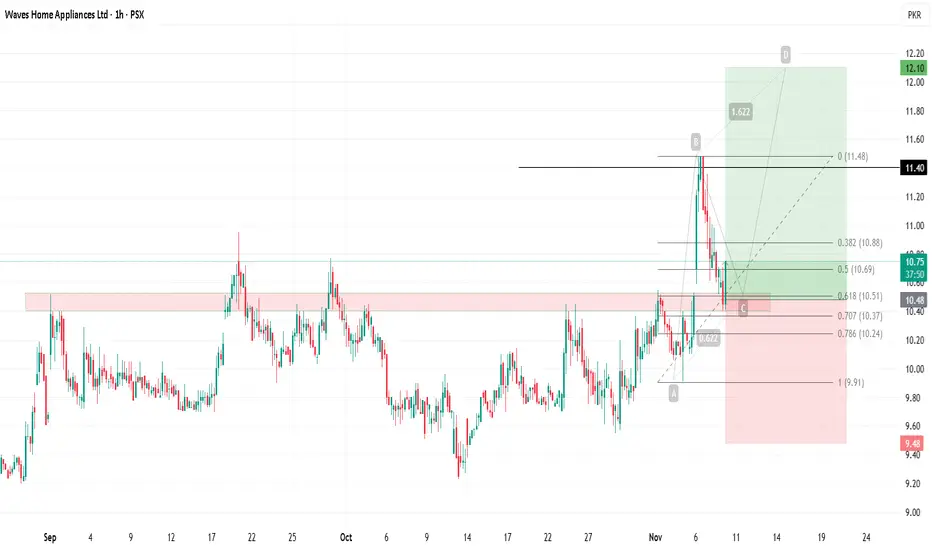
WAVESAPP Supply Zone Breakout SetupWAVESAPP has broken above its supply zone and is currently retesting it, aligning with the 0.618 Fibonacci golden ratio. A buy can be taken at the current market price, with a stop loss below the last low, TP1 around the previous high, and TP2 around 12.
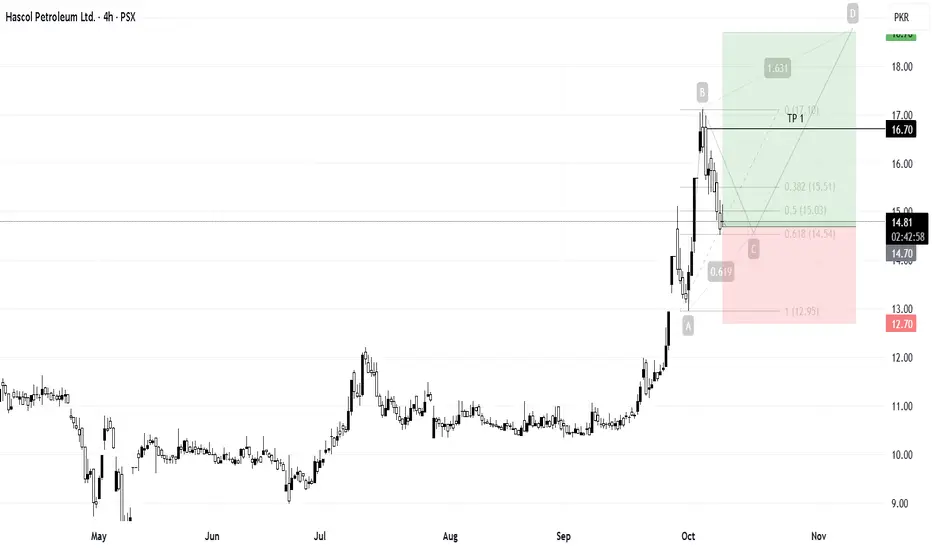
HASCOL Bullish Retracement SetupHASCOL has recently shown bullish momentum. After making a high, the price has retraced to the 0.618 Fibonacci golden ratio , presenting a potential buy opportunity at the current market price. A stop loss can be placed below the last low, with take profit targets around the last local high and the ABCD projection.
MTL Bullish Divergence SetupMTL has formed a bullish divergence on the daily timeframe. A buy can be attempted on the breakout of the last lower high, with a stop loss below the recent low and take profit (TP1) around the recent top.

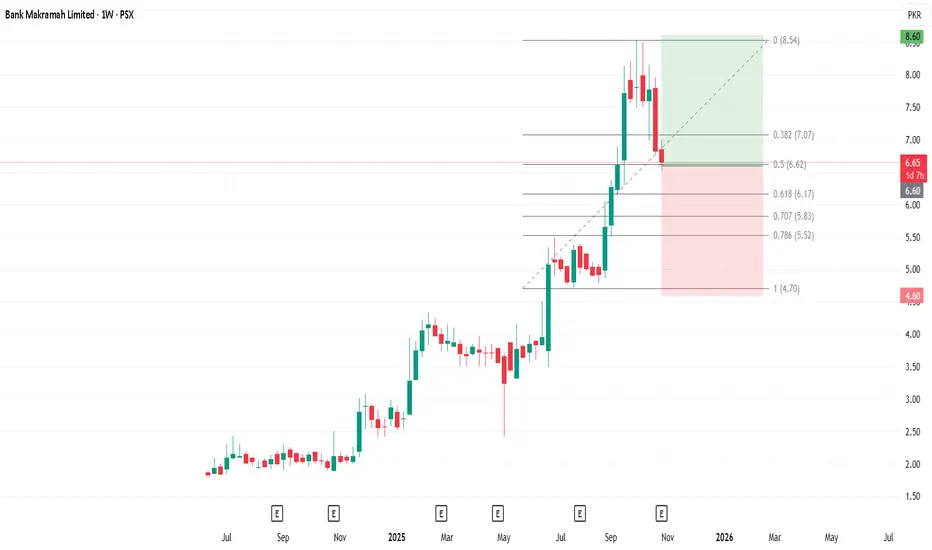
BML Bullish Reversal SetupBML is showing strong technicals, forming higher highs and higher lows. The shift in earnings from -0.26 to 0.02 suggests improving fundamentals, supporting a potential bounce from the 0.5 Fibonacci level. A buy can be made from this level, with a stop loss below the last low and take profit around the recent top.
GWLC Bullish Continuation SetupGWLC is currently in a bullish trend, forming higher highs and higher lows. After the recent top, the price has retraced to the 0.5 Fibonacci level to form a higher low, supported by an increase in earnings per share from 0.69 to 1.52 . This suggests the potential for a new bullish leg. A buy at the current market price is recommended, with a stop loss below the last low and take profit around the recent top.

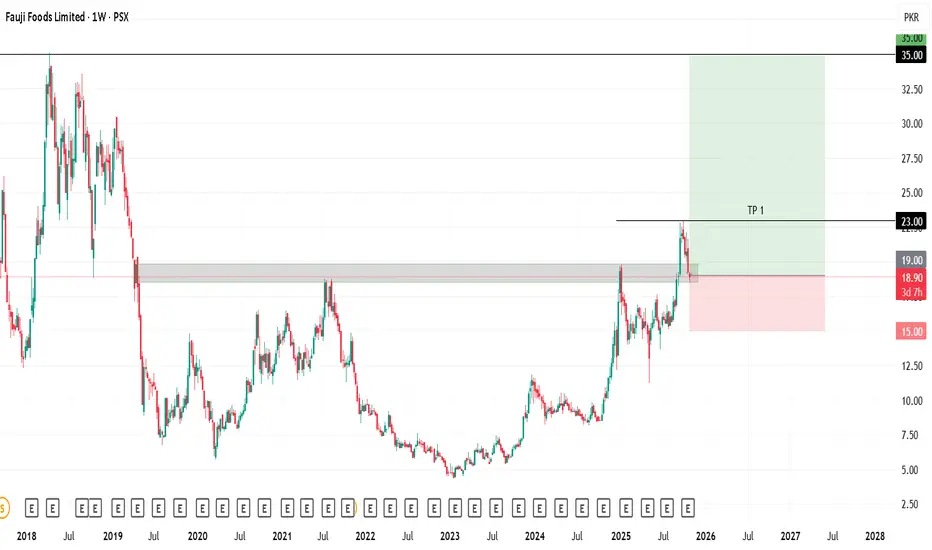
FFL Weekly Breakout & Earnings SetupFFL has broken above its weekly supply zone and is currently retesting the breakout area. The increase in quarterly earnings supports a potential bullish trend. A buy at the current market price is recommended, with a stop loss below the last low, partial profits around the recent high, and final targets at the all-time high (ATH) .
MEBL Bullish Continuation SetupMEBL is in a continuous bullish trend, forming higher highs and higher lows. The price has currently retraced to the 0.5 Fibonacci level, aligning with support from the 13 EMA . A buy can be attempted at the current level, with a stop loss below the last low and take profit targets around the recent top and the ABCD projection.

AGSML Supply Breakout SetupAGSML has broken out of its supply zone and is now trading above it. An accumulation attempt can be made around the former supply zone, which is now expected to act as support. Targets can be set around the last high and the ABCD projection.
HUBC Bullish Retracement SetupHUBC is in a strong bullish trend. The price has recently retraced to the 0.618 Fibonacci golden ratio, presenting a potential buying opportunity at the current market price. A stop loss can be placed below the last low, with take profit targets at the recent high and the ABCD projection.

KEL Weekly Breakout SetupKEL has broken out of its weekly supply zone and is currently trading above it. A retracement toward the breakout zone or the 0.382 Fibonacci level can offer a good buy opportunity, with a stop loss below the last low and a take profit target near the all-time high.

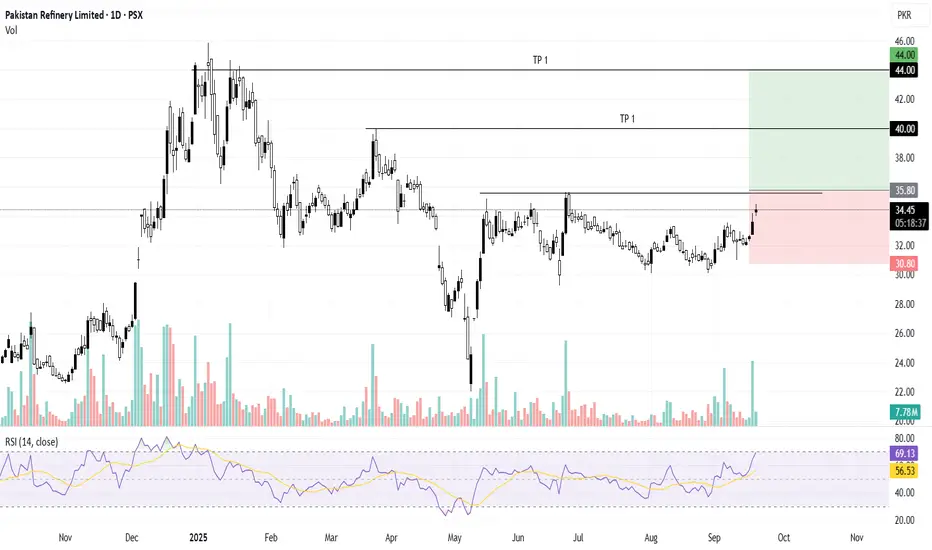
PRL Accumulation Breakout SetupPRL is currently in an accumulation box, with rising volumes suggesting a potential breakout from the zone. A buy above the selling zone is recommended, with a stop loss below the local bottom.
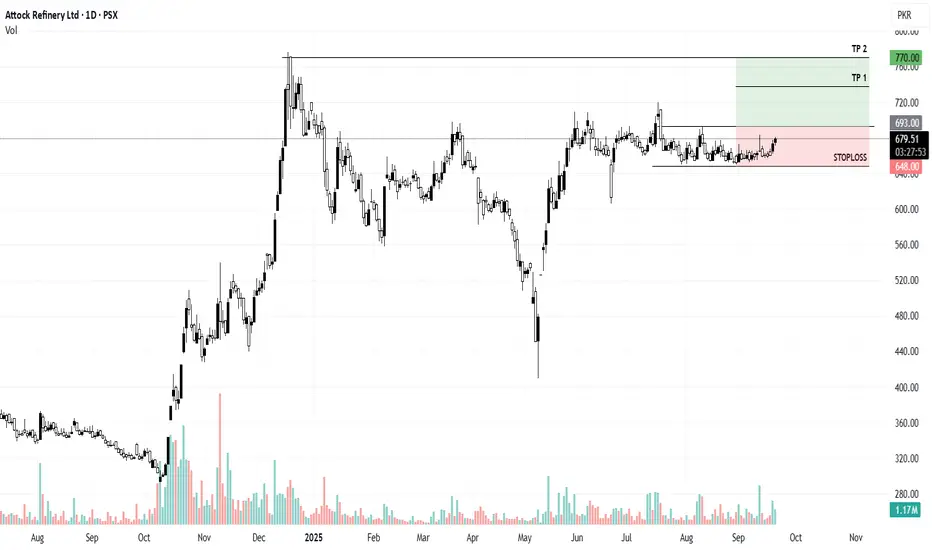
ATRL Accumulation Breakout SetupATRL is in a sideways trend. Recent bullish government news about the refinery sector could significantly increase volumes in the script. A buy above the breakout of the accumulation zone is recommended, with a stop loss below the last low and targets set at the recent high.
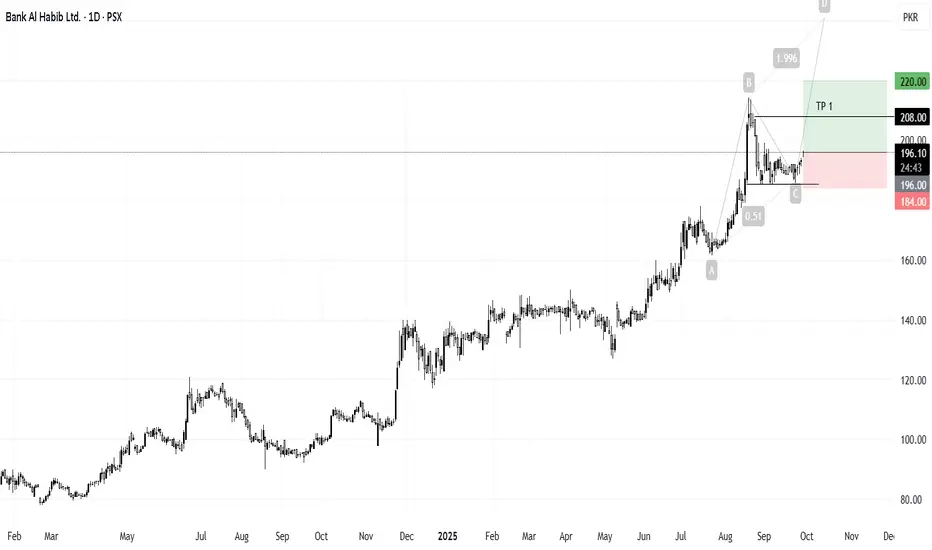
BAHL Bullish Continuation SetupBAHL is in a bullish weekly trend, consistently printing higher highs and higher lows. The price has retraced to the 0.5 Fibonacci level, and increasing volumes suggest the potential for a new bullish leg with an ABCD projection.
PREMA Technical Analysis: Retest at Strong SupportPREMA(At-Tahur Ltd.)
Price is retesting a strong horizontal support level, which previously acted as resistance and aligns with the Fibonacci golden ratio. It is trading above the upward trendline and the 55 Fib EMA, which has historically acted as dynamic support, reinforcing the bullish structure. RSI is also in sync with the setup, adding further confirmation.
The first buy is at CMP, with Buy 2 placed lower to average in on a healthy pullback. TP1 targets near-term resistance, and TP2 aligns with further upside potential. Stop loss is placed below the previous higher low on a closing basis to define risk.
Recommended Levels:
Buy 1: 46.40 (CMP)
Buy 2: 44.00
Stop Loss: Closing below 40.00
Take Profit 1: 56.30
Take Profit 2: 62.50
Take Profit 3: Ride the trend with a trailing stop
Potential upside remains as long as price sustains above the upward trendline and 55 EMA. Happy trading!

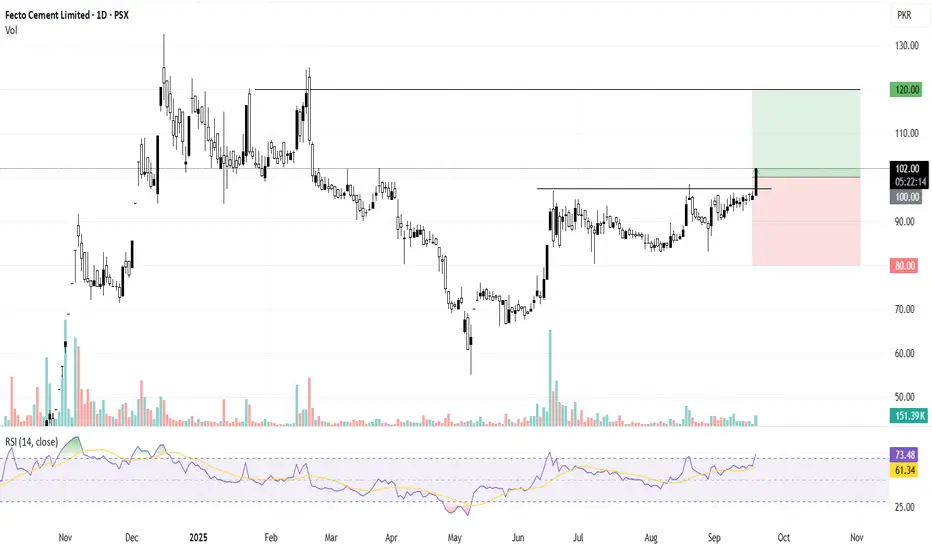
FECTC Targeting Weekly SupplyFECTC has broken the local supply zone and is now targeting the weekly supply area. A stop loss below the recent low is recommended, with targets set at the weekly high.