Hate to crash the bear party, but Bitcoin is primed to explode.Bitcoin is following the same growth pattern Apple did as it established its massive uptrend. Many investors are bearish, calling for low targets like $50K or even $30K—but most don’t realize Bitcoin is likely to rally all the way to a new all-time high.
The trend is your friend, and Bitcoin is in a monstrous uptrend. Don’t fight it. Work with it.
As always, stay profitable.
— Dalin Anderson
Pump

Gwei/UsdtBINANCE:GWEIUSDT.P
**GWEI / USDT (Perpetual – 2H)**
🔴 **Key Resistance Levels** at **0.030143 🚫**, then **0.032897 ⛔**, and higher at **0.036043 🧱**
🟢 **Immediate Support Zone** around **0.025221 – 0.023869 🛡️**
📉 Price is sitting at **demand after a steady downtrend**, showing signs of short-term exhaustion.
🎯 A **relief bounce** from this zone could target **0.0280 → 0.030143**
⚠️ If **0.023869 breaks**, downside may extend toward lower liquidity levels
⚡ **Quick Take:**
* Trend still **bearish 📉**
* Price reacting at support 🧊
* Bounce possible, but needs **strong volume confirmation 📊**
* Break of support = continuation risk ⚠️
**Disclaimer:** *For educational purposes only 📚 — not financial advice 💡. Always manage risk properly ⚠️.*

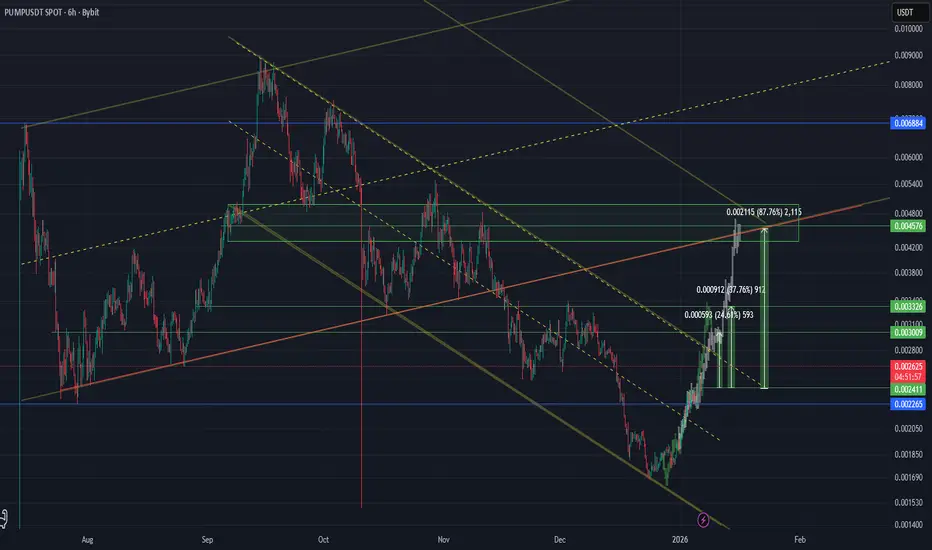
PUMP At Key Decision Zone Inside Descending StructurePUMP is still trading inside a ascending broadening wedge that has been guiding price action for an extended period. The recent move shows a short term recovery attempt, but price remains below the dominant descending resistance, keeping the overall structure bearish.
At the moment, price is reacting near a minor ascending support inside the wedge. This bounce looks corrective rather than impulsive, as it has not yet broken the main descending trendline with strength. The current structure suggests a potential pullback toward the highlighted demand zone before any stronger bullish continuation can be confirmed.
If price revisits the lower support zone and holds, a higher low could form, opening the door for a stronger recovery toward upper resistance levels. However, failure to defend this zone would likely lead to continuation toward the lower boundary of the wedge, aligning with the broader bearish trend.
This is a decision area. The next move will likely define whether PUMP transitions into accumulation or continues its larger downtrend.

SILVER - What Happened and Why Did It Dump So HardTLDR; Because it Ran so Hard.
In a recent Silver Minds post @mojo42391138 asked "what happened to the circuit breakers?" which got me thinking about whether Silver did indeed have mechanisms to try and halt trading in a similar way to stocks when things started to get out of control. So I went off and asked Dr Google.
Below is the result of some searches I did and some of my own thoughts so don't take it as any clever insights on my part. I just thought it was interesting so thought Id share it.
Yesterday was indeed a historic bloodbath for the precious metals market with both silver and gold both dumping. While gold fell significantly, silver lived up to its reputation as "gold on steroids" , plummeting roughly up to 30% (depending on the exchange and contract) after hitting record highs near $120 earlier in the week.
The answer to my question in terms of why did it dump so hard and what happened to the circuit breaker (if any) was yes it does have them, but they function differently than the ones you see on the New York Stock Exchange.
1. Why it felt like there were no breakers
In the stock market (like the S&P 500), a 7% drop of the whole market triggers a mandatory 15-minute "time-out" for the entire market. In the silver market (specifically the COMEX/CME Group), they use Dynamic Circuit Breakers.
How these work: Instead of stopping the whole market for a 7% drop, these breakers look at a rolling 60-minute window . If the price moves +/- 10% within that hour, trading pauses for just 2 minutes to allow liquidity to reset. Nothing! (IMO).
The Result: Because the pauses are so short, the price can continue to "cascade" downward after each brief restart. Yesterday’s move was driven by a "perfect storm" of the dollar strengthening and massive profit-taking, which often happens too fast for a 2-minute pause to stop the bleeding.
2. Why Commodities are treated differently than Stocks
Regulators generally allow commodities to move more freely than stocks for a few reasons:
Global Nature: Unlike Apple or Tesla stock, which primarily trades in the US, silver trades 24/7 in London, Shanghai, and New York. If one exchange (like the COMEX) shuts down for an hour, trading just shifts to another global hub, which can lead to "price gaps" and more chaos when the first exchange reopens.
Price Discovery: Commodities are used by industrial manufacturers (solar, electronics). These buyers need to know the real price to hedge their costs. Artificially freezing the price can prevent people from actually getting the metal they need.
Price Limits vs. Halts: Many commodity exchanges prefer "Price Limits" over halts. For example, some silver contracts have a 10% limit. Once hit, you can still trade, but nobody is allowed to bid lower than that limit for the rest of the day, unless the exchange decides to expand the limits (which they often do during "limit-down" events).
3. What triggered yesterday's "Reality Check"?
The collapse wasn't just random; it was a collision of technical and fundamental factors:
The "Warsh Effect": News of Kevin Warsh being nominated for Fed Chair signaled a "hawkish" shift (higher interest rates), which is kryptonite for silver.
Technical Gravity: Silver had gained over 50% in January alone. It was "overbought" by almost every mathematical standard, making it ripe for a "liquidity flush."
So that all makes sense - especially the globally traded silver not being able to be taken offline, but SLV which a heap of us hold is an ETF traded on the exchange, so I also thought it would be interesting to see how the silver ETFs (eg our SLV) handled the drop compared to the physical metal and why they didn't halt or get a time out.
Again, it turns out that while both crashed, they did so in different ways and under different rules.
Here is how the major silver ETF, SLV, handled the drop compared to the physical market.
1. Did SLV have circuit breakers?
Yes, but they are "Stock Market" breakers. Because SLV trades on the NYSE Arca (an equity exchange), it is subject to the standard Limit Up-Limit Down (LULD) rules of the stock market.
The Mechanism: If the price of SLV moves 5% or 10% within a 5-minute period, the stock exchange pauses trading for 5 minutes.
The Reality: Yesterday, while the physical silver price in London and the COMEX futures were "cascading" with only 2-minute pauses, SLV was hitting these 5-minute equity halts repeatedly. This meant that for several stretches of the morning, you couldn't sell your SLV even as the spot price of silver was continuing to fall.
2. SLV Performance vs. Physical Silver
A major issue yesterday was the tracking error. During extreme crashes, ETFs often "disconnect" from the metal they are supposed to represent.
While physical spot silver saw a violent intraday drop of 13% to 18%, SLV shareholders faced much steeper reported losses ranging from 28% to 40% driven by a wave of panic-selling and forced liquidations on the NYSE.
This discrepancy was exacerbated by liquidity mismatches: while physical silver trades on a global 24/7 basis, SLV was tethered to stock market hours and hit by repeated five-minute LULD (Limit Up-Limit Down) halts that locked investors in while the underlying price continued to crater.
Consequently, while physical coins maintained a "safety premium" of 10% or more at dealers, the paper trust plummeted to a significant discount, proving that in a true silver bloodbath, the "paper game" can't always keep pace with the bars in the vault.
The "Panic Discount": At the height of the crash, SLV shares were actually selling for less than the value of the silver held in the vault. This happens because "paper" investors (who can sell with a click) panic faster than physical bullion holders.
3. The "Paper Trap" Risk
Yesterday also highlighted a growing concern for 2026: Physical Backing. There were reports that the massive volume in SLV was putting pressure on the trust to prove it actually had enough silver in the vaults to cover the new shares. This "counterparty risk" often causes ETFs to drop harder than the metal itself during a crisis.
So - that was all a bunch of stuff I personally didn't know before. That whole disconnect between paper silver and physical silver and the difference in how they get halted created a mess :)
Trick is whether now that it is at such a deep discount and you can see its back pretty close to that more realistic 20 day support, and that wick didn't get through the 50 day, maybe now is a good time to buy if you FOMO'd before...
Who knows, who knows...

PUMP Update🚨📊 PUMP Update
After a strong uptrend,
price has now formed LH and LL ❌📉.
This indicates a short-term bearish structure.
Price could continue lower
toward the important blue support zone 🔵,
where a reaction may occur.
Watching this level closely,
buyer response will be key.

PUMPUSDT: Inverse Head & Shoulders Signals Trend Reversal- PUMPUSDT is forming a clear inverse Head & Shoulders pattern on the 12H timeframe, signaling a potential trend reversal after a prolonged downtrend.
- The left shoulder, head, and right shoulder are well-defined, showing improving market structure.
- Price is currently testing the neckline resistance, which also aligns with a descending trendline acting as a key decision zone.
- A confirmed breakout and close above the neckline could trigger strong bullish continuation.
- Volume profile shows relatively thin resistance above the neckline, increasing the probability of a fast upside move if buyers step in.
Cheers
Hexa

Magma/UsdtBINANCE:MAGMAUSDT.P
### 🔴 **Resistance Levels (Why price may reject here)**
These are zones where **selling pressure is strong** and price has reacted before:
* **0.10080 🚧** → Nearest resistance. Price already got rejected here, short-term sellers active.
* **0.11498 🚧** → Previous breakdown area, acts as supply on pullbacks.
* **0.12378 🚧** → Strong mid-range resistance, prior consolidation + rejection.
* **0.13640 🚧** → Major structure level from earlier distribution.
* **0.14608 🚧** → Higher-timeframe resistance, trend reversal only above this.
👉 Price usually **slows, rejects, or wicks** near these levels.
---
### 🟢 **Support Levels (Why price may bounce here)**
These are zones where **buyers previously stepped in**:
* **0.09861 🛡️** → Local support + recent reaction zone.
* **0.09584 🛡️** → Intraday base, price is hovering around this.
* **0.09338 🛡️** → Current price area, short-term decision point.
* **0.08977 🛡️** → Strong demand zone, last defense before deeper drop.
👉 If support **holds**, expect bounces.
👉 If support **breaks**, next lower level becomes the target.
---
### 📌 **Market Logic (Big Picture)**
* Trend is **bearish / corrective** 📉
* Price is stuck **between support & resistance** (range behavior)
* **Break above resistance = continuation up**
* **Break below support = continuation down**
⚠️ **Disclaimer:** *For educational purposes only. Not financial advice.*

Technical Analysis: BTC Fibonacci Support Confluence & Trade Set1. Fibonacci Analysis:
the significance of the 0.5 (50%) and 0.618 (61.8%) Fibonacci retracement levels derived from the prior major swing. These are two of the most critical confluence zones in technical analysis, where institutional and algorithmic buy-side liquidity is often clustered .
2. Price Action Interpretation:
The fact that the price has respected these levels and initiated a bounce indicates strong underlying demand . The current test of this Fibonacci support cluster is a classic bullish consolidation pattern within a larger uptrend. A firm rejection from this zone would confirm the strength of the trend and signal that the correction is likely complete.
3. Market Expectation:
We anticipate that this Fibonacci support confluence will hold strong, serving as a launchpad for the next impulsive wave. A successful hold here increases the probability of a resumption of the uptrend , targeting a break above the recent high and extension toward new cycle highs.
4. Trade Signal & Risk Management:
Direction: Long
Trigger: A bullish rejection candle (e.g., hammer, bullish engulfing) on the 4H or daily chart at the 0.5–0.618 Fib zone, accompanied by rising volume.
Stop-Loss (SL): Placed just below the 0.78 Fib level (e.g., below $88600) to invalidate the thesis on a breakdown.
Take-Profit (TP): Set at a 1:2 Risk-Reward (R:R) ratio. The first TP target would be the prior swing high, with the final TP projected for a measured move toward new highs.
Risk : Position size must be calculated so that the potential loss from the SL is within your strict maximum risk-per-trade parameters (e.g., 1-2% of portfolio ).
Summary:
The confluence of two major Fibonacci retracements provides a high-probability, low-risk area for a long entry. The setup offers a favorable asymmetric risk-reward profile (1:2 R:R). Execution depends on a confirmed bullish reaction at the defined support zone.
😊DISCLAIMER: ((trade based on your own decision))👽

PUMPUSDT Forming Falling WedgePUMPUSDT is forming a clear falling wedge pattern, a classic bullish reversal signal that often indicates an upcoming breakout. The price has been consolidating within a narrowing range, suggesting that selling pressure is weakening while buyers are beginning to regain control. With consistent volume confirming accumulation at lower levels, the setup hints at a potential bullish breakout soon. The projected move could lead to an impressive gain of around 190% to 200% once the price breaks above the wedge resistance.
This falling wedge pattern is typically seen at the end of downtrends or corrective phases, and it represents a potential shift in market sentiment from bearish to bullish. Traders closely watching PUMPUSDT are noting the strengthening momentum as it nears a breakout zone. The good trading volume adds confidence to this pattern, showing that market participants are positioning early in anticipation of a reversal.
Investors’ growing interest in PUMPUSDT reflects rising confidence in the project’s long-term fundamentals and current technical strength. If the breakout confirms with sustained volume, this could mark the start of a fresh bullish leg. Traders might find this a valuable setup for medium-term gains, especially as the wedge pattern completes and buying momentum accelerates.
✅ Show your support by hitting the like button and
✅ Leaving a comment below! (What is your opinion about this Coin?)
Your feedback and engagement keep me inspired to share more insightful market analysis with you!

$PUMP Buyback PressurePumpFun active wallets are creeping back up, and the on-chain meme space is starting to pull liquidity in again. PUMP also got a nice lift after the creator callout feature dropped.
PUMP is starting to look pretty interesting here — reclaiming the range low with clean bullish structure. Price defended the 0.0020 level, even while a bunch of coins were getting smoked.
If CRYPTOCAP:BTC stays cooperative, I can see this being one of the better runners in the next few days. Bitcoin is stalling below the 96k resistance after tagging 97.9k. If we start losing 95k, I think PUMP can still retest the .0024–.0020 area.

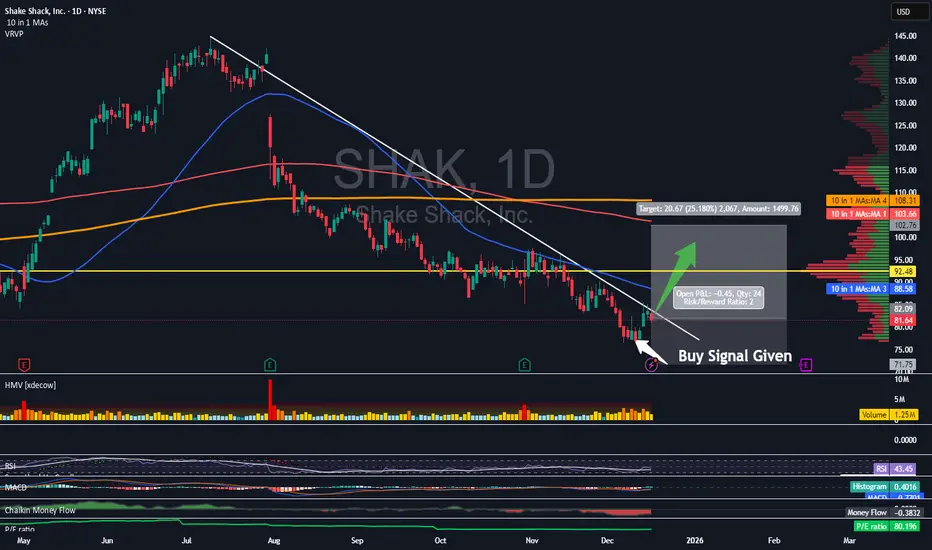
Buy Signal Given on Shake ShackTrading Fam,
I've received two more clear buy signals from my indicator recently. Here on SHAK we were given our signal about a week ago. I didn't wait for to break that descending trendline on this one, so it may be a tad bit more risky than had I waited for that breakout. However, I have full confidence in my indicator as it has a knack of predicting breakouts before they occur. I don't doubt this will be the same.
Here is what I am looking at:
1) Buy signal given by my indicator and confirmed with good volume.
2) We are about to break to the upside of that descending trendline. Once we do, we should be able to climb up to that red 200 SMA (my target) for a touch.
3) There will be some resistance before we get to my healthy 25% profit target: the descending TL, the 50 SMA, and the VRVP PoC.
This trade comes in at a 1:2 rrr with a target of $102+ and a SL of 71.75.
✌️Stew
PUMP it to valhalla meme factory UPDATEPUMP it to valhalla meme factory UPDATE
some hopium for everyone!
all you need is a few lines (no pun).
UPDATE . adjusted fractals/levels because we didn't just continue up right away .

IR/USDTBINANCE:IRUSDT.P
**R/USDT 4H Snapshot** 📉
**Price:** $0.06633 (-2.76%)
**Range:** $0.06575 (Low) ↔ $0.06893 (High)
**Key Levels:**
- 🔴 Resistance: $0.06893
- 🟢 Support: $0.06575 (must hold)
**Outlook:** Testing key support. Break below → more downside. Hold → possible bounce.
*(Data appears partial—confirm with full chart. Not financial advice.)*

PUMPin memes funPUMP
meme coin factory
muppets seem to enjoy creating absolutely dog s*&*& tokens for no reason then other muppets seem to like to trade off each other for it...
shovels and all that
volume is big, revenue is big, on solana. sol/btc looks good.
gl
$PUMP / USDT - Finally, reversal signs cookingNYSE:PUMP / USDT - Finally, reversal signs cooking! 😱
💣 3-month falling wedge structure
💣 Bull div RSI
💣 Buy volume increase + trend reversal
My take: ⏳
Waiting for a clean pullback & retest of the green demand zone around $0.002100 before jumping in! 📈
📊 Daily view attached. Like & share if helpful! 👍

PUMPUSDT UPDATEPUMP
UPDATE
PUMP Technical Setup
Pattern: Falling Wedge Pattern
Current Price: $0.00226
Target Price: $0.00500 USDT
Target % Gain: 121.24%
Technical Analysis: PUMP is breaking out of a falling wedge pattern on the 1D chart, indicating bullish potential. Price has recently shown strength near the wedge resistance, and a breakout above that level with increasing volume could validate continuation toward the projected target zone near $0.00500. The measured move from the pattern points to extended upside if momentum persists.
Time Frame: 1D
Risk Management Tip: Always use proper risk management.

PUMPUSDT — Descending Trendline Break Trigger Trend Reversal!On the 1D timeframe, PUMPUSDT remains in a medium-term downtrend after failing to hold the previous high near the 0.0089 area. Price continues to form lower highs and lower lows, indicating that sellers are still in control. However, recent price action shows buyer reaction from the lower support zone, opening the possibility of a short-term recovery or trend reversal if a breakout is confirmed.
---
Pattern Explanation
Price is trading below a descending trendline (yellow line) acting as a strong dynamic resistance. This structure represents a Descending Trendline / Falling Channel setup, where:
Each bullish attempt is rejected at the trendline
Bearish momentum gradually weakens near the bottom
Price begins to form a minor higher low in late December to early January
This suggests early signs of trend exhaustion, but a valid reversal requires confirmation through a breakout.
---
Key Levels
Resistance Levels:
0.00250 → minor resistance (current reaction area)
0.00307 → mid resistance
0.00340 → key resistance
0.00450 → major resistance
0.00517 → strong supply zone
0.00704 – 0.00858 → upper resistance & previous high
Support Levels:
0.00232 → daily support
0.00205 – 0.00190 → major demand zone
0.00170 → last strong support (bullish invalidation level)
---
Bullish Scenario
A bullish scenario will be confirmed if:
Price breaks and closes above the descending trendline
A strong daily close above 0.00250 is achieved
Bullish targets:
0.00307
0.00340
0.00450
0.00517 (extended target if momentum increases)
As long as price holds above 0.00232 and breaks the trendline, trend reversal potential toward bullish continuation remains valid.
---
Bearish Scenario
The bearish scenario remains valid if:
Price fails to break the trendline
Strong rejection occurs around the 0.00250 area
Price breaks below 0.00205
Bearish targets:
0.00190
0.00170
A breakdown below 0.00170 would confirm bearish continuation and invalidate the bullish setup.
---
Conclusion
PUMPUSDT is currently at a critical decision zone. The broader structure is still bearish, but price action shows early recovery signals. The descending trendline breakout is the key confirmation for a potential trend change. Until then, any upward move should be considered a technical rebound.
---
#PUMPUSDT #PUMP #CryptoAnalysis #TechnicalAnalysis #DescendingTrendline
#BreakoutSetup #Altcoin #CryptoTrading #DailyChart #TrendReversal
#SupportResistance

$PUMP to 0.0030Recent fund movements tied to Pump.fun have sparked fresh discussion across crypto circles about whether the platform’s revenue reflects normal business activity or leans toward aggressive value extraction. On-chain data and industry chatter have both added fuel to that debate.
Technical Outlook:
From a technical perspective, the daily chart shows price nearly filling the 10/10 liquidation wick and currently holding the 0.0016 level. If the broader market gets a relief bounce this quarter and Bitcoin can stabilize above 85k, I think PUMP has room to revisit the 0.0024–0.0028 zone, with a potential extension toward 0.0034–0.0036 after that.

$PUMP - Setup completed NYSE:PUMP - Setup completed 🎯
-20%✅
Sell pressure & FUD could continue over time regarding the bad news ongoing 🔴📉
Did you took this one!? 🔥

At/Usdt.PBINANCE:ATUSDT.P
## 📈🔥 **ATUSDT Quick Update**
Price is holding above the support near **0.1217** and just broke the short-term down-trendline ✔️.
As long as buyers defend this zone, market can build a slow upward structure and attempt higher levels.
If price maintains strength above **0.1305 (local resistance)**, the next targets open up.
## 🎯 **Key Levels**
### 🔵 **Support Zone**
* **0.1217 – 0.1230** (Major support – buyers still active)
* ⚠️ If this breaks, downside liquidity sits lower (your pink zone)
### 🔴 **Resistance Levels**
* **0.1305** → First resistance (needs clean breakout)
* **0.1480** → Next major resistance
* **0.1630** → Strong resistance zone
* **0.1836** → High-timeframe supply zone (big sellers expected)
### 🚀 **Bullish Path**
If price stays above **0.1217** and breaks **0.1305**, we can see a slow climb toward:
➡️ **0.1480**
➡️ **0.1630**
➡️ **0.1836** (major target)
## ⚠️ **Disclaimer**
This is only chart-based analysis — **not financial advice**.
Crypto is volatile. Always manage risk and avoid over-leveraging 🙏.

Buy before Pump! BTCUSDTAccording to the areas, previous halving trends, and weekly candles, 2 points for step-by-step purchase of Bitcoin are identified in the chart.
Don't forget capital management! be profitable.

PUMPUSDT = Time to buy?🐸 NYSE:PUMP #PumpFun ➖ Time to buy?
Chart (PUMPUSDT):
PUMP is down 72% from its all-time high. Looking at the liquidation map, this looks like a solid entry point to grab some PUMP for part of the portfolio with around +150% upside potential.
Take-profit target is $0.007 ➖ right where the biggest cluster of short liquidations sits.

BTC/USDTINDEX:BTCUSD
### Bitcoin / US Dollar — 2h Chart (INDEX)
- **Last Candle Data (approx.)**: Open ~**93,500.02**, current SELL pressure indicated.
- **Volume**: **794** (appears low on scale).
- **Key Price Levels (in USD)**:
- **Resistance Zone**: 99,000 – 97,000
- **Near-term Resistance**: 95,000 – 96,000
- **Current Trading Range**: ~93,000 – 92,300
- **Support Levels**: 91,000 → 90,000 → 87,000 → 85,000
- **Major Support Zone**: 83,000 – 79,000
**Summary**: Bitcoin is trading in the lower half of the displayed range, with immediate support near **92,300–91,000** and resistance around **95,000–96,000**. Volume is relatively low on this timeframe. Watch for a break above 96,000 for bullish momentum or a drop below 91,000 for further downside.
---
**Disclaimer**: This is technical observation, not financial advice. Cryptocurrency trading carries risk. Always do your own research.
