$PUMP: when to accumulate?There’s a strong support zone between $0.02900 and $0.03300.
At the current price, NYSE:PUMP already looks like an attractive buy in my opinion — but if it drops into the green box, I’ll definitely go long.
The lower it goes, the better the entry.
My plan is simple:
➡️ Enter
➡️ Take profit on a quick +10% move
➡️ Fire and forget
This asset is extremely volatile. There will be many more dips and plenty of trading opportunities — so stay cautious, get in and out fast, and don’t get greedy.
DYOR.
Pump
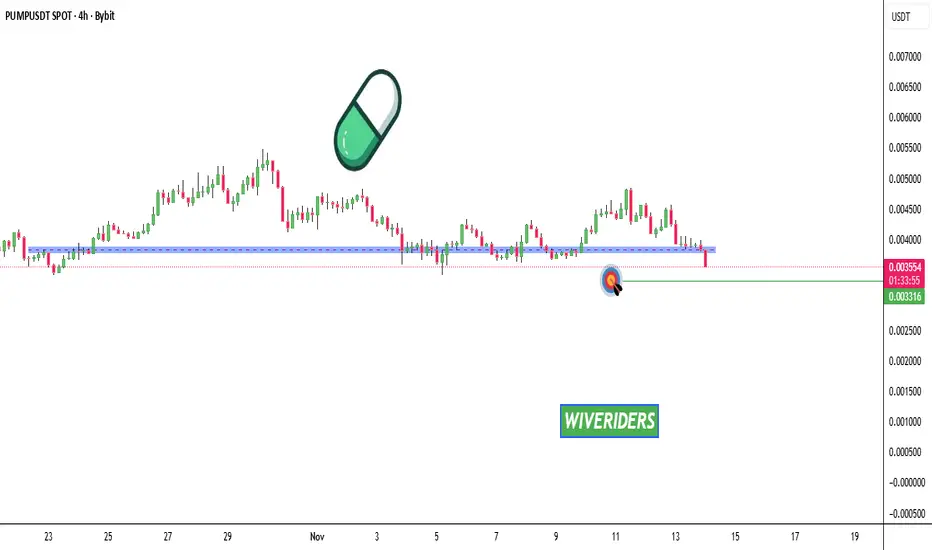
PUMP Update📊 PUMP Update
PUMP has broken below the blue support zone 🔵
Price could continue moving down, at least toward the green line level 🟢
Structure remains bearish as long as it stays below the broken support 🔻
PUMP OR DUMPHello friends
As you can see, the price has corrected after hitting the ceiling and buyers are gradually entering and buying in steps.
The specified supports are important for price growth. If these supports are maintained, the price can move to the specified targets. Of course, be sure to observe capital and risk management and enter in steps.
*Trade safely with us*

BTC BREAKING NEWS OR BREAKING CHARTS?📰 BREAKING NEWS OR BREAKING CHARTS?
TRUMP IMPOSES TARIFFS, CAUSING A BITCOIN BLOODBATH — $20,000 DRAWDOWN IN 2 HOURS!
Bitcoin was sitting comfortably at $121,000, before a sudden macro shock — triggered by newly imposed U.S. tariffs — sent prices spiraling down to $100,000 in a matter of hours.
Bulls were liquidated. Bears rejoiced.
Now, the market stands at a crossroads: will this become a major dump continuation, or the foundation for a secret pump?
Chart Overview & Structure
On the high timeframe, BTC continues to trade within a rising wedge formation, with price now showing a significant wick rejection from the upper boundary. This move suggests a potential shift in market structure — a moment that’s likely to shake inexperienced traders. The chart reveals a clear supply and demand structure:
Supply Zone: $123,452 – $130,000
D emand Zone: $98,826 – $101,400
These zones define the battlefield between bulls and bears. In addition, eight psychological levels dominate the chart — $100K, $105K, $110K, $115K, $120K, $125K, and $130K — each representing potential liquidity clusters and reaction points.
Adding to the complexity, we can see a golden pocket (0.618–0.65 retracement) forming around $106,000, perfectly aligning with prior swing lows and the midpoint of a large Fair Value Gap (FVG) overhead. This zone could serve as a reversal or continuation point depending on whether price can reclaim and hold above the major support trendline.
Technical Insights
The market has now tapped the rising wedge resistance three times, with the last tap forming a wick above $125K, triggering liquidity before the sharp collapse. This aligns with the classical exhaustion behavior of wedges. Moreover, a potential Head and Shoulders structure is beginning to emerge, with the right shoulder aligning near $115K — a confluence area that may attract strong bearish attention.
For now, price is testing the lower support trendline — a crucial pivot area for determining whether BTC continues to break down toward demand or consolidates for recovery. This structure creates a make-or-break zone that will define the next macro leg.
Bullish Scenario
Despite the panic, this could be a classic liquidity flush — a “flush candle” event designed to wipe out leveraged long positions before a larger move upward. If BTC can maintain structure above the major support line and close above $106K–$110K, it opens the door for a relief rally.
A reclaim of $115K would confirm buyer strength.
Sustained momentum could push BTC back into the $120K–$125K range to retest the broken supply zone.
Breaking through $125K would invalidate the bearish wedge, potentially igniting a run toward $130K+ and even new highs in “Pump-tober.”
In this scenario, the deep liquidation event becomes fuel for a massive short squeeze, driving momentum and reigniting bullish sentiment across crypto markets.
Bearish Scenario
On the flip side, if BTC fails to hold above $106K or decisively breaks below the demand zone at $98K, it would confirm a rising wedge breakdown.
Below $100K, momentum could accelerate toward $95K–$92K — the next liquidity pools and volume gaps.
The Head and Shoulders completion would confirm the bearish reversal structure, further strengthening the downside case.
Macro sentiment, fueled by geopolitical and policy fears, could add weight to the bearish outlook.
A rejection from $115K without sustained reclaim would also reinforce the bearish continuation pattern, with every psychological level above turning into resistance.
Summary
Bitcoin is at an inflection point — the $100K–$115K range will define the next macro move.
The recent wick and structure breakdown hint at weakness, but the flush candle and liquidity sweep also suggest that a bullish rebound could be on the horizon.
In short:
Above $115K → Bullish continuation possible.
Below $100K → Bearish expansion likely.
With volatility at its peak, traders should expect massive liquidity hunts, fakeouts, and emotional traps on both sides.
Whether this becomes the start of a macro correction or a secret accumulation phase before a major pump — the next few daily closes will tell the story.

PUMP/USDT - Decision Time for: Breakout or Breakdown?The PUMP/USDT pair is now sitting at a critical decision zone, forming a large Symmetrical Triangle pattern on the 12H timeframe.
After weeks of reduced volatility and tight consolidation, price action is approaching the apex of the formation — signaling that a major breakout is imminent.
This structure shows a clear battle between buyers and sellers, as the market compresses between a descending resistance line and a rising support line. Momentum is coiling up — and once the breakout occurs, the move that follows is likely to be explosive.
---
Pattern Description
Pattern name: Symmetrical Triangle
Character: Neutral continuation/reversal pattern — depends on breakout direction
Meaning: Momentum is building; the tighter the triangle, the stronger the potential breakout
Confirmation: Breakout candle + strong volume = valid signal
---
Key Technical Levels
Current price: Around 0.00457 USDT
Bullish targets (if breakout occurs):
1. 0.00520 → breakout confirmation zone
2. 0.00710 → mid-range resistance
3. 0.00860 – 0.00898 → final target / previous swing high
Bearish targets (if breakdown happens):
0.00390 → triangle support
0.00330 – 0.00280 → next demand zone
0.00200 → extreme support / potential panic zone
---
Bullish Scenario
A decisive breakout above the descending resistance trendline with rising volume would signal a potential trend reversal.
If the candle closes above 0.00520, price could rally toward 0.00710 and eventually test the 0.0086 – 0.0089 range.
A successful retest of the breakout zone would strengthen the bullish continuation setup.
Ideal confirmation: 12H candle close above resistance + solid volume expansion.
---
Bearish Scenario
If selling pressure dominates and price fails to hold above the lower support trendline (0.0039), the pair could enter a deeper correction phase toward 0.0033 – 0.0028 or even 0.0020 in a panic-driven move.
Such a breakdown would confirm a bearish continuation and a potential retest of previous lows.
---
Conclusion
PUMP/USDT is coiling up tightly inside a symmetrical triangle — a sign that a high-volatility breakout is near.
The longer the price stays compressed within this range, the more explosive the next move will be.
Traders should closely monitor the 0.0045–0.0052 zone for a decisive breakout or breakdown confirmation.
“Big moves are born from tight ranges — and this chart looks ready to erupt.”
#PUMPUSDT #CryptoBreakout #TrianglePattern #TechnicalAnalysis #PriceAction #CryptoTrading #BullishSetup #BearishScenario #VolatilityLoading #ChartAnalysis #SwingTrade

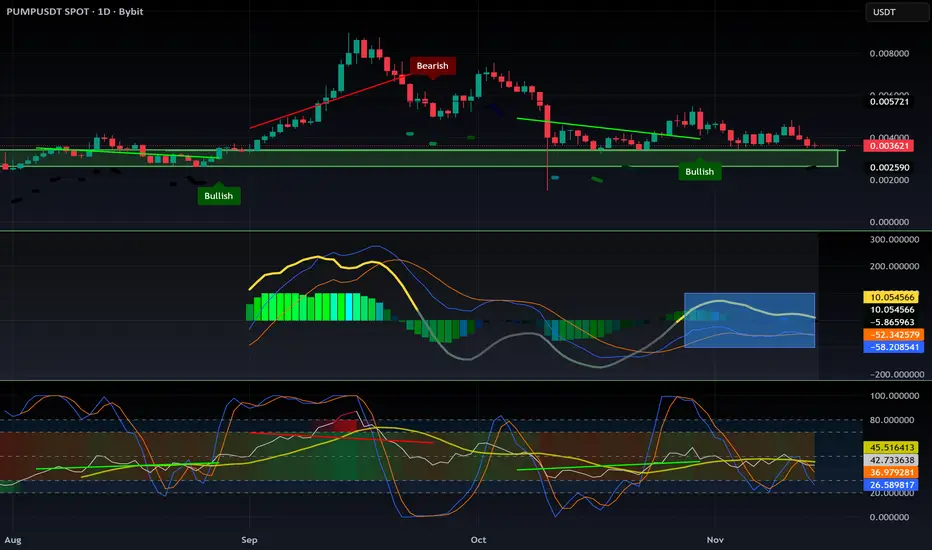
$PUMP Update📊 NYSE:PUMP Update
NYSE:PUMP is testing the red resistance zone 🔴
If it breaks out above, it could confirm a bullish setup 📈
The first target would be the green line level 🟢

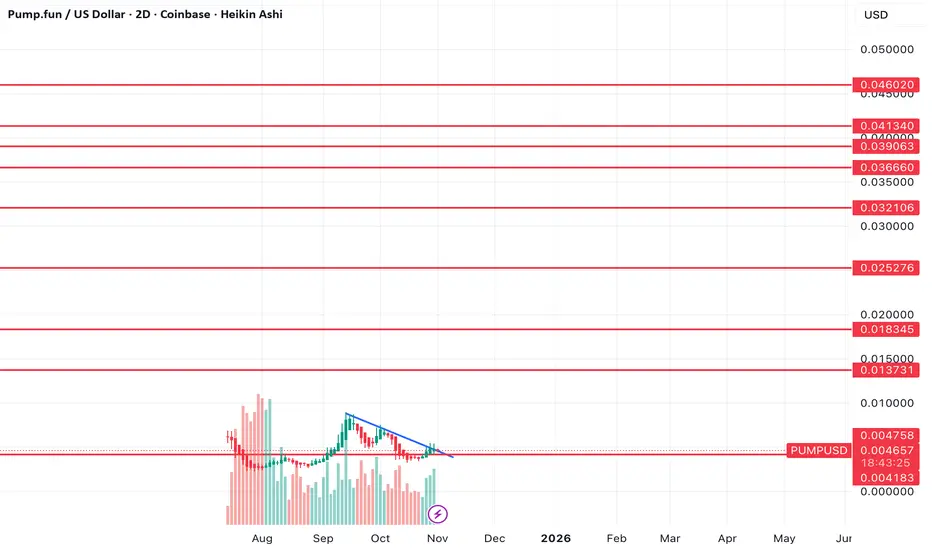
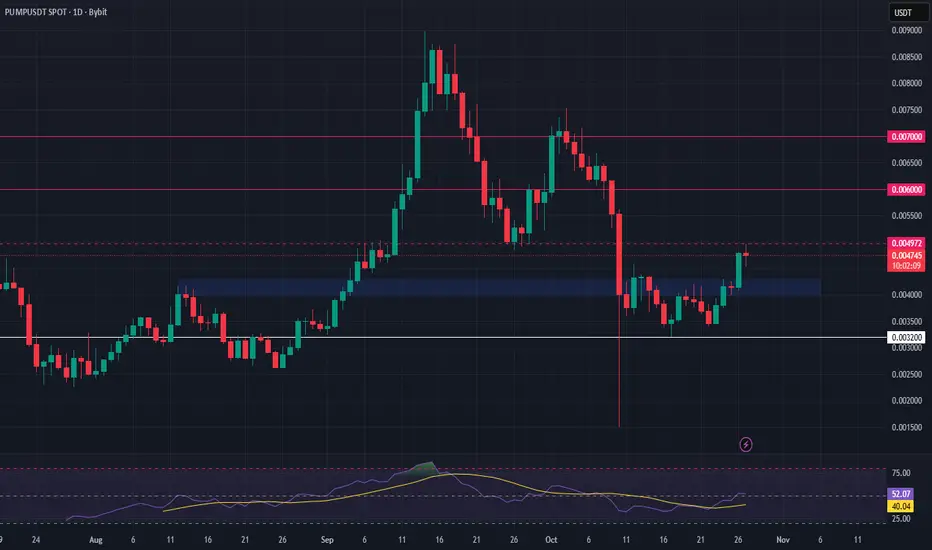
Is pump about to pump to new highs?Since September, Pump has corrected, however now it looks like we've broken and retested the downtrend and it looks set to move higher from here.
I've marked off key resistance levels on the way up.
Think we could see a pretty large move if this really gets going.
BEYOND MEAT: How One Trader Pumped A Stock 1500%!
BEYOND MEAT: How One Trader Pumped A Stock 1500%!
📈What It's All About:
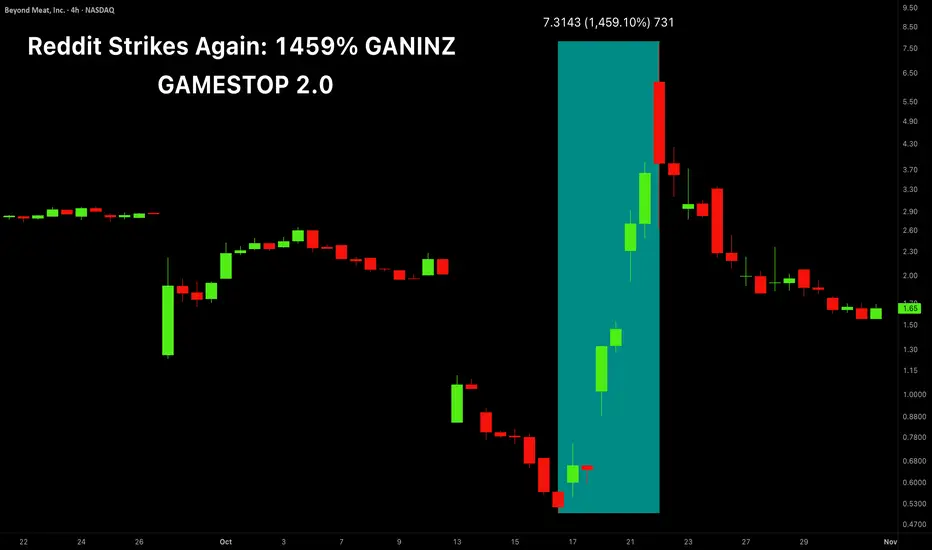
The chart you are looking at is not one of a sh*tcoin, it’s a stock listed on the New York Stock Exchange! The company is called Beyond Meat, a pioneer of the artificial meat market. A set of commercial failures and debt problems brought the stock down by 99.79% from the highs when the pump started!
📈The Pump:
A Reddit account called "Capybara Stocks" disclosed buying roughly 3.1 million BYND shares around mid-October and published a detailed bullish thesis, arguing the note exchange plus equity issuance, which triggered dilution fears, actually reduced bankruptcy risk and improved the balance sheet.
His post highlighted heavy short interest/borrow costs and retail options flows that amplified the upside.
📈What Happened Next:
It was a typical short squeeze on an epic scale. With the 54% short float, a sudden buying spree started triggering stop losses and key options levels. People who sold the options and expected to make easy $100 were now looking at $1,000+ potential losses and were scrambling to buy shares to "cover" their sold options.
📈GameStop Case:
This scenario closely mirrors the GameStop stock pump ( NYSE:GME ) during 2020/21 when the stock was pumped by Reddit trading group WeTradeStocks from $17 to $483 within days (a 2,840% surge), driving some hedge funds into near bankruptcy.
📈What Now:
As BYND stock price has already lost 50% from the recent highs and seems to want to go lower, the company’s current prospects remain bleak with revenue projected to drop 14% next year.
But the CapybaraStocks trader made $10,000,000 in profits and says he kept a sizeable position in the stock as he believes in it “long term.” Many option traders made small fortunes, and the people who were on the opposite side of the trade went bankrupt overnight.
📈Conclusion:
Hats off to the legends who pumped the stock to the moon and HODLED!
To those who lost money: C’est la vie 😎
Yours Truly,
Greg🌹
PUMPUSDT.P - October 31, 2025PUMPUSDT.P is displaying a corrective pullback within a broader bearish structure, currently testing the $0.00480 zone where a sell short limit order is positioned. Price action suggests a potential lower high formation, with downside continuation favored toward the $0.00330 target. The invalidation lies above $0.00555, maintaining a clear risk boundary. Overall, this represents a moderate-risk short setup, dependent on rejection confirmation from the immediate resistance zone to validate continued bearish momentum.

Graph link (GLQ)Glq usdt Daily analysis
Time frame daily
Risk rewards ratio >3 👈👌
Target =0.0162 $
Technical analysis
GLQ, as you can see in the image, had been moving within a descending channel for several months.🐻❄️ It eventually broke below the lower boundary of this descending support, signaling a potential drop to traders. Surprisingly, however, the yellow support zone you can see in the chart held very strongly — even after four separate tests, it did not break. This area will be the most important support zone for me, and I do not expect it to be broken at all. Even during the massive crash two weeks ago, when almost all coins experienced drops of up to 70%, this support remained intact.

Just In: $PUMP Token Is Gearing For A 250% Surge Pump.fun native token- NYSE:PUMP Token is poise for a 250% breakout amidst breaking out of a falling wedge pattern.
The asset is currently consolidating with eyes set on the $0.0023 support point. With the RSI at 52 this gives more room for bears to capitalize on the dip going as low as the support point aforementioned above.
However, albeit the bearish nuance now, this is solidifying our bullish thesis on the token creation coin as we set our eyes on the ceiling of the wage.
In a recent news, Pump.fun has acquired Padre, a cross-chain trading terminal, to enhance its multichain trading capabilities. The move aims to boost user experience for professional memecoin traders and follows a price surge in PUMP of approximately 6% within 24 hours.
About Pump.fun
The PUMP crypto-asset is the official utility coin of the pump.fun utility coin launch platform and the swap.pump.fun automated market maker (AMM) protocol (together, the "Pump.Fun Protocols"). The PUMP crypto-asset will not be required in order to utilize the Pump.Fun Protocols, which remain permissionless. Holders of the PUMP crypto-asset may opt to participate in promotional give aways from the Pump.Fun Protocols. The PUMP crypto-asset is a utility coin that will be used alongside the pump.fun brand behind the Pump.Fun Protocols.
Pump.fun Price Data
The Pump.fun price today is $0.004951 USD with a 24-hour trading volume of $586,778,909 USD. Pump.fun is down 6% in the last 24 hours. The current CoinMarketCap ranking is #48, with a market cap of $1,752,553,989 USD. It has a circulating supply of 354,000,000,000 PUMP coins and a max. supply of 1,000,000,000,000 PUMP coins.

OG/USDT Analysis. Long Setup
On this asset, we’ve detected a large number of volume anomalies, which suggests strong accumulation by a major player. Additionally, there’s a structural breakout on the chart, and above the current price, we can see a volume gap, creating potential for upward movement.
In the order book, below $10.8, there are limit buy orders totaling around $1.7 million, which is a significant volume for this coin.
We’re considering a long position from current levels or after a false breakout of $10.5, where the first signs of abnormal activity appeared.
Growth target: $12.7.
This publication is not financial advice.

OBOL $0.15 as soon as possibleHello,
I think Obol pump as soon as possible and very fast price go to the $0.15 and more.
The total tokens in circulation are less than 100 million, but volumes above 200 million on a particular exchange are unusual and indicate a price manipulation that is caused by lowering the price and collecting tokens on other exchanges.
You can buy on other exchanges and transfer to your wallet and expect a pump and profit of over 300%.
What do you think?
Thank you

Litecoin is primed for a massive price explosionI’m thinking we’ll see a big pump on Litecoin. I love this multi-year accumulation pattern. A lot of people don’t realize how held back this coin has been—when it starts pumping, it will be insane.
As always, stay profitable.
- Dalin Anderson

PUMPUSDT – Long Setup at Key Support ZonePUMP is retesting resistance while pulling back into a critical support zone, offering a potential spot long opportunity for those monitoring the range. The price action is forming a confluence area that could act as a base for the next upward move.
📍 Entry Zone: $0.0040 – $0.0043
🎯 Take Profit Targets:
• TP1: $0.0060
• TP2: $0.0070
🛑 Stop Loss: $0.0032
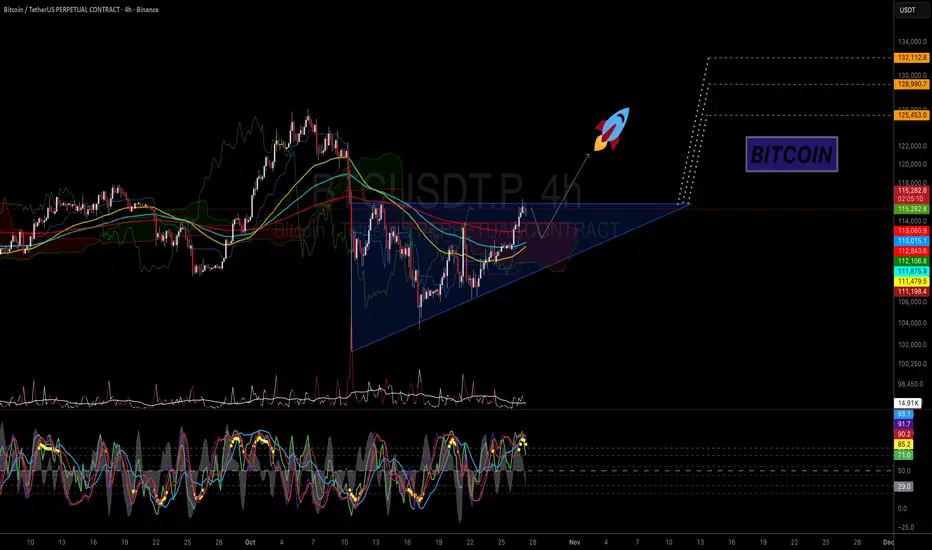
BTC - Ascending Triangle in PlayMorning fellas,
Halloween coming up and trust me, we gonna get that pump and one more leg up to ATH.
Obv you do you, its your money so its up to you the risk you take, but I am riding this like a biker riding a harley over a sunset.
Trade thirsty, my friends!
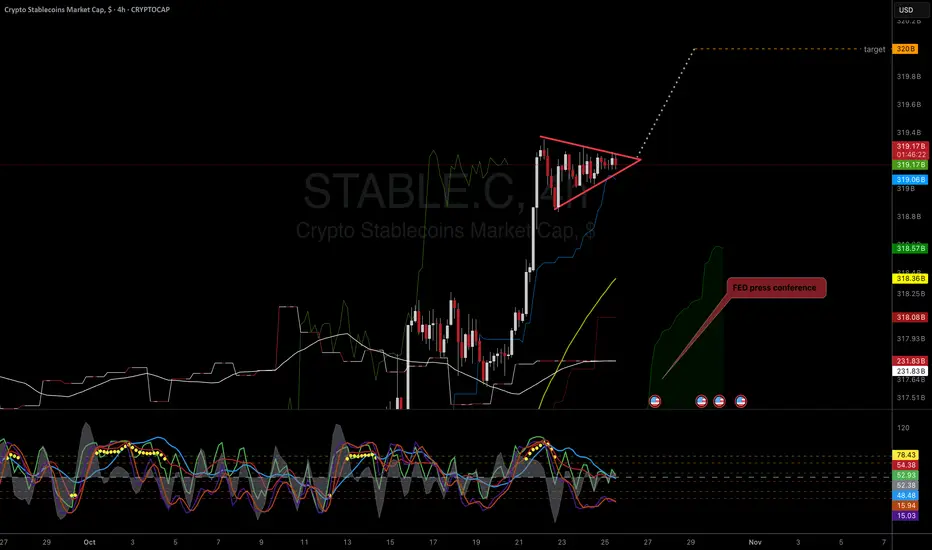
STABLES Market Cap to 320B Afternoon my friends,
Do NOT think the stable coin market cap is headed towards a downtrend. So, to me, we pump next week and break above the 320B market cap. If this happens, we can expect a very nice relief rally across the crypto market.
Lets hope it delivers!
Trade thirsty, my friends!
Litecoin Long-term Pump! Are you ready for this ?Hey Guys !
Are you ready for the LTC big pump ? It seems to me that we 're about to witness a big volatility in Altcoins very soon... As you know Bitcoin has been pumping for few months now and we haven't really seen any significant change in almost all the allcoins which might be confusing but if you look closely to the Litecoin 3 months chart you can see exactly why.
Whales has been accumulating for the last few months and as soon as the Bitcoin crashes (inevitable) all allcoins should crash even more and we should witness an all time low for most altcoins especially LTC which might reach the ALL TIME LOW line!
Bollinger Bands for the 3 months chart shows that we are getting rejected by mid band for months and its only logical that we fall to the lower band which is around 30$ and this price can be the ultimate entry price for long term investment!
Try to catch the train from the start and hodl untill the big pump news comes out wether its a Walmart announcement or whatever BS they say its gonna pump super hard !
Let me know what do you guys think about this and I'm looking forward for your comments.

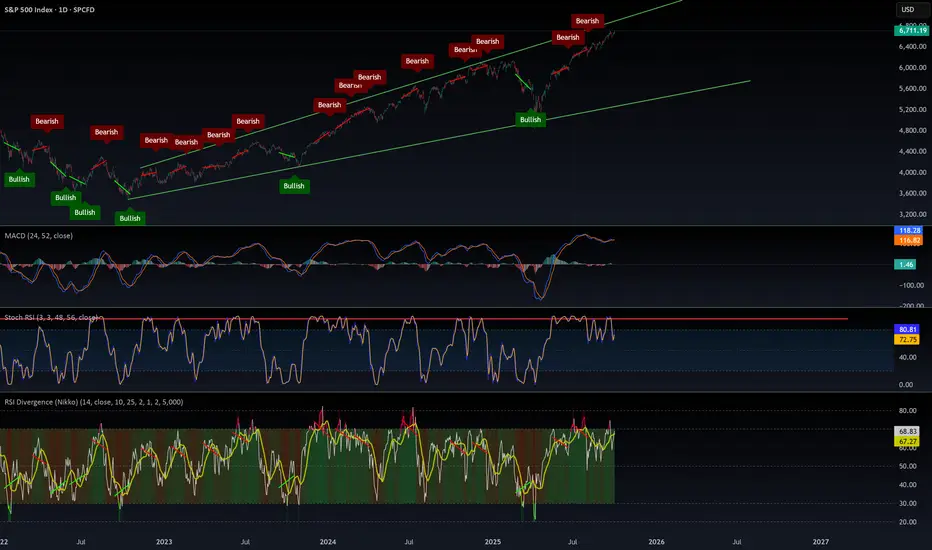
$SPX500 by all metrix this is overboughtMarkets can stay irrational longer than we can stay solvent. Right now, we’re at the top of this megaphone pattern, with everything extremely overbought in epic fashion.
⚠️ Caution: the odds of a serious correction are high — the chart points to a potential target around $5,650.
Sure, the madness can continue. The Fed can keep printing USD that pours into stocks instead of the real economy — until people are jobless, starving, and rioting for food.
📈 Enjoy the rally while it lasts, but use stop-losses. This market is dangerously overheated.
BITCOIN BULLISH MOMENTUM CONTINUATION? 125K Still possible?BTC/USDT 1H – Breakout Setup
Cup & Handle forming right under FVG zone, showing early bullish intent.
Recent tariff crash created the swing low and possible reaccumulation zone.
POC: 121K — strong magnet if price breaks higher.
Key Levels:
🔹 115K → Breakout confirmation level
🔹 120K → Mid FVG / Resistance
🔹 121K → POC target
🔹 125K → Next liquidity zone
🔹 110K / 105K / 100K → Downside supports
Bullish case:
Close above 115K = breakout → target 121K–125K (FVG fill + liquidity grab).
Bearish case:
Fail to hold 115K → drop to 110K → 105K → 100K possible.
Summary:
Cup & Handle under FVG + tariff crash low = potential bullish reversal zone.
Watch 115K — that’s the key trigger for direction.

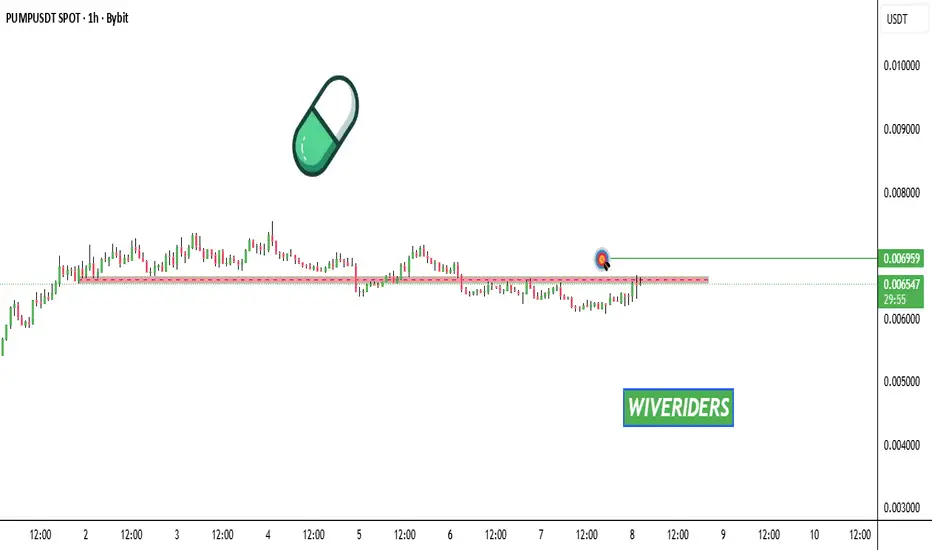
$PUMP Update📊 NYSE:PUMP Update
NYSE:PUMP is testing the red resistance zone 🔴
If it breaks out, the first target will be the green line level 🟢
NEAR – Post-Breakout Impulse in Play!NEAR has already broken out of its accumulation phase, confirming the end of its consolidation and the start of a fresh impulsive leg within the macro falling channel.
As long as price holds above the $2.80–$3.00 breakout zone, the bullish structure remains intact, with the next targets at $4.20–$4.80 and potentially $6.00–$7.00 — the upper boundary of the channel and a key confluence zone.
If price slips back below $2.80, it would signal a failed breakout and a possible retest of the previous lows.
⚠️ Disclaimer: This is not financial advice. Always do your own research and manage risk properly.
📚 Stick to your trading plan regarding entries, risk, and management.
Good luck! 🍀
All Strategies Are Good; If Managed Properly!
~Richard Nasr

