DexeDexe usdt Daily analysis
Risk rewards ratio >5 👈👌
Time frame daily
First target =16$
2th target = 19.5 $
Stop is very tight. Below of support line.
If price break the support line and my stop , I don't lose because it's very tight. On the other hand, if price reach to my target , I get good benefit
Pump

BTCBtc usdt Daily analysis
Time frame hourly
Risk rewards ratio =2
Target 107.000$
LS is very tightly so I have no problem with stop hunters
Btc is charging its energy to pump and reach the new high

TronTrx usdt Daily analysis
Time frame hourly
Short time Target 0.278 $
Risk rewards ratio >3.5 👈👌
This short time analysis is in the big Daily analysis that you can see in my forecasts before

Aptus Apt usdt Daily analysis
Time frame daily
Risk rewards ratio >2 👈👌
Target 7.4$
Pattern = two bottom

Maker (MKR)MKR usdt Daily analysis
Time frame 4hours
Risk rewards ratio =2 👈👌
Target 2400$
Now is a good opportunity to break the 1930$ resistance and reach to the next resistance area in 2400$
But if mkr can't break this resistance, will fall down to 1600$

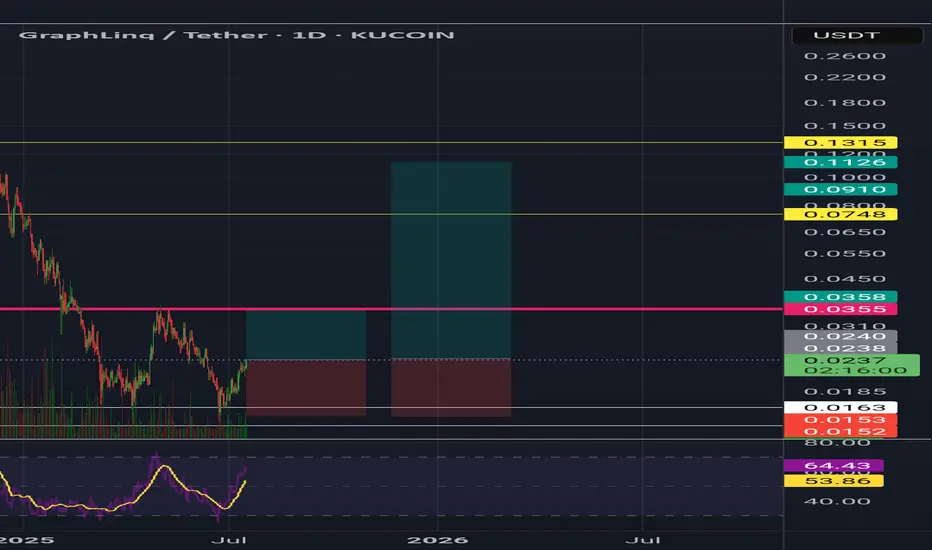
Graph link GLQ usdt Daily analysis
Time frame daily
first target =0.0355$
Risk rewards ratio >1.3 👈
Second target = 0.112$
Risk rewards ratio =10 👈👌👈👈👈👈
Don't forget this asset
#BIGTIME #BIGTIMEUSD #BIGTIMEUSDT #Analysis #Eddy#BIGTIME #BIGTIMEUSD #BIGTIMEUSDT #Analysis #Eddy
A reversal structure has formed on the weekly and daily time frames, and the necessary confirmations have been given on the weekly time frame. Considering the structure formed on the above time frame, as well as the behavior of this currency in the past chart, it is expected that this currency will perform a good pump.
I have identified the important supply and demand zones of the higher timeframe for you.
This analysis is based on a combination of different styles, including the volume style with the ict style.
Based on your strategy and style, get the necessary confirmations for this analysis to enter the trade.
Don't forget about risk and capital management.
The responsibility for the transaction is yours and I have no responsibility for your failure to comply with your risk and capital management.
💬 Note: The red order block cannot stop the growth of the price of this currency and by 0.29 cents this currency will be pumped more than 350%.
Be successful and profitable.

#SONIC #SONICUSD #SONICUSDT #Analysis #Eddy#SONIC #SONICUSD #SONICUSDT #Analysis #Eddy
A reversal structure has formed on the weekly and daily time frames, and the necessary confirmations have been given on the weekly time frame. Considering the structure formed on the above time frame, as well as the behavior of this currency in the past chart, it is expected that this currency will perform a good pump.
I have identified the important supply and demand zones of the higher timeframe for you.
This analysis is based on a combination of different styles, including the volume style with the ict style.
Based on your strategy and style, get the necessary confirmations for this analysis to enter the trade.
Don't forget about risk and capital management.
The responsibility for the transaction is yours and I have no responsibility for your failure to comply with your risk and capital management.
💬 Note: The red order block cannot stop the growth of the price of this currency and by 0.66 cents this currency will be pumped more than 230%.
Be successful and profitable.

#VIRTUAL #VIRTUALUSD #VIRTUALUSDT #Analysis #Eddy#VIRTUAL #VIRTUALUSD #VIRTUALUSDT #Analysis #Eddy
A reversal structure has formed on the weekly and daily time frames, and the necessary confirmations have been given on the weekly time frame. Considering the structure formed on the above time frame, as well as the behavior of this currency in the past chart, it is expected that this currency will perform a good pump.
I have identified the important supply and demand zones of the higher timeframe for you.
This analysis is based on a combination of different styles, including the volume style with the ict style.
Based on your strategy and style, get the necessary confirmations for this analysis to enter the trade.
Don't forget about risk and capital management.
The responsibility for the transaction is yours and I have no responsibility for your failure to comply with your risk and capital management.
💬 Note: The red order block cannot stop the growth of the price of this currency and by 4.20 cents this currency will be pumped more than 200%.
Be successful and profitable.

#BEAM #BEAMX #BEAMXUSD #BEAMXUSDT #Analysis #Eddy#BEAM #BEAMX #BEAMXUSD #BEAMXUSDT #Analysis #Eddy
A reversal structure has formed on the weekly and daily time frames, and the necessary confirmations have been given on the weekly time frame. Considering the structure formed on the above time frame, as well as the behavior of this currency in the past chart, it is expected that this currency will perform a good pump.
I have identified the important supply and demand zones of the higher timeframe for you.
This analysis is based on a combination of different styles, including the volume style with the ict style.
Based on your strategy and style, get the necessary confirmations for this analysis to enter the trade.
Don't forget about risk and capital management.
The responsibility for the transaction is yours and I have no responsibility for your failure to comply with your risk and capital management.
💬 Note: The red order block cannot stop the growth of the price of this currency and by 0.04 cents this currency will be pumped more than 500%.
Be successful and profitable.

#SANDBOX #SAND #SANDUSD #SANDUSDT #Analysis #Eddy#SANDBOX #SAND #SANDUSD #SANDUSDT #Analysis #Eddy
A reversal structure has formed on the weekly and daily time frames, and the necessary confirmations have been given on the weekly time frame. Considering the structure formed on the above time frame, as well as the behavior of this currency in the past chart, it is expected that this currency will perform a good pump.
I have identified the important supply and demand zones of the higher timeframe for you.
This analysis is based on a combination of different styles, including the volume style with the ict style.
Based on your strategy and style, get the necessary confirmations for this analysis to enter the trade.
Don't forget about risk and capital management.
The responsibility for the transaction is yours and I have no responsibility for your failure to comply with your risk and capital management.
💬 Note: The red order block cannot stop the growth of the price of this currency and by 1.20 dollar this currency will be pumped more than 300%.
Be successful and profitable.

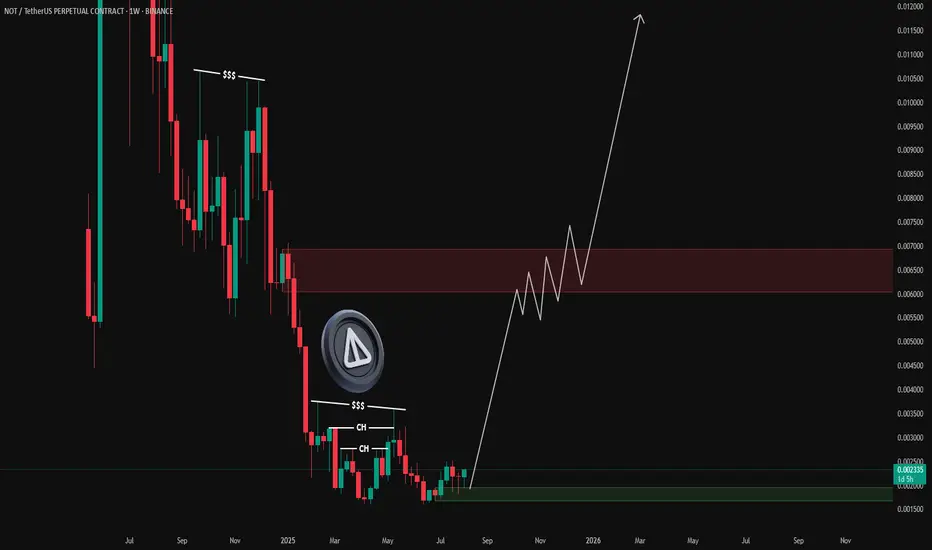
#NOTCOIN #NOT #NOTUSD #NOTUSDT #Analysis #Eddy#NOTCOIN #NOT #NOTUSD #NOTUSDT #Analysis #Eddy
A reversal structure has formed on the weekly and daily time frames, and the necessary confirmations have been given on the weekly time frame. Considering the structure formed on the above time frame, as well as the behavior of this currency in the past chart, it is expected that this currency will perform a good pump.
I have identified the important supply and demand zones of the higher timeframe for you.
This analysis is based on a combination of different styles, including the volume style with the ict style.
Based on your strategy and style, get the necessary confirmations for this analysis to enter the trade.
Don't forget about risk and capital management.
The responsibility for the transaction is yours and I have no responsibility for your failure to comply with your risk and capital management.
💬 Note: The red order block cannot stop the growth of the price of this currency and by 0.01 cents this currency will be pumped more than 400%.
Be successful and profitable.
#YGG #YGGUSD #YGGUSDT #Analysis #Eddy#YGG #YGGUSD #YGGUSDT #Analysis #Eddy
A reversal structure has formed on the weekly and daily time frames, and the necessary confirmations have been given on the weekly time frame. Considering the structure formed on the above time frame, as well as the behavior of this currency in the past chart, it is expected that this currency will perform a good pump.
I have identified the important supply and demand zones of the higher timeframe for you.
This analysis is based on a combination of different styles, including the volume style with the ict style.
Based on your strategy and style, get the necessary confirmations for this analysis to enter the trade.
Don't forget about risk and capital management.
The responsibility for the transaction is yours and I have no responsibility for your failure to comply with your risk and capital management.
💬 Note: The red order block cannot stop the growth of the price of this currency and by 1 dollar this currency will be pumped more than 400%.
Be successful and profitable.

#GALA #GALAUSD #GALAUSDT #Analysis #Eddy#GALA #GALAUSD #GALAUSDT #Analysis #Eddy
A reversal structure has formed on the weekly and daily time frames, and the necessary confirmations have been given on the weekly time frame. Considering the structure formed on the above time frame, as well as the behavior of this currency in the past chart, it is expected that this currency will perform a good pump.
I have identified the important supply and demand zones of the higher timeframe for you.
This analysis is based on a combination of different styles, including the volume style with the ict style.
Based on your strategy and style, get the necessary confirmations for this analysis to enter the trade.
Don't forget about risk and capital management.
The responsibility for the transaction is yours and I have no responsibility for your failure to comply with your risk and capital management.
💬 Note: The red order block cannot stop the growth of the price of this currency and by 10 cents this currency will be pumped more than 400%.
Be successful and profitable.

VerasityVra usdt daily analysis
Time frame daily
Target 0.00377 $
Risk rewards ratio >4.4 👈👌
Vrasityis a high Risk asset but I like it for small and fast benefits
Be carefull
For short time trade set LS tighter

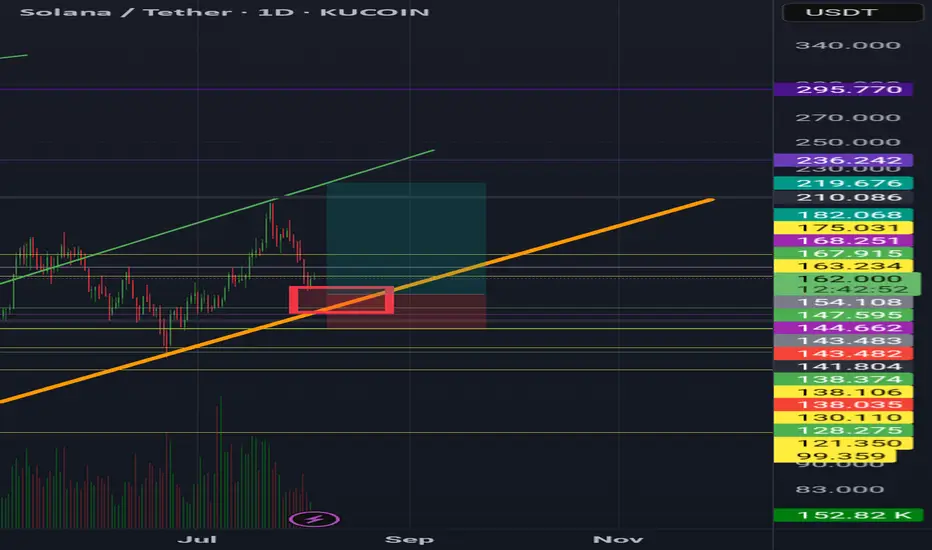
SolanaZol usdt daily analysis
Time frame daily
Position long
Target 219$
Risk rewards ratio >4 👌👈
Red box on the cart is the good erea to entrance long position
Orange uptrend line is a very strong support lines
I guess in this turn of upcoming, solana will reach my target
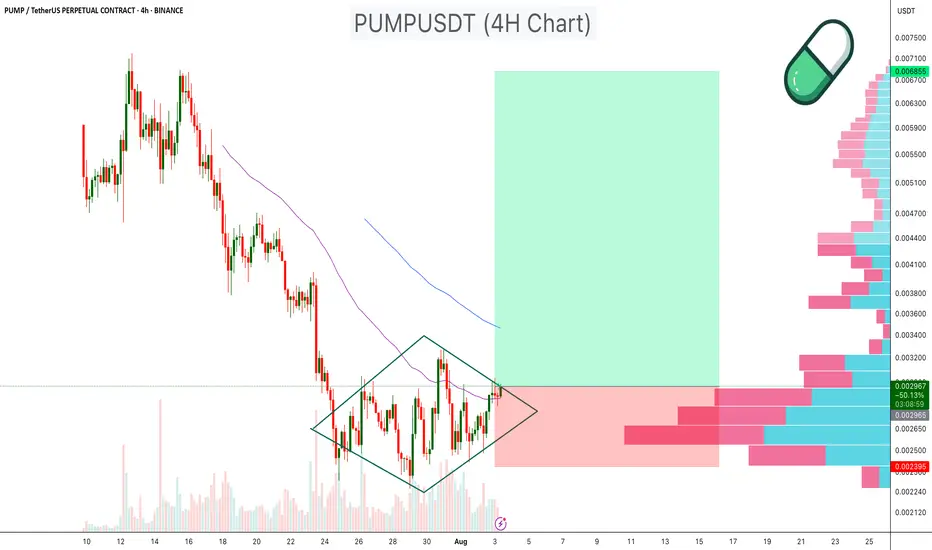
PUMPUSDT Diamond Pattern PUMPUSDT has been consolidating within a diamond chart pattern on the 4 hour timeframe, following a prolonged downtrend. This type of structure signals potential reversal when occurring after a decline.
Diamond Formation: Price is compressing inside converging and diverging trendlines, creating a symmetrical diamond pattern.
Volume Profile Support: Significant volume support is visible in the $0.00240–$0.00250 range, which may act as a strong demand zone.
EMA Resistance: 50 EMA is currently positioned above the price, serving as dynamic resistance.
Breakout Potential: A breakout above the diamond resistance, especially with increased volume, could target the $0.005 –$0.007 zone, representing a major upside move.
Cheers
Hexa
NYSE:PUMP BYBIT:PUMPUSDT
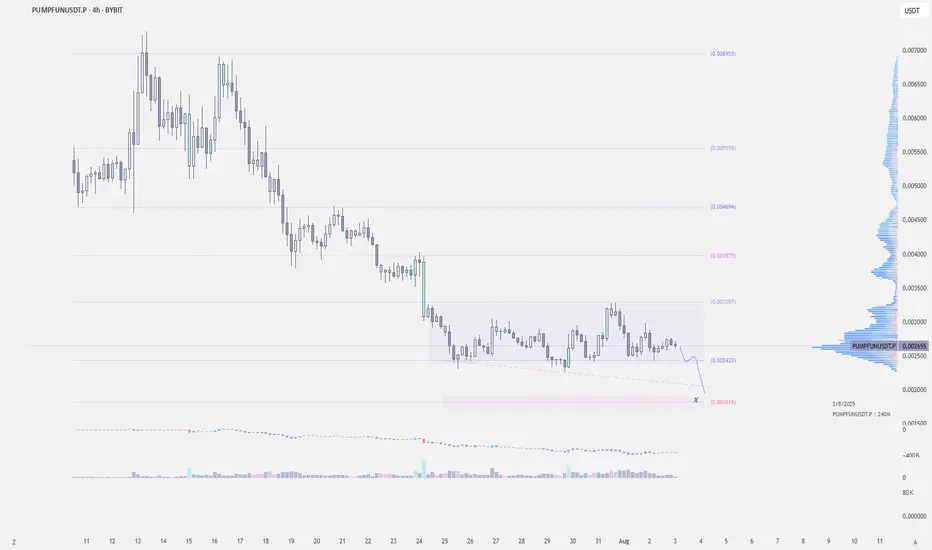
$PUMP May Still Dump to .0020-.0018BYBIT:PUMPUSDT | 4h
PUMPFUN is one of the few coins still holding support during the dump.
It’s looking tempting here, but a drop to the 0.0021–0.0018 zone is still likely.
Planning to long around 0.0021–0.0018
Targets:
.0028-.0032
.0037-.0040
.0045-.0048

ALCH / Usdt BINANCE:ALCHUSDT.P
### ALCH / TetherUS Perpetual Contract (1h) - Binance
- **Price**: 0.16361 (-0.44%, -0.00073)
- **High/Low**: 0.16458 / 0.16310
- **Buy/Sell**: 0.16356 (BUY) / 0.16353 (SELL)
- **Levels**: Support at 0.16029, Resistance at 0.17000
- **CVD (1D)**: Mixed volume (1.17M to 1.53M)
- **OI (Open Interest)**: ~407M (stable)
- **Volume (ALCH)**: 1.2M
- **Sentiment (Trendmaster)**: Neutral (51.79M)
**Summary**: Slight bearish movement, low volatility, neutral sentiment. Watch key levels (0.16029 support, 0.17000 resistance).
Disclaimer : Not Financial Advice

PUMPUSDT: Bullish Breakout and Retest - A Potential 34% Upside?Hello, traders!
Today we're looking at the PUMP/USDT pair on the 4-hour timeframe, and a very clean technical setup is unfolding that points towards potential bullish continuation. Let's break down the key elements of this analysis.
The Analysis
The chart presents a classic breakout and retest scenario, which is often a strong indicator of a trend reversal or continuation.
Descending Trendline Breakout: The most significant feature is the decisive breakout from a major descending trendline that had been capping the price for a considerable period. Breaking this trendline is a primary signal that the previous bearish momentum is weakening and buyers are starting to take control.
Break of Horizontal Resistance (S/R Flip): Following the trendline break, the price also successfully pushed through a key horizontal resistance zone, identified on the chart between approximately $0.002966 and $0.003044. This level has now, as expected, turned into a new support base.
The Retest: We are currently witnessing a pullback to this newly established support zone. This "retest" is a critical phase. A strong bounce from this level would confirm the breakout's validity and suggest that the market has accepted this price floor, paving the way for the next leg up.
Volume Confirmation: Notice the volume bars at the bottom of the chart. There was a visible spike in volume during the initial breakout candles, which adds conviction to the move. It indicates that the breakout was backed by significant buying interest.
The Trade Idea
Based on this structure, a potential long opportunity presents itself.
Entry: A favorable entry point could be found within the current support zone ($0.002966 - $0.003044), especially upon seeing confirmation of a bounce (e.g., a bullish engulfing candle or a hammer on the 4H or 1H chart).
Target: The analysis points to a primary target at the next major resistance level, located around the $0.004000 psychological mark. As measured on the chart, this represents a potential upside of over 34%.
Invalidation: This bullish outlook would be invalidated if the price fails to hold the current support and decisively closes back below the $0.002966 level. Placing a stop-loss below this zone is a prudent risk management strategy.
Conclusion
In summary, PUMPUSDT is displaying a textbook bullish setup. The combination of a trendline breakout, an S/R flip, and a live retest offers a compelling case for potential upside. As always, manage your risk carefully and wait for your preferred confirmation signals before entering a trade.
Disclaimer: This is not financial advice. The analysis provided is for educational and informational purposes only. Trading cryptocurrencies involves a high level of risk. Please conduct your own research and risk assessment before making any investment decisions.

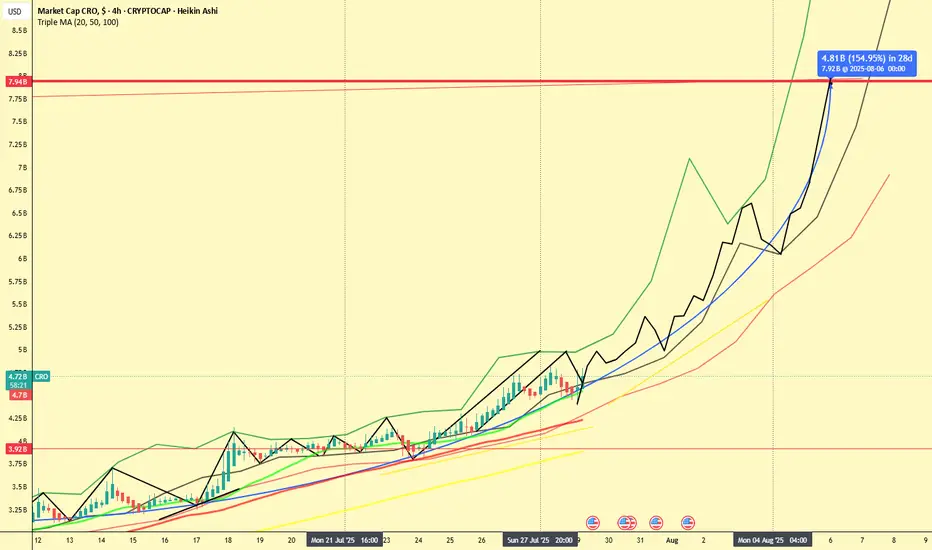
CRO 2x in 7 Days? Chart Hints at Explosive Move!📆 July 29, 2025
📍 CRO Market Cap (4H Heikin Ashi - Historical Projection Analysis)
If this chart doesn’t scream "Breakout Incoming", I don’t know what does.
CRO (Crypto.com) is showing signs of a massive 154% move incoming — and it might all happen within 7 days, according to the current market cap projection.
🔍 Chart Breakdown
The chart combines:
Heikin Ashi candles on 4H timeframe
Six SMAs (21 to 1000) showing steady incline
A historical path projection (green/black lines) based on earlier fractals
A measured move (blue arrow): from ~$3.9B to ~$7.92B by August 6th
This projection implies a 2x from current levels ($4.72B) — within just a week!
⚠️ 2 Healthy Corrections Already In
Let’s not forget: CRO already had two corrections within this structure — visible in the black zig-zag overlay:
End of July: Quick dip into the SMA cluster
Start of August: Second pullback before resuming trend
These retracements build confidence, as they typically reset indicators before major continuation.
📈 Momentum is Building
Price is respecting all major SMAs (21, 50, 100, 200, 300, 1000)
We’ve re-entered the aggressive uptrend channel
No significant resistance seen until the $7.9B area
🧠 Final Thoughts
Could CRO really double in a week?
If it follows the trajectory mapped by the historical fractal pattern, the odds aren’t as crazy as they seem.
Stay sharp. These setups don't come around often.
💬 Agree or disagree? Drop your thoughts and let's chart it together.
📊 #CRO #CryptoCom #Altseason #FractalAnalysis #HeikinAshi #TradingView
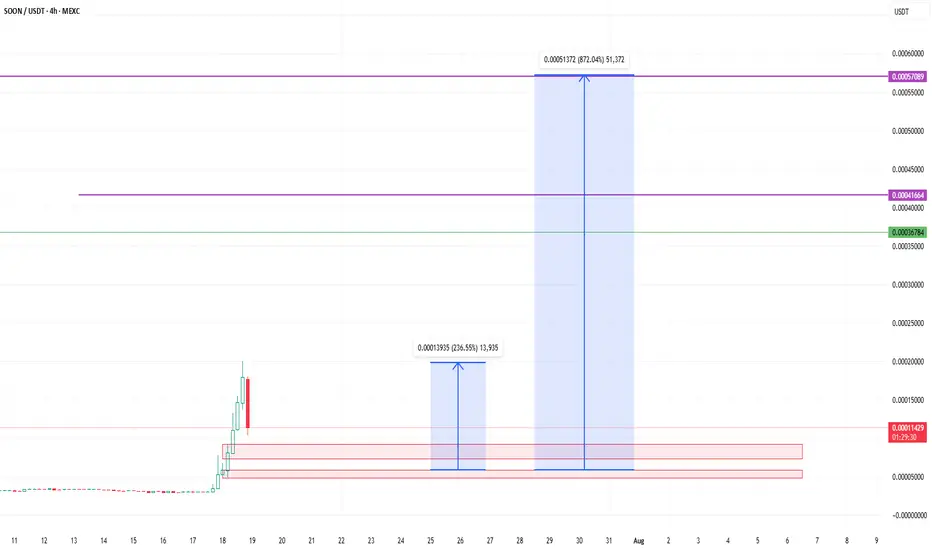
MR SOON GO TO THE MOON with huge commiunity and holder MR soon token is the Best meme for buy noow and a few wait foor a BIG pump so just buy and wait for pump and dont wory be happpy !
MR SOON GO TO THE MOON with huge commiunity and holder
now i am waiting for a very very very BIG PUMP my freind