PUMPUSDT UPDATEPUMP
UPDATE
PUMP Technical Setup
Pattern: Falling Wedge Pattern
Current Price: $0.00226
Target Price: $0.00500 USDT
Target % Gain: 121.24%
Technical Analysis: PUMP is breaking out of a falling wedge pattern on the 1D chart, indicating bullish potential. Price has recently shown strength near the wedge resistance, and a breakout above that level with increasing volume could validate continuation toward the projected target zone near $0.00500. The measured move from the pattern points to extended upside if momentum persists.
Time Frame: 1D
Risk Management Tip: Always use proper risk management.
Pumpbtc

#PUMPUSDT Can $PUMP Pull Off a Second Wave?#PUMP
The price is moving within an ascending channel on the 1-hour timeframe and is adhering to it well. It is poised to break out strongly and retest the channel.
We have a downtrend line on the RSI indicator that is about to break and retest, which supports the upward move.
There is a key support zone in green at 0.002405, representing a strong support point.
We have a trend of consolidation above the 100-period moving average.
Entry price: 0.002567
First target: 0.002700
Second target: 0.002886
Third target: 0.003133
Don't forget a simple money management rule.
Place your stop-loss order below the green support zone.
Once you reach the first target, save some money and then change your stop-loss order to an entry order.
For any questions, please leave a comment.
Thank you.

PUMPBTC showing signs of reversal_Watch for short term upsidePUMPBTC has touched its bottom and is now showing signs of recovery. A short-term bullish move is likely if momentum continues to build.
Always manage risk wisely and wait for confirmation before entering.

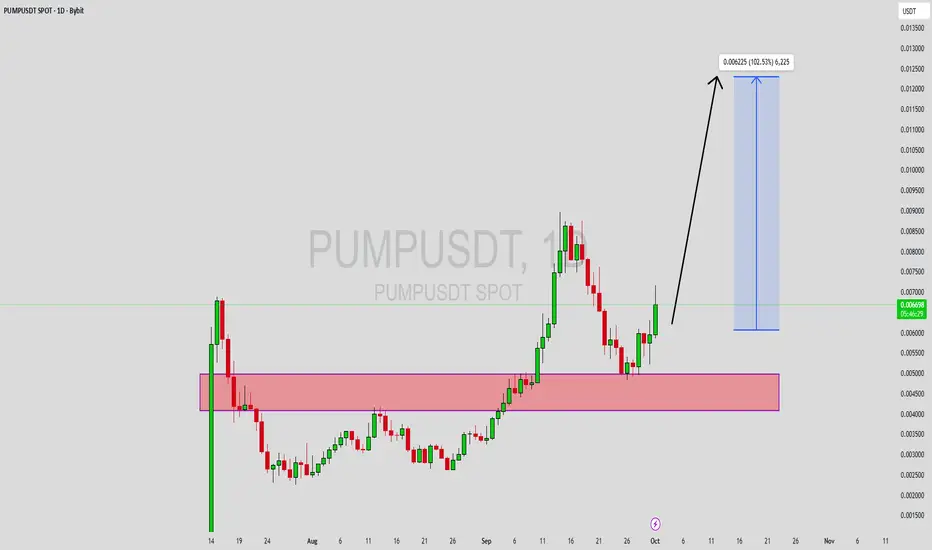
PUMPUSDT Forming Bullish WavePUMPUSDT is showing strong bullish signs as it forms a bullish wave pattern, which often signals the continuation of upward momentum in the market. The chart setup reflects a healthy recovery from consolidation zones, supported by strong buying pressure and increasing market participation. With good volume activity, the conditions are aligning for a potential breakout, targeting a gain projection of nearly 90% to 100%+.
The bullish wave structure indicates that buyers are stepping in at key levels, driving prices higher and building confidence among traders. This technical setup often attracts more participants as breakout signals become clearer, pushing the asset into stronger bullish territory. If the momentum continues, PUMPUSDT could establish itself as a promising short-term and mid-term opportunity in the crypto market.
Investor interest in this project is visibly increasing, with price action confirming growing accumulation. The breakout target zone, as shown on the chart, highlights a significant upside opportunity that aligns with broader bullish sentiment across altcoins. With market conditions favoring growth, PUMPUSDT could be on track to deliver an impressive performance in the coming days.
✅ Show your support by hitting the like button and
✅ Leaving a comment below! (What is You opinion about this Coin)
Your feedback and engagement keep me inspired to share more insightful market analysis with you!
PUMP Analysis (4H)From the point where we placed the red arrow on the chart, it seems that the correction of the PUMP has begun.
It looks like we are inside a larger-degree ABC, where wave B was a symmetrical correction that has just completed, and we are now in wave C.
In the red-marked zone, we are looking for sell/short positions.
Targets are indicated on the chart.
A daily candle closing above the invalidation level will invalidate this analysis.
invalidation level : 0.003910$
For risk management, please don't forget stop loss and capital management
When we reach the first target, save some profit and then change the stop to entry
Comment if you have any questions
Thank You

Why PUMP Price is Facing Sharp Declines and What’s Next?Currently, MEXC:PUMPUSDT is trading at $0.0028 , just under the resistance at $0.0029. The altcoin has marked a 20% drop over the past 24 hours, which is one of its largest single-day declines recently. The lack of bullish momentum and increasing outflows suggest that PUMP may continue to struggle.
Given the market conditions, it is likely that MEXC:PUMPUSDT could fall further. The next support level lies at $0.0024, which would represent another significant loss for investors. If the current trends continue, the altcoin could face even steeper declines, putting its recent lows at risk.
However, if MEXC:PUMPUSDT manages to reclaim the $0.0029 support level , it could see a bounce back. A successful reclaiming of this level could lead to an attempt to recover toward the resistance at $0.0034, invalidating the current bearish outlook.
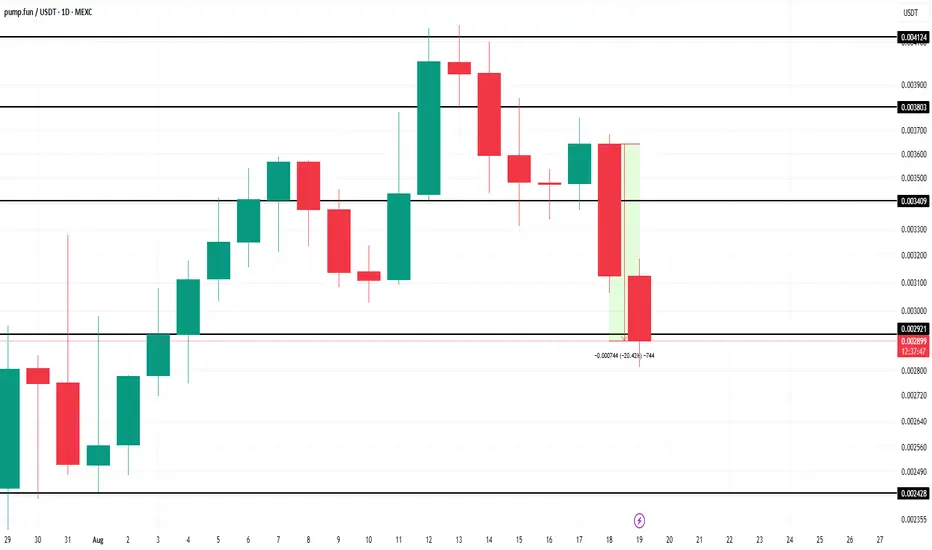
Pump.fun (PUMP) Price Crashes 20% After First Bearish CrossoverMEXC:PUMPUSDT price is currently at $0.003055, down by nearly 20% in the last 24 hours . The MACD (Moving Average Convergence Divergence) indicator, a key tool used to track price momentum, has signaled the first bearish crossover for PUMP token since its launch.
The bearish crossover occurred after a period of rising bullish momentum, signaling that the altcoin may now be facing a downturn.
The token is holding above a key support level of $0.002921 , but this support is fragile. If MEXC:PUMPUSDT fails to maintain this level, it could continue to decline, potentially dropping to $0.002499 . This would confirm the continuation of the downtrend, and the price could fall further.
On the other hand, if MEXC:PUMPUSDT manages to hold its ground at $0.002921, it could experience a bounce back. This would allow the altcoin to rise towards $0.003803, potentially invalidating the current bearish thesis and pushing the price past the resistance of $0.004124 . The next few days will be critical in determining if PUMP can recover from its recent losses.

Where Should We Rebuy The PUMP? (8H)With the large bearish master candle formed at the top, the structure has turned bearish.
The green zone is the best and lowest-risk area for long positions or rebuys.
Reaching this zone may take some time, but you can already add this symbol to your watchlist and wait for it to reach the area before entering a position.
A 25%–45% return can be expected from this zone.
A daily candle closing below the invalidation level will invalidate this analysis.
For risk management, please don't forget stop loss and capital management
Comment if you have any questions
Thank You

BTCUSD The meaning of the 20MA for the long-term price trendHello, fellow traders and hodlers,
I've come up with yet another idea, and I know it might sound a bit cliché, but timing is crucial in this case. If we take a look at the entire BTC history, you can see how the price has reacted to the 20 MA.
If we've stayed below it on a weekly timeframe, the price either took a sharp nosedive or lingered beneath the 20 MA for an extended period. As of the moment I'm sharing this idea, the price hasn't crossed the ~27960 mark (currently at 27850), which corresponds to the current 20 MA price value.
In the next two weeks, we need to establish ourselves above this value to even begin talking about potential further growth or at least a hint of it, drawing from Bitcoin's historical trends over the years. However, if we fail to break above the 20 MA, we might end up stuck beneath it for an extended period or even experience a price drop.
Experienced traders are already aware of this nuance, and those who aren't will see and understand what steps to take next (if they grasp what they're doing and can appreciate the value of my idea).
See you in a week or two!
Wishing everyone peace and prosperity!


Rectangular ,triangle everything said we are going for 9400$Hello guys thank your for your time joining my inspect , here is my idea after breaking triangle we have a nice pump and BTC broke trend of rectangular and we are going for 9400$ BTC needs no rest now till 9400$ maybe no rest till 10300$ ?
share your idea please press the like button thank you all for your time

