PUMP it to valhalla meme factory UPDATEPUMP it to valhalla meme factory UPDATE
some hopium for everyone!
all you need is a few lines (no pun).
UPDATE . adjusted fractals/levels because we didn't just continue up right away .
Pumpusd

PUMPin memes funPUMP
meme coin factory
muppets seem to enjoy creating absolutely dog s*&*& tokens for no reason then other muppets seem to like to trade off each other for it...
shovels and all that
volume is big, revenue is big, on solana. sol/btc looks good.
gl
PUMPUSDT — Descending Trendline Break Trigger Trend Reversal!On the 1D timeframe, PUMPUSDT remains in a medium-term downtrend after failing to hold the previous high near the 0.0089 area. Price continues to form lower highs and lower lows, indicating that sellers are still in control. However, recent price action shows buyer reaction from the lower support zone, opening the possibility of a short-term recovery or trend reversal if a breakout is confirmed.
---
Pattern Explanation
Price is trading below a descending trendline (yellow line) acting as a strong dynamic resistance. This structure represents a Descending Trendline / Falling Channel setup, where:
Each bullish attempt is rejected at the trendline
Bearish momentum gradually weakens near the bottom
Price begins to form a minor higher low in late December to early January
This suggests early signs of trend exhaustion, but a valid reversal requires confirmation through a breakout.
---
Key Levels
Resistance Levels:
0.00250 → minor resistance (current reaction area)
0.00307 → mid resistance
0.00340 → key resistance
0.00450 → major resistance
0.00517 → strong supply zone
0.00704 – 0.00858 → upper resistance & previous high
Support Levels:
0.00232 → daily support
0.00205 – 0.00190 → major demand zone
0.00170 → last strong support (bullish invalidation level)
---
Bullish Scenario
A bullish scenario will be confirmed if:
Price breaks and closes above the descending trendline
A strong daily close above 0.00250 is achieved
Bullish targets:
0.00307
0.00340
0.00450
0.00517 (extended target if momentum increases)
As long as price holds above 0.00232 and breaks the trendline, trend reversal potential toward bullish continuation remains valid.
---
Bearish Scenario
The bearish scenario remains valid if:
Price fails to break the trendline
Strong rejection occurs around the 0.00250 area
Price breaks below 0.00205
Bearish targets:
0.00190
0.00170
A breakdown below 0.00170 would confirm bearish continuation and invalidate the bullish setup.
---
Conclusion
PUMPUSDT is currently at a critical decision zone. The broader structure is still bearish, but price action shows early recovery signals. The descending trendline breakout is the key confirmation for a potential trend change. Until then, any upward move should be considered a technical rebound.
---
#PUMPUSDT #PUMP #CryptoAnalysis #TechnicalAnalysis #DescendingTrendline
#BreakoutSetup #Altcoin #CryptoTrading #DailyChart #TrendReversal
#SupportResistance

PUMP/USDT - Decision Time for: Breakout or Breakdown?The PUMP/USDT pair is now sitting at a critical decision zone, forming a large Symmetrical Triangle pattern on the 12H timeframe.
After weeks of reduced volatility and tight consolidation, price action is approaching the apex of the formation — signaling that a major breakout is imminent.
This structure shows a clear battle between buyers and sellers, as the market compresses between a descending resistance line and a rising support line. Momentum is coiling up — and once the breakout occurs, the move that follows is likely to be explosive.
---
Pattern Description
Pattern name: Symmetrical Triangle
Character: Neutral continuation/reversal pattern — depends on breakout direction
Meaning: Momentum is building; the tighter the triangle, the stronger the potential breakout
Confirmation: Breakout candle + strong volume = valid signal
---
Key Technical Levels
Current price: Around 0.00457 USDT
Bullish targets (if breakout occurs):
1. 0.00520 → breakout confirmation zone
2. 0.00710 → mid-range resistance
3. 0.00860 – 0.00898 → final target / previous swing high
Bearish targets (if breakdown happens):
0.00390 → triangle support
0.00330 – 0.00280 → next demand zone
0.00200 → extreme support / potential panic zone
---
Bullish Scenario
A decisive breakout above the descending resistance trendline with rising volume would signal a potential trend reversal.
If the candle closes above 0.00520, price could rally toward 0.00710 and eventually test the 0.0086 – 0.0089 range.
A successful retest of the breakout zone would strengthen the bullish continuation setup.
Ideal confirmation: 12H candle close above resistance + solid volume expansion.
---
Bearish Scenario
If selling pressure dominates and price fails to hold above the lower support trendline (0.0039), the pair could enter a deeper correction phase toward 0.0033 – 0.0028 or even 0.0020 in a panic-driven move.
Such a breakdown would confirm a bearish continuation and a potential retest of previous lows.
---
Conclusion
PUMP/USDT is coiling up tightly inside a symmetrical triangle — a sign that a high-volatility breakout is near.
The longer the price stays compressed within this range, the more explosive the next move will be.
Traders should closely monitor the 0.0045–0.0052 zone for a decisive breakout or breakdown confirmation.
“Big moves are born from tight ranges — and this chart looks ready to erupt.”
#PUMPUSDT #CryptoBreakout #TrianglePattern #TechnicalAnalysis #PriceAction #CryptoTrading #BullishSetup #BearishScenario #VolatilityLoading #ChartAnalysis #SwingTrade

$PUMP Pumping Hard this Bull Run $0.011220 in 2026 NYSE:PUMP COIN INFO
Support Level Price $0.002259 and Resistance level price $0.008969 and it's a Historical ATH level price $0.008999 , in 2026 parabalic bull run price will rising $0.011222 surge 222% Roi in 3 months
Pump.fun’s native token PUMP has quickly become one of the most talked-about memecoins in the Solana ecosystem. Built as a creator-first launchpad, Pump.fun lets communities directly back their favorite creators while sharing in their success.
With its viral “no-code” model, Pump.fun aims to disrupt traditional Web2 social platforms and carve a dominant role in Solana’s DeFi landscape.As of writing, the PUMP price has proven to be a bigger attraction after showing fantastic price action in Q3 2025. As a result, the token has surged in popularity across exchanges and social media, and many experts are raising questions about its potential to climb even higher in the coming years.
Major Developments That Fueled PUMP’s Rally
The Q3 saw many altcoin’s rally including PUMP, this happened with a trigger from Binance US listing. It turned out as a major catalyst for the surge in PUMP price, accompanied by a 350 million PUMP reward campaign that caught traders’ attention. In September alone, PUMP gained over 180% to $0.00899 creating a new ATH before a pullback.
Meanwhile, Pump.fun has been using more than 98% of its platform revenue to buy back tokens, directly supporting price action. This aggressive strategy has turned Pump.fun into one of the most profitable DeFi projects on Solana, boosting trader confidence.
PUMP.Fun Price Analysis For October 2025
From a short-term technical viewpoint, the PUMP price chart showed significant strength in Q3, marked by a breakout from a slanted double-bottom pattern. This bullish momentum successfully drove the price to an All-Time High (ATH) of $0.00899 by mid-September.
Following the ATH, a period of profit-taking began, which was severely accelerated and worsened by a massive market liquidation event from Oct. 10 to 11.
This event was triggered by the re-emergence of conflicts between the US and China over trade tariffs, which rattled not just the crypto sector but the entire financial landscape. This pressure pushed the PUMP price down sharply to the critical support area of $0.0035 to $0.0036. Investors are trying to sustain the price damages at this foundational support, as a reason why its consolidating at support, currently.
Pump.fun Price Surges – Is $0.0075 Possible?
Pump.fun has walked into October with a powerful burst, as its price jumps up by 16.55% overnight to $0.006422. With a market cap now towering at $2.26 billion and trading volume spiking 37.53% in 24 hours, Pump.fun sits squarely in the crypto spotlight. This momentum isn’t coming out of nowhere, as I’m seeing decisive moves by major holders, explosive social buzz, and promising technical signals. Let’s break down what’s fueling this trend and what could come next.
Why is PUMP’s Price Up?
Pump.fun’s recent price surge is rooted in three interconnected factors. First, whale accumulation is picking up big-time. Over 24,000 wallet addresses now hold at least 10,000 PUMP tokens, matching a massive 70% price run in September. In my view, when whales move in sync, it often sparks broader investor confidence and can preface new highs. However, with 60% of ICO-era whales still in play, there’s the risk of sudden profit-taking if these giants decide to cash out.
Second, social media is supercharging attention, but not without controversy. Solana’s Anatoly Yakovenko recently called Pump.fun a contender to rival TikTok. Thereby, citing its livestreaming tools and crypto-native monetization twist. That comment alone stoked a fresh wave of speculation and saw the token climb 90% over the past month. Still, protocol revenue has actually fallen 72% in the last two weeks, and fewer fresh tokens are launching, signaling a possible cooling off beneath all the hype.
PUMP Price Analysis
Technically speaking, Pump.fun price has reclaimed its 7-day SMA at $0.0055 and now eyes the $0.0075 resistance. The 4-hour chart shows a clear ascending channel, suggesting traders expect more upside. The RSI sits at 64.95, under the classic overbought threshold, which means there’s still some runway before euphoria peaks.
Is it safe to invest now, considering whale activity?
Whale moves can lift prices but also cause sharp drops if they exit. If Pump.fun holds above $0.0065, it could be bullish, but watch for signs of profit-taking or declining protocol engagement.
Where is resistance, and what comes next?
Immediate resistance sits around $0.0075, breaking above this could confirm a new uptrend.
#Write2Earn #BinanceSquareFamily #Binance #PUMP #SUBROOFFICIAL
Disclaimer: This article is for informational purposes only and does not constitute financial advice. Always conduct your own research before making any investment decisions. Digital asset prices are subject to high market risk and price volatility. The value of your investment may go down or up, and you may not get back the amount invested. You are solely responsible for your investment decisions and Binance is not available for any losses you may incur. Past performance is not a reliable predictor of future performance. You should only invest in products you are familiar with and where you understand the risks. You should carefully consider your investment experience, financial situation, investment objectives and risk tolerance and consult an independent financial adviser prior to making any investment.

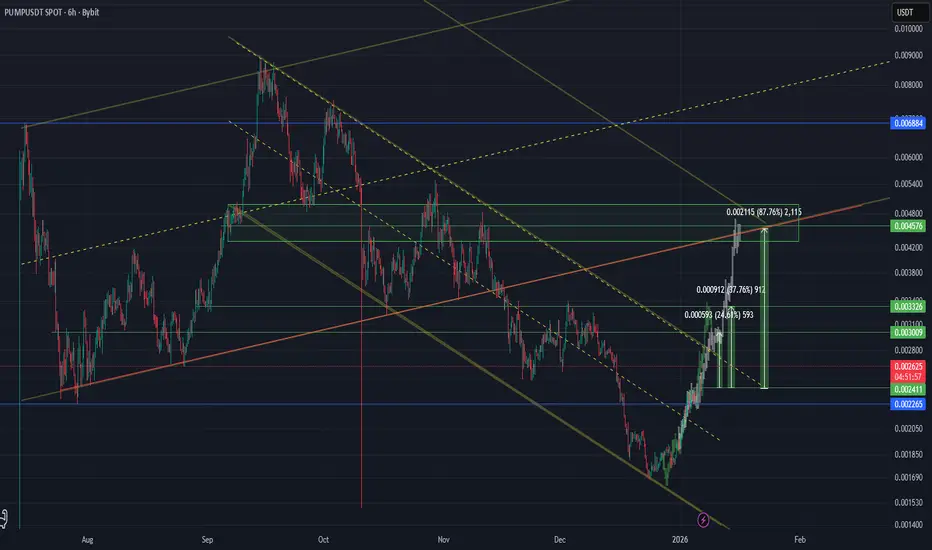
PUMP/USDT – Retest Trendline: Bullish or Bearish Continuation?🔎 Market Structure & Pattern
PUMP/USDT is showing signs of momentum shift after being trapped in a prolonged downtrend. The major descending trendline (yellow) — which has consistently acted as a dynamic resistance — has finally been broken to the upside.
This signals the potential transition from a distribution/sideways phase into an accumulation → expansion phase.
The 0.0030 – 0.0032 zone (yellow box) is now a key support area. Previously it acted as a strong resistance, but after the breakout, the zone is being retested (role reversal). How the price reacts here will determine the next major move.
---
📈 Bullish Scenario
Condition: Price holds above 0.0030–0.0032 after the breakout.
Additional confirmation: Strong 6H/Daily close above the trendline with rising volume.
Upside targets:
R1: 0.003692
R2: 0.004108
R3: 0.004459
R4: 0.005521
R5: 0.006779 – 0.006891 (previous high)
If these levels are cleared one by one, the structure will officially shift into higher highs & higher lows, confirming a trend reversal.
---
📉 Bearish Scenario
Condition: Price fails to hold above 0.0030–0.0032 and closes back below the support zone.
Additional confirmation: Strong bearish rejection at R1–R2 with patterns like bearish engulfing or shooting star.
Downside targets:
First support: 0.0028
Key structural low: 0.002254
If this happens, the current breakout will be considered a false breakout, and the long-term downtrend may continue.
---
⚖️ Conclusion
The market is currently at a critical juncture.
A confirmed hold above 0.0030–0.0032 could open the door for a rally towards 0.0044 → 0.0055 → 0.0067.
Failure to hold this support, however, may send the price back to 0.002254.
Risk management is essential — keep tight stop-losses below the support zone.
---
🚀 PUMP/USDT (6H) Trendline Breakout
Price has broken out of the major downtrend and is now retesting the 0.0030–0.0032 key support zone.
📈 If the zone holds → potential rally towards 0.003692 / 0.004108 / 0.004459 / 0.005521 / 0.006779.
📉 If the zone fails → watch for downside continuation to 0.002254.
🔥 The market is at a decisive point — watch price action closely.
(Not financial advice — always apply proper risk management.)
#PUMPUSDT #Crypto #Altcoins #Breakout #Trendline #TechnicalAnalysis #PriceAction #SwingTrade #CryptoTrading #RiskManagement

PUMP Analysis (4H)From the point where we placed the red arrow on the chart, it seems that the correction of the PUMP has begun.
It looks like we are inside a larger-degree ABC, where wave B was a symmetrical correction that has just completed, and we are now in wave C.
In the red-marked zone, we are looking for sell/short positions.
Targets are indicated on the chart.
A daily candle closing above the invalidation level will invalidate this analysis.
invalidation level : 0.003910$
For risk management, please don't forget stop loss and capital management
When we reach the first target, save some profit and then change the stop to entry
Comment if you have any questions
Thank You

Big Gains Ahead As Pump .fun Eyes 0.0041 Breakout MoveHello✌️
Let’s analyze pump .fun’s price action both technically and fundamentally 📈.
🔍Fundamental analysis:
PUMP. FUN is shifting focus to curated CTO tokens with revenue-sharing, but real success depends on turning hype-driven traders into long-term ecosystem users 🔄
📊Technical analysis:
There are strong indications that this may not be the final leg of the move for BYBIT:PUMPUSDT 📈 A further upside of at least 25 percent remains on the table, with 0.0041 as the next key target.
✨We put love into every post!
Your support inspires us 💛 Drop a comment we’d love to hear from you! Thanks, Mad Whale

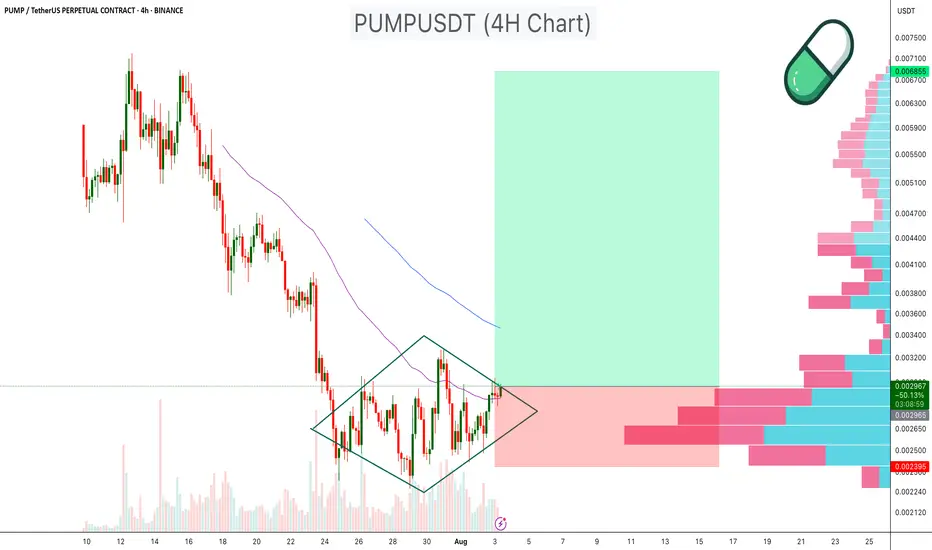
PUMPUSDT Diamond Pattern PUMPUSDT has been consolidating within a diamond chart pattern on the 4 hour timeframe, following a prolonged downtrend. This type of structure signals potential reversal when occurring after a decline.
Diamond Formation: Price is compressing inside converging and diverging trendlines, creating a symmetrical diamond pattern.
Volume Profile Support: Significant volume support is visible in the $0.00240–$0.00250 range, which may act as a strong demand zone.
EMA Resistance: 50 EMA is currently positioned above the price, serving as dynamic resistance.
Breakout Potential: A breakout above the diamond resistance, especially with increased volume, could target the $0.005 –$0.007 zone, representing a major upside move.
Cheers
Hexa
NYSE:PUMP BYBIT:PUMPUSDT
PUMPUSDT at a Decisive Turning Point – Breakout or Breakdown?
🧠 Technical Overview:
PUMPUSDT has been in a sustained downtrend over the past several days, forming a clearly defined descending trendline that has acted as a dynamic resistance since mid-July. Now, the price is approaching this key level once again—and this time, momentum seems to be shifting.
Interestingly, the current structure is forming what appears to be a potential Inverse Head and Shoulders (IH&S) pattern, a well-known bullish reversal formation. If confirmed with a breakout above the neckline/trendline, this could spark a strong upward reversal.
---
📌 Key Technical Highlights:
Descending Resistance Line: Holding since July 15, acting as the primary ceiling on price action.
Inverse Head and Shoulders Pattern: Potential bullish reversal setup forming on the 2H chart.
Volume: Currently low but showing signs of increase near the potential breakout zone—a bullish early signal.
---
📈 Bullish Scenario (Breakout Confirmation):
If the price successfully breaks and closes above the yellow trendline, especially with a strong candle and volume confirmation, we could see a momentum-driven rally toward the following targets:
1. ✅ $0.003614 – Minor resistance zone
2. ✅ $0.003917 – Retest of previous consolidation structure
3. ✅ $0.004441 – Measured move target from IH&S pattern
4. ✅ $0.005251 – 0.618 Fibonacci retracement area
5. ✅ $0.006795 – Major swing high and liquidity zone
> Potential upside of 100%+ from current levels if momentum continues.
---
📉 Bearish Scenario (Trendline Rejection):
If the price fails to break above the trendline and faces another strong rejection, then sellers could regain control, leading to:
⛔ $0.002500 – Psychological support and consolidation base
⛔ $0.001950 – Local bottom and potential long-term entry zone
> A failed breakout could trigger a quick sell-off or stop-loss cascade below the IH&S setup.
---
🔍 Technical Summary:
Indicator Status
Descending Trendline Actively being tested
Volume Increasing near breakout zone
RSI Rising from oversold territory
Price Pattern Inverse Head & Shoulders (Potential Reversal)
Risk/Reward High, favoring breakout strategy
---
🧭 Strategy Suggestions:
Aggressive Entry: Enter on breakout candle close above trendline with volume confirmation.
Conservative Entry: Wait for breakout + successful retest of the trendline before entering.
Stop Loss: Below neckline or recent swing low (~$0.0025).
Take-Profit Zones: $0.0039, $0.0044, $0.0052 and beyond.
---
🧠 Final Thoughts:
> “Charts never lie—PUMPUSDT is building pressure beneath a key resistance. If it breaks, the move could be explosive. Are you ready to ride the wave?”
Microcap altcoins often fly under the radar—until they don’t. This setup is showing the classic signs of a potential breakout. Use sound risk management and watch the next candle closely.
#PUMPUSDT #CryptoBreakout #InverseHeadAndShoulders #TechnicalAnalysis #AltcoinSetup #PumpFun #BreakoutAlert #MicrocapGems #CryptoReversal #ChartPatterns #CryptoSignal #CryptoStrategy

Where Should We Rebuy The PUMP? (8H)With the large bearish master candle formed at the top, the structure has turned bearish.
The green zone is the best and lowest-risk area for long positions or rebuys.
Reaching this zone may take some time, but you can already add this symbol to your watchlist and wait for it to reach the area before entering a position.
A 25%–45% return can be expected from this zone.
A daily candle closing below the invalidation level will invalidate this analysis.
For risk management, please don't forget stop loss and capital management
Comment if you have any questions
Thank You
