PUMP Update🚨📊 PUMP Update
After a strong uptrend,
price has now formed LH and LL ❌📉.
This indicates a short-term bearish structure.
Price could continue lower
toward the important blue support zone 🔵,
where a reaction may occur.
Watching this level closely,
buyer response will be key.
PUMPUSDT

PUMPUSDT: Inverse Head & Shoulders Signals Trend Reversal- PUMPUSDT is forming a clear inverse Head & Shoulders pattern on the 12H timeframe, signaling a potential trend reversal after a prolonged downtrend.
- The left shoulder, head, and right shoulder are well-defined, showing improving market structure.
- Price is currently testing the neckline resistance, which also aligns with a descending trendline acting as a key decision zone.
- A confirmed breakout and close above the neckline could trigger strong bullish continuation.
- Volume profile shows relatively thin resistance above the neckline, increasing the probability of a fast upside move if buyers step in.
Cheers
Hexa

PUMP NEXT SHORT TARGET IS $0.002360Give this idea a thumbs up if you agree 👍
Pumpusdt 1hr timeframe chart is trending downward to the previous low

PUMPUSDT Forming Falling WedgePUMPUSDT is forming a clear falling wedge pattern, a classic bullish reversal signal that often indicates an upcoming breakout. The price has been consolidating within a narrowing range, suggesting that selling pressure is weakening while buyers are beginning to regain control. With consistent volume confirming accumulation at lower levels, the setup hints at a potential bullish breakout soon. The projected move could lead to an impressive gain of around 190% to 200% once the price breaks above the wedge resistance.
This falling wedge pattern is typically seen at the end of downtrends or corrective phases, and it represents a potential shift in market sentiment from bearish to bullish. Traders closely watching PUMPUSDT are noting the strengthening momentum as it nears a breakout zone. The good trading volume adds confidence to this pattern, showing that market participants are positioning early in anticipation of a reversal.
Investors’ growing interest in PUMPUSDT reflects rising confidence in the project’s long-term fundamentals and current technical strength. If the breakout confirms with sustained volume, this could mark the start of a fresh bullish leg. Traders might find this a valuable setup for medium-term gains, especially as the wedge pattern completes and buying momentum accelerates.
✅ Show your support by hitting the like button and
✅ Leaving a comment below! (What is your opinion about this Coin?)
Your feedback and engagement keep me inspired to share more insightful market analysis with you!

$PUMP Buyback PressurePumpFun active wallets are creeping back up, and the on-chain meme space is starting to pull liquidity in again. PUMP also got a nice lift after the creator callout feature dropped.
PUMP is starting to look pretty interesting here — reclaiming the range low with clean bullish structure. Price defended the 0.0020 level, even while a bunch of coins were getting smoked.
If CRYPTOCAP:BTC stays cooperative, I can see this being one of the better runners in the next few days. Bitcoin is stalling below the 96k resistance after tagging 97.9k. If we start losing 95k, I think PUMP can still retest the .0024–.0020 area.

PUMP it to valhalla meme factory UPDATEPUMP it to valhalla meme factory UPDATE
some hopium for everyone!
all you need is a few lines (no pun).
UPDATE . adjusted fractals/levels because we didn't just continue up right away .

PUMPin memes funPUMP
meme coin factory
muppets seem to enjoy creating absolutely dog s*&*& tokens for no reason then other muppets seem to like to trade off each other for it...
shovels and all that
volume is big, revenue is big, on solana. sol/btc looks good.
gl
PUMP ready to go higher 14% gain toward 0.0028$ hi
BYBIT:PUMPUSDT has completed the breakout of the descending channel to the upside and if breakout of the next 2 daily resistance area happen we can see more gain at least 14% toward 0.0028$

PUMP/USDT: Memecoin at Critical Resistance – Doji Pattern Signal🚀 PUMP-USDT is back in the spotlight — and it’s hitting something big:
✅ 5-MONTH RESISTANCE (since Sept 2025)
✅ DOJI Pattern forming at key resistance level — a true battleground of sentiment
✅ The overall trend is falling since beginning
📊 What’s a DOJI?
A Doji is that neutral, indecisive moment on the chart where bulls and bears are locked in a stalemate.
- No clear momentum.
- Sentiment is split — bullish hopes vs bearish caution.
- The market is “thinking”… waiting for a trigger.
💥 This is EXACTLY what we see now:
A Memecoin with wild energy
Trapped at its strongest resistance since launch
And now, a Doji / Spinning Top forming right at the top
⚠️ That’s not a signal to go long. That’s a warning sign.
When a memecoin hits multi-month resistance and forms a DOJI?
→ Bull retracement is exhausted.
→ Bear pressure is building.
🎯 Our call: SHORT PUMP-USDT
Wait for confirmation — a rejection candle or volume spike down — then enter.
This isn’t FOMO. It’s smart timing.
💬 What’s your take?
Are you riding the wave… or preparing for the drop?
👇 Drop your view below — let’s see who’s thinking ahead!

PUMPUSDT UPDATEPUMP
UPDATE
PUMP Technical Setup
Pattern: Falling Wedge Pattern
Current Price: $0.00226
Target Price: $0.00500 USDT
Target % Gain: 121.24%
Technical Analysis: PUMP is breaking out of a falling wedge pattern on the 1D chart, indicating bullish potential. Price has recently shown strength near the wedge resistance, and a breakout above that level with increasing volume could validate continuation toward the projected target zone near $0.00500. The measured move from the pattern points to extended upside if momentum persists.
Time Frame: 1D
Risk Management Tip: Always use proper risk management.

PUMPUSDT — Descending Trendline Break Trigger Trend Reversal!On the 1D timeframe, PUMPUSDT remains in a medium-term downtrend after failing to hold the previous high near the 0.0089 area. Price continues to form lower highs and lower lows, indicating that sellers are still in control. However, recent price action shows buyer reaction from the lower support zone, opening the possibility of a short-term recovery or trend reversal if a breakout is confirmed.
---
Pattern Explanation
Price is trading below a descending trendline (yellow line) acting as a strong dynamic resistance. This structure represents a Descending Trendline / Falling Channel setup, where:
Each bullish attempt is rejected at the trendline
Bearish momentum gradually weakens near the bottom
Price begins to form a minor higher low in late December to early January
This suggests early signs of trend exhaustion, but a valid reversal requires confirmation through a breakout.
---
Key Levels
Resistance Levels:
0.00250 → minor resistance (current reaction area)
0.00307 → mid resistance
0.00340 → key resistance
0.00450 → major resistance
0.00517 → strong supply zone
0.00704 – 0.00858 → upper resistance & previous high
Support Levels:
0.00232 → daily support
0.00205 – 0.00190 → major demand zone
0.00170 → last strong support (bullish invalidation level)
---
Bullish Scenario
A bullish scenario will be confirmed if:
Price breaks and closes above the descending trendline
A strong daily close above 0.00250 is achieved
Bullish targets:
0.00307
0.00340
0.00450
0.00517 (extended target if momentum increases)
As long as price holds above 0.00232 and breaks the trendline, trend reversal potential toward bullish continuation remains valid.
---
Bearish Scenario
The bearish scenario remains valid if:
Price fails to break the trendline
Strong rejection occurs around the 0.00250 area
Price breaks below 0.00205
Bearish targets:
0.00190
0.00170
A breakdown below 0.00170 would confirm bearish continuation and invalidate the bullish setup.
---
Conclusion
PUMPUSDT is currently at a critical decision zone. The broader structure is still bearish, but price action shows early recovery signals. The descending trendline breakout is the key confirmation for a potential trend change. Until then, any upward move should be considered a technical rebound.
---
#PUMPUSDT #PUMP #CryptoAnalysis #TechnicalAnalysis #DescendingTrendline
#BreakoutSetup #Altcoin #CryptoTrading #DailyChart #TrendReversal
#SupportResistance

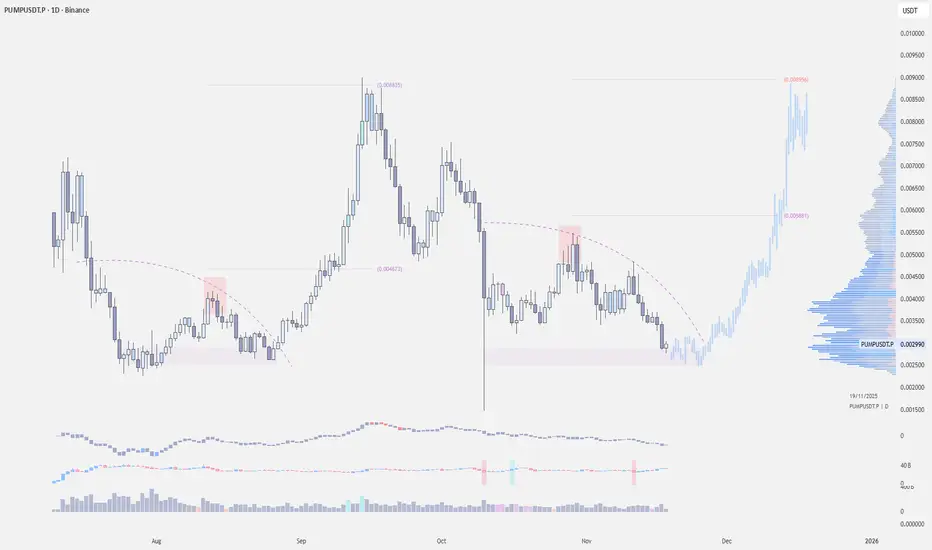
$PUMP to 0.0030Recent fund movements tied to Pump.fun have sparked fresh discussion across crypto circles about whether the platform’s revenue reflects normal business activity or leans toward aggressive value extraction. On-chain data and industry chatter have both added fuel to that debate.
Technical Outlook:
From a technical perspective, the daily chart shows price nearly filling the 10/10 liquidation wick and currently holding the 0.0016 level. If the broader market gets a relief bounce this quarter and Bitcoin can stabilize above 85k, I think PUMP has room to revisit the 0.0024–0.0028 zone, with a potential extension toward 0.0034–0.0036 after that.

PUMP ready for uper levels %40 gain toward $0.004080Hi the support and resistances on the chart are based on the previous data and weekly candlesticks if BYBIT:PUMPUSDT holds this last support the potential of 40% gain is logical toward 0.004080$

PUMP Update🚨📊 PUMP Update
PUMP has also formed a new resistance zone in red 🔴.
This level is now acting as a strong ceiling,
and price must break out above this red resistance
to show any real bullish momentum again.
Until that breakout happens,
sellers remain in control and upside stays limited.

#PUMPUSDT Can $PUMP Pull Off a Second Wave?#PUMP
The price is moving within an ascending channel on the 1-hour timeframe and is adhering to it well. It is poised to break out strongly and retest the channel.
We have a downtrend line on the RSI indicator that is about to break and retest, which supports the upward move.
There is a key support zone in green at 0.002405, representing a strong support point.
We have a trend of consolidation above the 100-period moving average.
Entry price: 0.002567
First target: 0.002700
Second target: 0.002886
Third target: 0.003133
Don't forget a simple money management rule.
Place your stop-loss order below the green support zone.
Once you reach the first target, save some money and then change your stop-loss order to an entry order.
For any questions, please leave a comment.
Thank you.

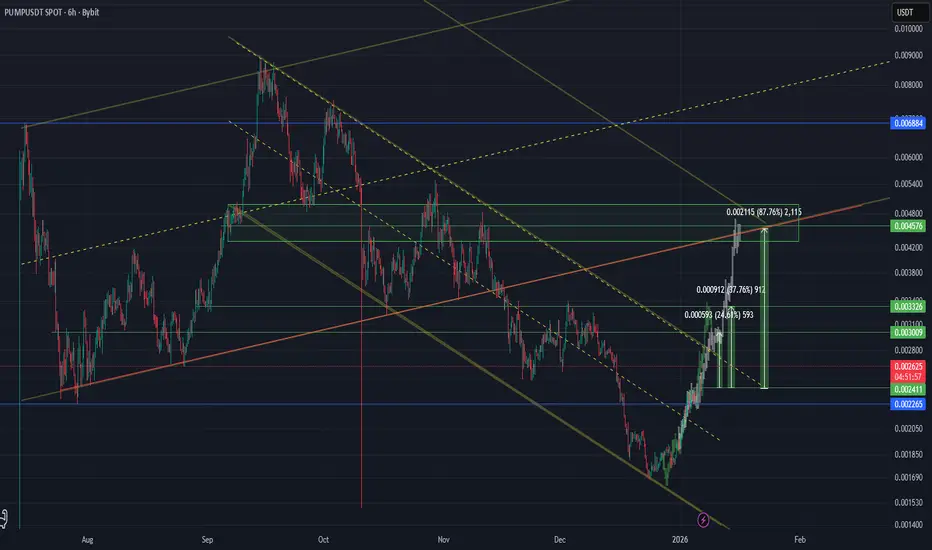
30% gain for Pump is logicalhi
the support and resistances on the chart are based on the previous data and weekly candlesticks if BYBIT:PUMPUSDT holds this last support the potential of 30% gain is logical toward 0.005555$

Can $PUMP Pull Off a Second Wave?BYBIT:PUMPUSDT | 1D
PUMPFUN has already shed nearly 70% from its all-time high, tagging its low at 0.0027 — half the wick filled.
Alts are holding up better than expected during the dump. If CRYPTOCAP:BTC holds 90–88k and PUMP can maintain 0.0020 support, this level looks worth taking a chance on.
Entry: .0028-.0024
Stop: .0018 (below its low)
Targets:
tp1 - .0034-.0038
tp2 - .0042-.0047
tp3 - .0054-.0060
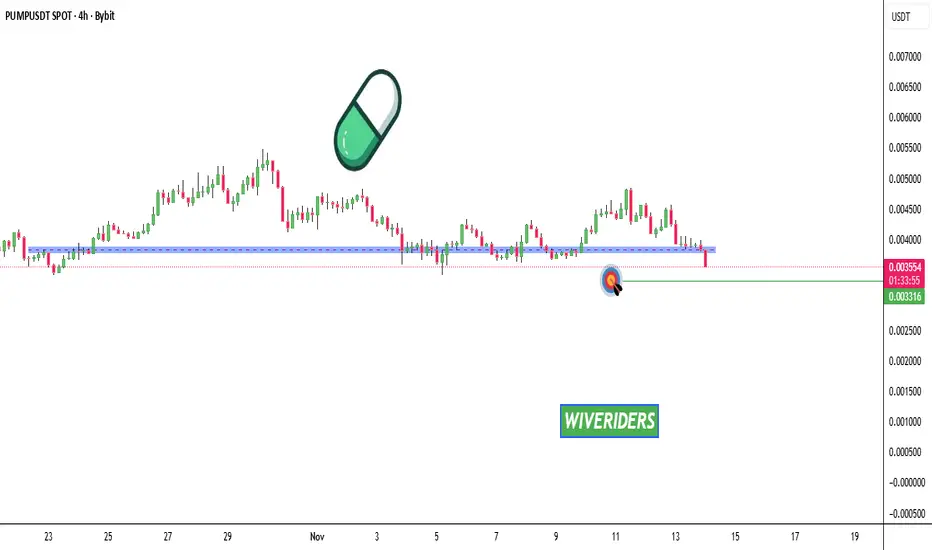
PUMP Update📊 PUMP Update
PUMP has broken below the blue support zone 🔵
Price could continue moving down, at least toward the green line level 🟢
Structure remains bearish as long as it stays below the broken support 🔻
PUMP OR DUMPHello friends
As you can see, the price has corrected after hitting the ceiling and buyers are gradually entering and buying in steps.
The specified supports are important for price growth. If these supports are maintained, the price can move to the specified targets. Of course, be sure to observe capital and risk management and enter in steps.
*Trade safely with us*

PUMP/USDT - Decision Time for: Breakout or Breakdown?The PUMP/USDT pair is now sitting at a critical decision zone, forming a large Symmetrical Triangle pattern on the 12H timeframe.
After weeks of reduced volatility and tight consolidation, price action is approaching the apex of the formation — signaling that a major breakout is imminent.
This structure shows a clear battle between buyers and sellers, as the market compresses between a descending resistance line and a rising support line. Momentum is coiling up — and once the breakout occurs, the move that follows is likely to be explosive.
---
Pattern Description
Pattern name: Symmetrical Triangle
Character: Neutral continuation/reversal pattern — depends on breakout direction
Meaning: Momentum is building; the tighter the triangle, the stronger the potential breakout
Confirmation: Breakout candle + strong volume = valid signal
---
Key Technical Levels
Current price: Around 0.00457 USDT
Bullish targets (if breakout occurs):
1. 0.00520 → breakout confirmation zone
2. 0.00710 → mid-range resistance
3. 0.00860 – 0.00898 → final target / previous swing high
Bearish targets (if breakdown happens):
0.00390 → triangle support
0.00330 – 0.00280 → next demand zone
0.00200 → extreme support / potential panic zone
---
Bullish Scenario
A decisive breakout above the descending resistance trendline with rising volume would signal a potential trend reversal.
If the candle closes above 0.00520, price could rally toward 0.00710 and eventually test the 0.0086 – 0.0089 range.
A successful retest of the breakout zone would strengthen the bullish continuation setup.
Ideal confirmation: 12H candle close above resistance + solid volume expansion.
---
Bearish Scenario
If selling pressure dominates and price fails to hold above the lower support trendline (0.0039), the pair could enter a deeper correction phase toward 0.0033 – 0.0028 or even 0.0020 in a panic-driven move.
Such a breakdown would confirm a bearish continuation and a potential retest of previous lows.
---
Conclusion
PUMP/USDT is coiling up tightly inside a symmetrical triangle — a sign that a high-volatility breakout is near.
The longer the price stays compressed within this range, the more explosive the next move will be.
Traders should closely monitor the 0.0045–0.0052 zone for a decisive breakout or breakdown confirmation.
“Big moves are born from tight ranges — and this chart looks ready to erupt.”
#PUMPUSDT #CryptoBreakout #TrianglePattern #TechnicalAnalysis #PriceAction #CryptoTrading #BullishSetup #BearishScenario #VolatilityLoading #ChartAnalysis #SwingTrade

$PUMP Update📊 NYSE:PUMP Update
NYSE:PUMP is testing the red resistance zone 🔴
If it breaks out above, it could confirm a bullish setup 📈
The first target would be the green line level 🟢

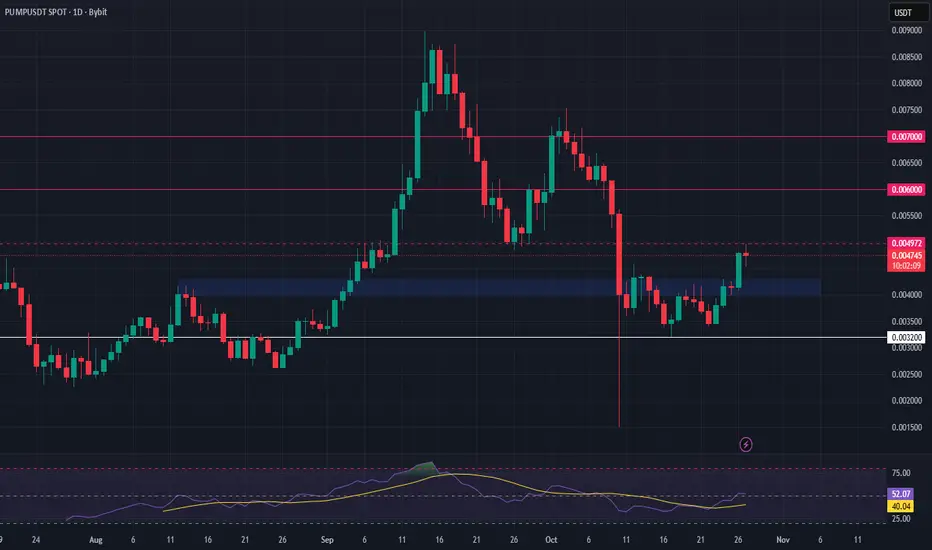
PUMPUSDT – Long Setup at Key Support ZonePUMP is retesting resistance while pulling back into a critical support zone, offering a potential spot long opportunity for those monitoring the range. The price action is forming a confluence area that could act as a base for the next upward move.
📍 Entry Zone: $0.0040 – $0.0043
🎯 Take Profit Targets:
• TP1: $0.0060
• TP2: $0.0070
🛑 Stop Loss: $0.0032
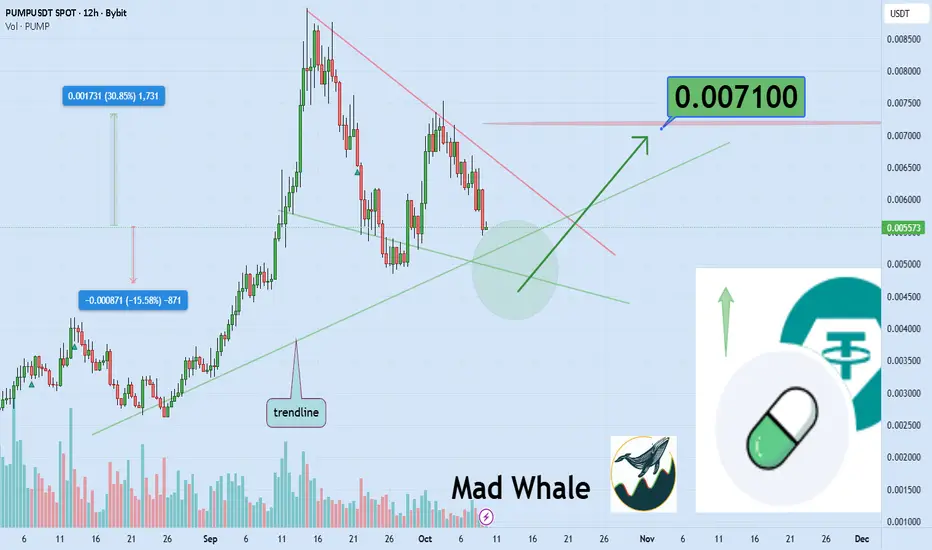
Bulls Defend Pump .fun Support, Eyeing 30% Breakout To 0.007$Hello✌️
Let’s analyze Pum p.fun’s price action both technically and fundamentally 📈.
🔍Fundamental analysis:
Pum p. fun bought back billions of PUMP tokens to cut supply and support price stability. With neutral RSI and MACD, the token might bounce if new upgrades gain more users.
📊Technical analysis:
BYBIT:PUMPUSDT is currently holding above key support levels; as long as these zones remain intact, a potential upside of around 30% toward the 0.0071 area could unfold. A clear breakdown below support, however, may shift momentum bearish and invite further downside movement.📈💎
📈Using My Analysis to Open Your Position:
You can use my fundamental and technical insights along with the chart. The red and green arrows on the left help you set entry, take-profit, and stop-loss levels, serving as clear signals for your trades.⚡️ Also, please review the TradingView disclaimer carefully.🛡
✨We put love into every post!
Your support inspires us 💛 Drop a comment we’d love to hear from you! Thanks, Mad Whale