PUMP/USDT - Decision Time for: Breakout or Breakdown?The PUMP/USDT pair is now sitting at a critical decision zone, forming a large Symmetrical Triangle pattern on the 12H timeframe.
After weeks of reduced volatility and tight consolidation, price action is approaching the apex of the formation — signaling that a major breakout is imminent.
This structure shows a clear battle between buyers and sellers, as the market compresses between a descending resistance line and a rising support line. Momentum is coiling up — and once the breakout occurs, the move that follows is likely to be explosive.
---
Pattern Description
Pattern name: Symmetrical Triangle
Character: Neutral continuation/reversal pattern — depends on breakout direction
Meaning: Momentum is building; the tighter the triangle, the stronger the potential breakout
Confirmation: Breakout candle + strong volume = valid signal
---
Key Technical Levels
Current price: Around 0.00457 USDT
Bullish targets (if breakout occurs):
1. 0.00520 → breakout confirmation zone
2. 0.00710 → mid-range resistance
3. 0.00860 – 0.00898 → final target / previous swing high
Bearish targets (if breakdown happens):
0.00390 → triangle support
0.00330 – 0.00280 → next demand zone
0.00200 → extreme support / potential panic zone
---
Bullish Scenario
A decisive breakout above the descending resistance trendline with rising volume would signal a potential trend reversal.
If the candle closes above 0.00520, price could rally toward 0.00710 and eventually test the 0.0086 – 0.0089 range.
A successful retest of the breakout zone would strengthen the bullish continuation setup.
Ideal confirmation: 12H candle close above resistance + solid volume expansion.
---
Bearish Scenario
If selling pressure dominates and price fails to hold above the lower support trendline (0.0039), the pair could enter a deeper correction phase toward 0.0033 – 0.0028 or even 0.0020 in a panic-driven move.
Such a breakdown would confirm a bearish continuation and a potential retest of previous lows.
---
Conclusion
PUMP/USDT is coiling up tightly inside a symmetrical triangle — a sign that a high-volatility breakout is near.
The longer the price stays compressed within this range, the more explosive the next move will be.
Traders should closely monitor the 0.0045–0.0052 zone for a decisive breakout or breakdown confirmation.
“Big moves are born from tight ranges — and this chart looks ready to erupt.”
#PUMPUSDT #CryptoBreakout #TrianglePattern #TechnicalAnalysis #PriceAction #CryptoTrading #BullishSetup #BearishScenario #VolatilityLoading #ChartAnalysis #SwingTrade
Pumpusdtsignal

PUMP/USDT – Retest Trendline: Bullish or Bearish Continuation?🔎 Market Structure & Pattern
PUMP/USDT is showing signs of momentum shift after being trapped in a prolonged downtrend. The major descending trendline (yellow) — which has consistently acted as a dynamic resistance — has finally been broken to the upside.
This signals the potential transition from a distribution/sideways phase into an accumulation → expansion phase.
The 0.0030 – 0.0032 zone (yellow box) is now a key support area. Previously it acted as a strong resistance, but after the breakout, the zone is being retested (role reversal). How the price reacts here will determine the next major move.
---
📈 Bullish Scenario
Condition: Price holds above 0.0030–0.0032 after the breakout.
Additional confirmation: Strong 6H/Daily close above the trendline with rising volume.
Upside targets:
R1: 0.003692
R2: 0.004108
R3: 0.004459
R4: 0.005521
R5: 0.006779 – 0.006891 (previous high)
If these levels are cleared one by one, the structure will officially shift into higher highs & higher lows, confirming a trend reversal.
---
📉 Bearish Scenario
Condition: Price fails to hold above 0.0030–0.0032 and closes back below the support zone.
Additional confirmation: Strong bearish rejection at R1–R2 with patterns like bearish engulfing or shooting star.
Downside targets:
First support: 0.0028
Key structural low: 0.002254
If this happens, the current breakout will be considered a false breakout, and the long-term downtrend may continue.
---
⚖️ Conclusion
The market is currently at a critical juncture.
A confirmed hold above 0.0030–0.0032 could open the door for a rally towards 0.0044 → 0.0055 → 0.0067.
Failure to hold this support, however, may send the price back to 0.002254.
Risk management is essential — keep tight stop-losses below the support zone.
---
🚀 PUMP/USDT (6H) Trendline Breakout
Price has broken out of the major downtrend and is now retesting the 0.0030–0.0032 key support zone.
📈 If the zone holds → potential rally towards 0.003692 / 0.004108 / 0.004459 / 0.005521 / 0.006779.
📉 If the zone fails → watch for downside continuation to 0.002254.
🔥 The market is at a decisive point — watch price action closely.
(Not financial advice — always apply proper risk management.)
#PUMPUSDT #Crypto #Altcoins #Breakout #Trendline #TechnicalAnalysis #PriceAction #SwingTrade #CryptoTrading #RiskManagement

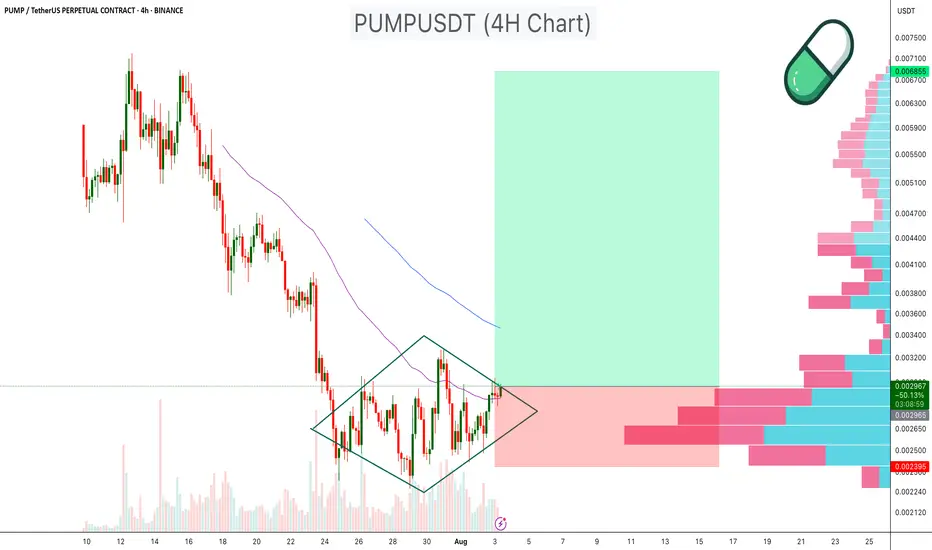
PUMPUSDT Diamond Pattern PUMPUSDT has been consolidating within a diamond chart pattern on the 4 hour timeframe, following a prolonged downtrend. This type of structure signals potential reversal when occurring after a decline.
Diamond Formation: Price is compressing inside converging and diverging trendlines, creating a symmetrical diamond pattern.
Volume Profile Support: Significant volume support is visible in the $0.00240–$0.00250 range, which may act as a strong demand zone.
EMA Resistance: 50 EMA is currently positioned above the price, serving as dynamic resistance.
Breakout Potential: A breakout above the diamond resistance, especially with increased volume, could target the $0.005 –$0.007 zone, representing a major upside move.
Cheers
Hexa
NYSE:PUMP BYBIT:PUMPUSDT