KSE 100 Index (Weekly): Analyzing the Correction, SeasonalThat's a very insightful observation! Incorporating historical seasonal tendencies, like a potential December correction, adds depth to the purely technical analysis.
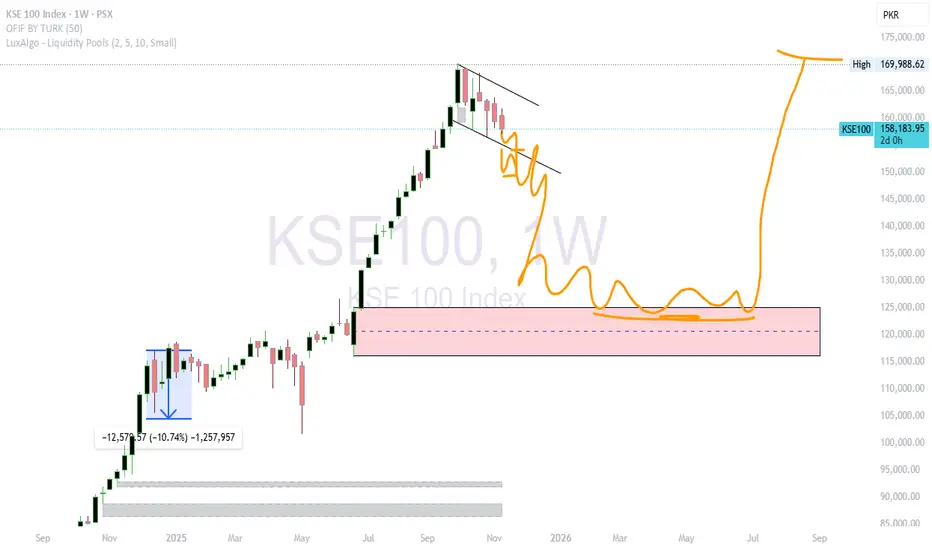
The PSX:KSE100 Index has concluded a powerful, multi-month rally near **170,000** and has entered a necessary corrective phase. This analysis overlays the drawn technical projections with a notable historical seasonal pattern observed in the market.
---
Current Price Action & Correction Analysis
1. The Corrective Structure
The high near {169,988}has initiated a downward move, drawn as a tentative bearish flag or descending channel structure, confirming that selling pressure is dominant in the short term.
The drawn path projects continued volatility (choppy action) before a stable bottom can be formed.
2. Historical Seasonal Pattern (December Drop)
Crucial Observation:Historically, the KSE 100 has shown a tendency for a correction, typically in the range of **9% to 11%**, around the **December** period every year.
Implication: The current corrective phase is likely to be accelerated or intensified by this historical seasonal selling pressure, potentially pushing the index towards its initial support levels quickly.
3. Identifying Major Technical Support (The Demand Zone)
The drawn projection anticipates the index will eventually move towards the crucial highlighted rectangular pink/red zone**, identified as a major potential demand or reversal area.
Key Support Range: Approximately {115,000} to {125,000}.
Significance:* This zone represents a major historical consolidation area. If the price reaches this level, combined with the expected seasonal dip, it could set up a high-probability reversal base.
---
Projection and Future Target
The drawn scenario projects a significant bottoming process followed by a strong bullish impulse.
1. The Bottoming Process
The index is projected to continue its decline, possibly accelerated by the year-end (December) selling, and stabilize through early 2026.
The market is expected to spend a prolonged period forming a base within the major {115,000} {125,000}Demand Zone (drawn as a flat, choppy range). This consolidation is essential for absorbing selling pressure and building momentum for the next move.
2. Bullish Target
Following the base formation and successful reversal from the Demand Zone, the projection anticipates a resumption of the primary bullish trend.
Target:The drawn path projects a decisive break past the recent high to new all-time highs, potentially extending into the $\text{175,000}$ to $\text{180,000}$ range or higher by late 2026.
Disclaimer
This analysis combines technical projections with a historical seasonal pattern and is a projected scenario. Trading involves significant risk. Always conduct your own research and manage your risk carefully.
PXS
PXSPyxis Tankers Inc (NASDAQ:PXS) is one for the bottom pickers. Upside volume is picking up and a rounding bottom is taking shape. I have been following and accumulating this stock for a few days now. The trend should resume back up in the very near future. I could be wrong, but I did not find a reason for the drop in shares as it did. It was likely a consequence of the negative market environment in the small cap index. Consider shares to be at a bit of a discount if my speculation is correct. And honestly I have a lot of confidence regarding this.

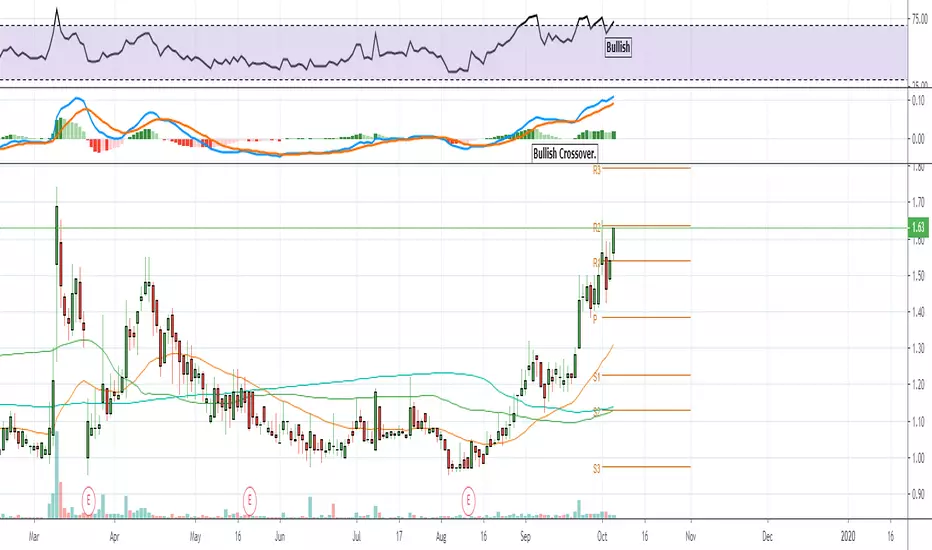
PXSPyxis Tankers Inc (NASDAQ:PXS) has witnessed an excellent uptick overall during the past few sessions and it has been correlated with increasing volume. The stock closed 8.74% higher to 1.12 on Thursday after consolidating over 1 week within a narrow range. Considering the recent increase in volume, accumulation and money flow, I believe PXS could make a solid move higher given both its fundamental and technical factors. Momentum picking up with MACD climbing and RSI rising. In the past, PXS has experienced surges in valuation of over 50% in just days. MACD History on the chart above repeats for itself. Keep a close eye on PXS next week because it could be a strong play.


PXS - Bullish Momentum Still RunningPyxis Tankers, Inc. is an international maritime transportation holding company, which engages in the maritime transportation business with a focus on the tanker sector. It acquires, owns, and operates tanker vessels that are capable of transporting refined petroleum products such as naphtha, gasoline, jet fuel, kerosene, diesel, and fuel oil. The company was founded by Valentios Valentis on March 23, 2015 and is headquartered in Athens, Greece.
SHORT INTEREST
187.12K 09/13/19
P/E Current
-4.07
P/E Ratio (with extraordinary items)
-2.93
Average Recommendation: BUY Average Target Price: 2.00

PXS - Bullish Momentum Gaining StrengthPyxis Tankers, Inc. is an international maritime transportation holding company, which engages in the maritime transportation business with a focus on the tanker sector. It acquires, owns, and operates tanker vessels that are capable of transporting refined petroleum products such as naphtha, gasoline, jet fuel, kerosene, diesel, and fuel oil. The company was founded by Valentios Valentis on March 23, 2015 and is headquartered in Athens, Greece.
P/E Current
-3.72
P/E Ratio (with extraordinary items)
-2.68
Average Recommendation: BUY
Average Target Price: 2.00
PXS - Recover ON The Horizon...RISKY MOVEPyxis Tankers, Inc. is an international maritime transportation holding company, which engages in the maritime transportation business with a focus on the tanker sector. It acquires, owns, and operates tanker vessels that are capable of transporting refined petroleum products such as naphtha, gasoline, jet fuel, kerosene, diesel, and fuel oil. The company was founded by Valentios Valentis on March 23, 2015 and is headquartered in Athens, Greece.
SHORT INTEREST
204.45K 08/15/19
P/E Current
-3.03
P/E Ratio (with extraordinary items)
-2.18
Average Recommendation: BUY
Average Target Price: 2.00

NASDAQ: $PXS | #PyxisTankers is LITERALLY going to FUCKING TANK!NASDAQ: $PXS | #PyxisTankers is LITERALLY going to FUCKING TANK!


