#PYR/USDT T — Critical Zone: Accumulation for Rebound or Breakd#PYR
The price is moving in a descending channel on the 1-hour timeframe. It has reached the lower boundary and is heading towards a breakout, with a retest of the upper boundary expected.
We are seeing a bearish trend in the Relative Strength Index (RSI), which has reached near the lower boundary, and an upward bounce is expected.
There is a key support zone in green at 0.443, and the price has bounced from this level several times. Another bounce is expected.
We are seeing a trend towards stabilizing above the 100-period moving average, which we are approaching, supporting the upward trend.
Entry Price: 0.471
First Target: 0.486
Second Target: 0.505
Third Target: 0.526
Remember a simple principle: Money Management.
Place your stop-loss order below the green support zone.
For any questions, please leave a comment.
Thank you.
Pyrusdtlong

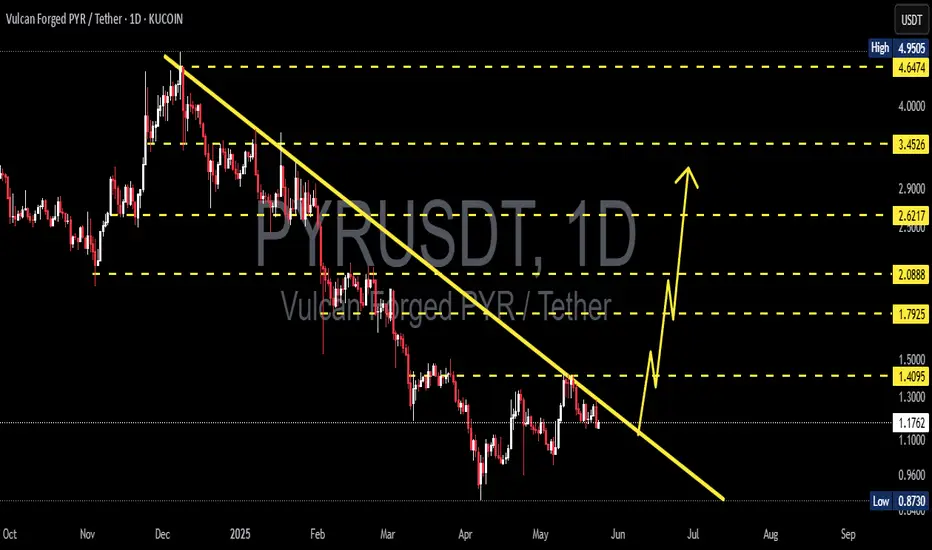
PYRUSDT Forming Falling WedgePYRUSDT is forming a clear falling wedge pattern, a classic bullish reversal signal that often indicates an upcoming breakout. The price has been consolidating within a narrowing range, suggesting that selling pressure is weakening while buyers are beginning to regain control. With consistent volume confirming accumulation at lower levels, the setup hints at a potential bullish breakout soon. The projected move could lead to an impressive gain of around 90% to 100% once the price breaks above the wedge resistance.
This falling wedge pattern is typically seen at the end of downtrends or corrective phases, and it represents a potential shift in market sentiment from bearish to bullish. Traders closely watching PYRUSDT are noting the strengthening momentum as it nears a breakout zone. The good trading volume adds confidence to this pattern, showing that market participants are positioning early in anticipation of a reversal.
Investors’ growing interest in PYRUSDT reflects rising confidence in the project’s long-term fundamentals and current technical strength. If the breakout confirms with sustained volume, this could mark the start of a fresh bullish leg. Traders might find this a valuable setup for medium-term gains, especially as the wedge pattern completes and buying momentum accelerates.
✅ Show your support by hitting the like button and
✅ Leaving a comment below! (What is your opinion about this Coin?)
Your feedback and engagement keep me inspired to share more insightful market analysis with you!

#PYR/USDT — Critical Zone: Accumulation for Rebound or Breakdo#PYR
The price is moving within a descending channel on the 1-hour frame, adhering well to it, and is heading for a strong breakout and retest.
We have a bearish trend on the RSI indicator that is about to be broken and retested, which supports the upward breakout.
There is a major support area in green at 0.633, representing a strong support point.
We are heading for consolidation above the 100 moving average.
Entry price: 0.658
First target: 0.672
Second target: 0.692
Third target: 0.710
Don't forget a simple matter: capital management.
When you reach the first target, save some money and then change your stop-loss order to an entry order.
For inquiries, please leave a comment.
Thank you.

PYR Investment Opportunity Hi, Everyone
I back again with a new Opportunity with PYR after the last successful one
I expect a good Investment opportunity with PYR
respecting the accumulation area is outstanding
the Risk to Reward is almost 34 time
Good luck everyone

PYR/USDT — Critical Zone: Accumulation for Rebound or Breakdown?PYR/USDT is now trading at a critical decision zone. After a prolonged downtrend since late 2024, the price has been consolidating inside the demand zone at 0.78 – 0.98 USDT. This area has repeatedly acted as a strong foundation to prevent deeper declines. With multiple retests, the market is approaching a tipping point: will PYR stage a significant rebound or break down into new lows?
---
🔎 Market Structure & Price Pattern
Long-Term Trend: Bearish, characterized by sharp declines and a series of lower highs since early 2025.
Mid-Term Trend: Sideways / Range-bound, with the lower boundary at 0.78–0.98 and upper boundary near 1.38.
Pattern Observed:
Potential Double/Triple Bottom formation at major support. If confirmed, this could signal accumulation before a trend reversal.
Failure to hold this zone, however, would turn the structure into a distribution breakdown, triggering new selling pressure.
---
📈 Bullish Scenario (Rebound Potential)
1. Price holds above 0.78 – 0.98 with a clear bullish reversal candle (engulfing / hammer / piercing line) on the daily timeframe.
2. Additional confirmation if daily close sustains above 1.045.
3. Step-by-step upside targets:
🎯 T1 = 1.181
🎯 T2 = 1.382
🎯 T3 = 2.148 (major mid-term resistance)
🎯 T4 = 2.592 – 3.458 if momentum extends further.
4. Bullish structure strengthens once a higher low forms after the rebound.
---
📉 Bearish Scenario (Breakdown Potential)
1. Price fails to hold and closes daily candle below 0.78.
2. A retest of the 0.78–0.98 zone as new resistance would confirm the bearish bias.
3. Downside targets:
⚠️ 0.60 (psychological support)
⚠️ 0.45 – 0.40 (deeper historical demand zone)
4. Such a breakdown will likely be accompanied by heavy sell volume, signaling panic selling and loss of key support.
---
📌 Conclusion & Strategy
The 0.78–0.98 zone is the golden decision point for PYR.
Bullish case: wait for a confirmed breakout above 1.045, with targets at 1.18–1.38.
Bearish case: breakdown below 0.78 opens room for a deeper sell-off.
Best strategy: stay patient, wait for confirmation, and let price action decide whether this zone becomes an accumulation base or a distribution top.
#PYR #PYRUSDT #CryptoAnalysis #Altcoin #SupportResistance #DemandZone #CryptoTrading #TechnicalAnalysis

PYRUSDT UPDATE#PYR
Update
PYR Technical Setup
Pattern: Falling Wedge Pattern
Current Price: $1.016
Target Price: $1.32
Target % Gain: 30.21%
Technical Analysis: PYR has broken out of a falling wedge pattern on the 4H chart, signaling a potential bullish reversal. The breakout above resistance with strong candle structure confirms buying pressure, and continuation momentum can push toward the $1.30 area.
Time Frame: 4H
Risk Management Tip: Always use proper risk management and set stop-loss below recent support.

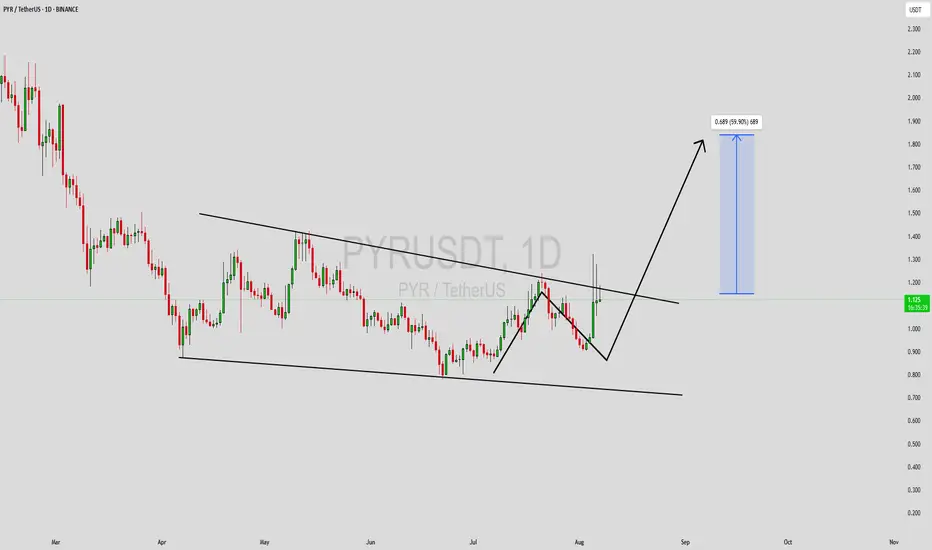
PYRUSDT Forming Bullish PennantPYRUSDT is currently forming a bullish pennant pattern, a continuation structure that often signals the resumption of an upward trend after a brief consolidation. This pattern typically occurs after a strong price rally, followed by a brief period of symmetrical triangle consolidation, suggesting that buyers are preparing for another breakout. With good volume supporting the current structure and investors showing strong interest, PYR is setting up for another leg up in the market.
The bullish pennant is particularly powerful when accompanied by strong volume, which PYRUSDT is currently exhibiting. This volume confirms market confidence and growing participation in the asset. As the price continues to coil within the pennant formation, a breakout to the upside could lead to a price surge of 50% to 60% or more, aligning with historical behavior of this pattern in similar setups.
Investor sentiment is becoming increasingly optimistic for PYRUSDT, especially with the resurgence of gaming and metaverse-related tokens. As the broader market stabilizes and speculative interest returns, PYR is positioned to capitalize on both its technical structure and thematic strength. Traders and investors watching for bullish continuation setups should monitor the breakout levels closely.
Overall, PYRUSDT’s current pattern, backed by strong technicals and investor interest, makes it a promising opportunity in the altcoin space. A confirmed breakout from this bullish pennant could deliver a significant upside move, rewarding those who recognize the setup early.
✅ Show your support by hitting the like button and
✅ Leaving a comment below! (What is You opinion about this Coin)
Your feedback and engagement keep me inspired to share more insightful market analysis with you!
PYR/USDT Breaking the Downtrend? Major Reversal Setup Toward $2+
📌 Analysis Summary:
PYR/USDT is currently at a critical juncture after enduring a prolonged downtrend since December 2024. However, early signs of a major trend reversal are emerging as selling pressure weakens and a bullish pattern begins to form.
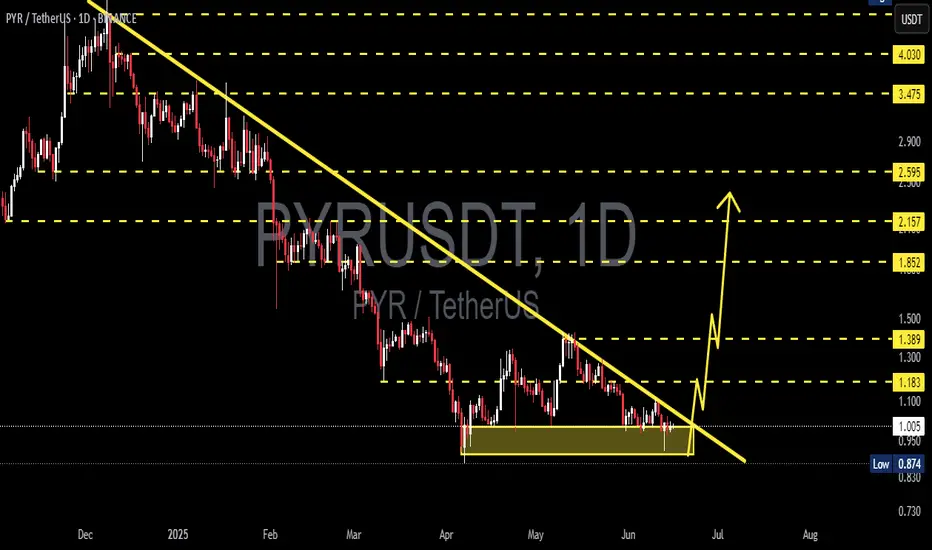
The price action has shaped a classic Falling Wedge — a well-known bullish reversal pattern. The declining volume, narrowing price action, and strong support zone indicate that a breakout may be imminent.
📊 Pattern: Falling Wedge (Bullish Reversal)
Descending Trendline: Consistent lower highs since December 2024 now being tested.
Volume Contraction: Typical of the final phase of accumulation before a breakout.
Solid Support Base: Formed at the $0.78–$0.83 area, with multiple bounces.
This pattern suggests that although the price has been declining, bearish momentum is fading, paving the way for a potential sharp move upward.
🚀 Bullish Scenario (Upside Reversal):
If PYR can break above the descending trendline and close above $0.95 with strong volume, it would confirm the breakout and open the path toward these key resistance levels:
1. $1.045 – Initial breakout target.
2. $1.10 – Psychological resistance.
3. $1.181 – Former support turned resistance.
4. $1.300 – Consolidation zone from earlier.
5. $1.382 – Fibonacci-based extension.
6. $2.148 – Mid-term target and key historical resistance.
7. $2.592 – $3.458 – Long-term target if the bullish trend fully unfolds.
📍 A daily candle close above $1.10 with strong volume would be a solid confirmation of trend reversal.
🔻 Bearish Scenario (Failed Reversal):
If the price fails to break above the trendline and faces rejection:
A retest of the $0.83–$0.78 support zone is likely.
A breakdown below $0.78 may lead to deeper lows (not visible on this chart).
Bearish momentum would strengthen further if BTC or the broader market sentiment turns negative.
📍 Bearish confirmation would occur on a strong breakdown below $0.78 with increasing sell volume.
🎯 Strategy & Key Insights:
Watch for a clean breakout with volume above the descending trendline.
Ideal setup for breakout traders or mid-term swing traders.
Excellent risk/reward ratio near the bottom of a long downtrend.
📈 Summary of Potential Upside Targets:
Target Type Price Level
Initial Breakout $1.045
Breakout Confirmation $1.10
Extension Target $1.181 - $1.382
Mid-Term Target $2.148
Long-Term Potential $2.592 – $3.458
🔥 Final Thoughts:
PYR/USDT is sitting at the edge of a breakout from a long-term downtrend, and if this Falling Wedge pattern plays out, it could mark the beginning of a powerful bullish phase. The upside potential is massive, with targets over 100% above the current level. However, caution is still needed — a rejection at the trendline could invalidate the bullish thesis. Watch this chart closely!
#PYR #PYRUSDT #CryptoBreakout #AltcoinReversal #FallingWedge #TechnicalAnalysis #BullishSetup #CryptoTrading #BreakoutTrade #AltcoinSeason

PYRUSDT 1D AnalysisPYR ~ 1D Analysis
#PYR Buy back gradually from here if you still have confidence in this coin with a short term target of at least 15%+
#PYR/USDT#PYR
The price is moving within a descending channel on the 1-hour frame, adhering well to it, and is heading for a strong breakout and retest.
We are experiencing a rebound from the lower boundary of the descending channel, which is support at 1.100.
We are experiencing a downtrend on the RSI indicator, which is about to break and retest, supporting the upward trend.
We are looking for stability above the 100 moving average.
Entry price: 1.130
First target: 1.174
Second target: 1.200
Third target: 1.259

PYRUSDT 1D AnalysisPYR ~ 1D Analysis
#PYR Buy after successfully breaking through this resistance line with a short-term target of at least 10%++
#PYR/USDT#PYR
The price is moving within a descending channel on the 1-hour frame, adhering well to it, and is heading towards a strong breakout and retest.
We are seeing a bounce from the lower boundary of the descending channel, which is support at 1.13.
We are seeing a downtrend on the RSI indicator that is about to be broken and retested, supporting the upward trend.
We are looking for stability above the 100 moving average.
Entry price: 1.165
First target: 1.19
Second target: 1.23
Third target: 1.28

#PYR/USDT#PYR
The price is moving within a descending channel on the 1-hour frame, adhering well to it, and is heading for a strong breakout and retest.
We are experiencing a rebound from the lower boundary of the descending channel, which is support at 1.07.
We are experiencing a downtrend on the RSI indicator that is about to break and retest, supporting the upward trend.
We are heading for stability above the 100 Moving Average.
Entry price: 1.08
First target: 1.11
Second target: 1.14
Third target: 1.187

#PYR/USDT#PYR
The price is moving within a descending channel on the 1-hour frame and is expected to break and continue upward.
We have a trend to stabilize above the 100 moving average once again.
We have a downtrend on the RSI indicator that supports the upward move with a breakout.
We have a support area at the lower boundary of the channel at 1.05, which acts as strong support from which the price can rebound.
Entry price: 1.18
First target: 1.27
Second target: 1.37
Third target: 1.48

PYRUSDT 1DPYR ~ 1D Analysis
#PYR Buy after successfully penetrating this resistant line with a short -term target of at least 10%+ from here.

#PYR/USDT#PYR
The price is moving in a descending channel on the 1-hour frame and is adhering to it well and is heading to break it upwards strongly and retest it
We have a bounce from the lower limit of the descending channel, this support is at a price of 1.325
We have a downtrend on the RSI indicator that is about to break and retest, which supports the rise
We have a trend to stabilize above the 100 moving average
Entry price 1.390
First target 1.464
Second target 1.529
Third target 1.615

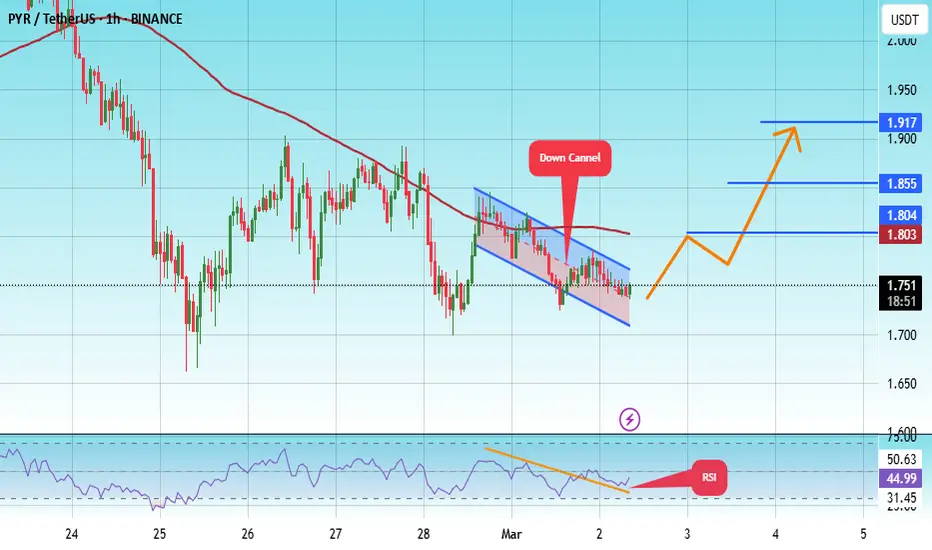
#PYR/USDT#PYR
The price is moving in a descending channel on the 1-hour frame and is adhering to it well and is heading to break it upwards strongly and retest it
We have a bounce from the lower limit of the descending channel, this support is at a price of 1.72
We have a downtrend on the RSI indicator that is about to be broken and retested, which supports the rise
We have a trend to stabilize above the moving average 100
Entry price 1.73
First target 1.80
Second target 1.85
Third target 1.19
PYRUSDT 1DPYR ~ 1D Analysis
#PYR Watch this coin, buy after successfully penetrating the resistant line of this pattern. Minimum target of 15%+.

#PYR/USDT#PYR
The price is moving in a descending channel on the 1-hour frame and is adhering to it well and is heading to break it strongly upwards and retest it
We have a bounce from the lower limit of the descending channel, this support is at a price of 1.96
We have a downtrend on the RSI indicator that is about to break and retest, which supports the rise
We have a trend to stabilize above the Moving Average 100
Entry price 2.055
First target 2.16
Second target 2.26
Third target 2.37

Ready to launch upwards#PYR
The price is moving in a descending channel on the 1-hour frame and is adhering to it well and is heading to break it strongly upwards
We have a bounce from the lower limit of the descending channel, this support is at a price of 2.44
We have a downtrend on the RSI indicator that is about to be broken, which supports the rise
We have a trend to stabilize above the moving average 100
Entry price 2.52
First target 2.70
Second target 2.80
Third target 3.03

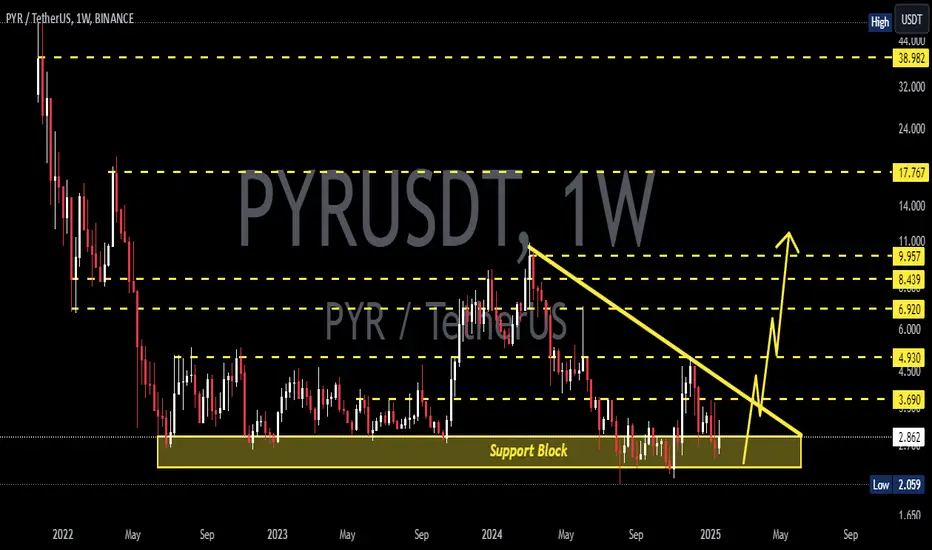
PYRUSDT 1WPYR ~ 1W
#PYR So far it still maintains this support block,. This is a very good time to start buying this coin, with a target of at least 20%++