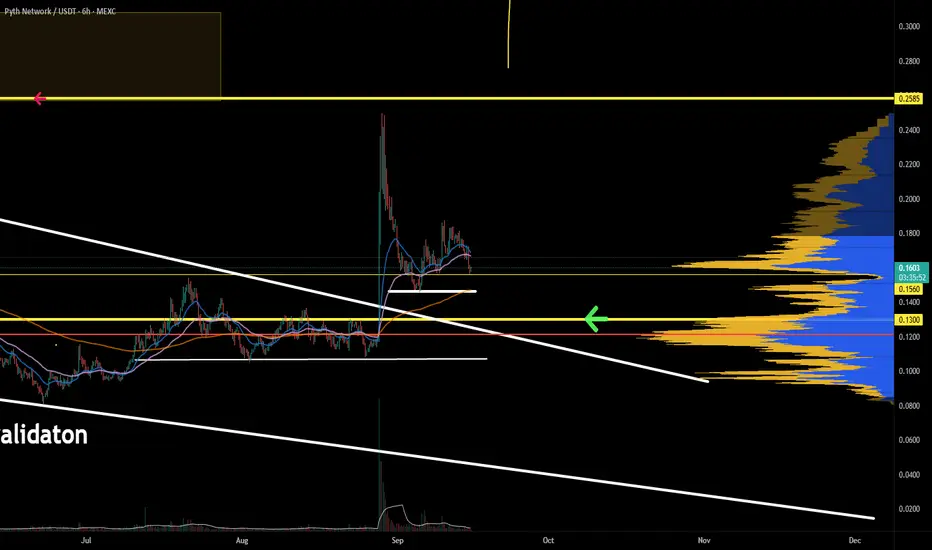
PYTH needs to get the party startedPYTH is sitting on a major demand zone, and momentum is finally showing bullish divergence. Sellers look exhausted, and the volume profile above is thin — meaning any reclaim of this level could trigger a sharp relief move.
Hold this zone and PYTH has room to bounce.
Lose it and the chart hunts lower liquidity.
Key moment for PYTH.
What’s your read?
Pyth

PYTH/USDT — the Final Defense Before a Potential Breakout Move?PYTH is now trading at a critical turning point, hovering right above the major demand zone at 0.100–0.089 USDT (yellow block).
This area has acted as a strong defensive wall for buyers several times in the past.
However, persistent lower highs under the descending trendline are showing strong selling pressure, forming a descending triangle pattern — a classic sign of market compression before a major move.
As volume gradually declines, the chart suggests that energy is building up for a breakout or breakdown.
The next move from this structure will likely define PYTH’s direction for the next few weeks.
---
🟢 Bullish Scenario
Key condition: Breakout and 12H candle close above the descending trendline and 0.120 USDT, ideally with strong volume confirmation.
Once confirmed, PYTH could start reversing its structure with the following upside targets:
🎯 Target 1: 0.140 (nearest resistance)
🎯 Target 2: 0.165 (previous supply zone)
🎯 Target 3: 0.231–0.250 (major resistance / previous high)
As long as price holds above 0.100, the structure remains valid for a potential bullish reversal.
Suggested stop-loss: below 0.095 (or based on personal risk tolerance).
💬 “A breakout above the trendline could be the first signal of a major reversal. Volume confirmation is key.”
---
🔴 Bearish Scenario
If the price fails to break above the trendline and instead closes below 0.089 USDT, bearish momentum could accelerate sharply.
A confirmed breakdown below this demand area might trigger a stop-loss cascade or panic selling, targeting:
⚠️ Target 1: 0.070
⚠️ Target 2: 0.050
This zone represents the last stand for the bulls — losing it could shift the market into a new bearish phase.
💬 “If 0.089 breaks, strong support becomes a dangerous resistance.”
---
⚙️ Technical Summary
Pattern: Descending Triangle
Strong Support Zone: 0.100–0.089
Bullish Trigger: 12H close above 0.120
Bearish Trigger: 12H close below 0.089
Market Condition: Price compression under pressure — a large directional move is likely approaching.
---
💡 Trader Insight
> “The longer price stays compressed under pressure,
the stronger the breakout potential becomes.
Direction is uncertain — but the storm is near.”
#PYTH #PYTHUSDT #Crypto #TechnicalAnalysis #DescendingTriangle #Breakout #SupportResistance #CryptoChart #PriceAction #AltcoinSetup

PYTH long by fundamental is good news1. Widespread adoption of DeFi & CeFi → more DEXs, CEXs, and financial applications using Pyth price feeds (because they're fast and cheap).
Institutions & governments → collaboration with large institutions (e.g., the US Department of Commerce) increases credibility.
3. Multi-chain expansion → the more blockchain integrations, the greater the demand for data → higher fees for publishers and stakers.
4. Active staking & governance → the PYTH token gains strong utility (staking, fee sharing, voting), driving demand.
5. Global crypto market revival → if the bull market returns, demand for data oracles will increase → Pyth's position as a next-generation oracle will become more prominent.
Bottom line: Bullish if Pyth succeeds in becoming the standard oracle for "the price of everything"
in on-chain finance.
ATOMUSDT | Short From Red Box, Long-Term SetupResistance Zone;
ATOMUSDT is facing heavy resistance at the red box, making it an attractive short entry zone. Structure shows sellers remain active here, and momentum hasn’t shifted yet.
Risk Management;
For risk management, I’m anchoring this setup with a stop at 7.9. That level is key a breakout and retest above it would invalidate the short idea and open the door for bullish continuation.
Bias and Conditions;
Until then, the bias stays short. CDV is not showing strong buyer commitment, and footprint still reflects selling pressure. As long as those conditions hold, the short idea has weight.
Trade Style;
This is a long-term play, not a quick scalp. Patience is required.
📌I keep my charts clean and simple because I believe clarity leads to better decisions.
📌My approach is built on years of experience and a solid track record. I don’t claim to know it all but I’m confident in my ability to spot high-probability setups.
📌If you would like to learn how to use the heatmap, cumulative volume delta and volume footprint techniques that I use below to determine very accurate demand regions, you can send me a private message. I help anyone who wants it completely free of charge.
🔑I have a long list of my proven technique below:
🎯 ZENUSDT.P: Patience & Profitability | %230 Reaction from the Sniper Entry
🐶 DOGEUSDT.P: Next Move
🎨 RENDERUSDT.P: Opportunity of the Month
💎 ETHUSDT.P: Where to Retrace
🟢 BNBUSDT.P: Potential Surge
📊 BTC Dominance: Reaction Zone
🌊 WAVESUSDT.P: Demand Zone Potential
🟣 UNIUSDT.P: Long-Term Trade
🔵 XRPUSDT.P: Entry Zones
🔗 LINKUSDT.P: Follow The River
📈 BTCUSDT.P: Two Key Demand Zones
🟩 POLUSDT: Bullish Momentum
🌟 PENDLEUSDT.P: Where Opportunity Meets Precision
🔥 BTCUSDT.P: Liquidation of Highly Leveraged Longs
🌊 SOLUSDT.P: SOL's Dip - Your Opportunity
🐸 1000PEPEUSDT.P: Prime Bounce Zone Unlocked
🚀 ETHUSDT.P: Set to Explode - Don't Miss This Game Changer
🤖 IQUSDT: Smart Plan
⚡️ PONDUSDT: A Trade Not Taken Is Better Than a Losing One
💼 STMXUSDT: 2 Buying Areas
🐢 TURBOUSDT: Buy Zones and Buyer Presence
🌍 ICPUSDT.P: Massive Upside Potential | Check the Trade Update For Seeing Results
🟠 IDEXUSDT: Spot Buy Area | %26 Profit if You Trade with MSB
📌 USUALUSDT: Buyers Are Active + %70 Profit in Total
🌟 FORTHUSDT: Sniper Entry +%26 Reaction
🐳 QKCUSDT: Sniper Entry +%57 Reaction
📊 BTC.D: Retest of Key Area Highly Likely
📊 XNOUSDT %80 Reaction with a Simple Blue Box!
📊 BELUSDT Amazing %120 Reaction!
📊 Simple Red Box, Extraordinary Results
📊 TIAUSDT | Still No Buyers—Maintaining a Bearish Outlook
📊 OGNUSDT | One of Today’s Highest Volume Gainers – +32.44%
📊 TRXUSDT - I Do My Thing Again
📊 FLOKIUSDT - +%100 From Blue Box!
📊 SFP/USDT - Perfect Entry %80 Profit!
📊 AAVEUSDT - WE DID IT AGAIN!
I stopped adding to the list because it's kinda tiring to add 5-10 charts in every move but you can check my profile and see that it goes on..
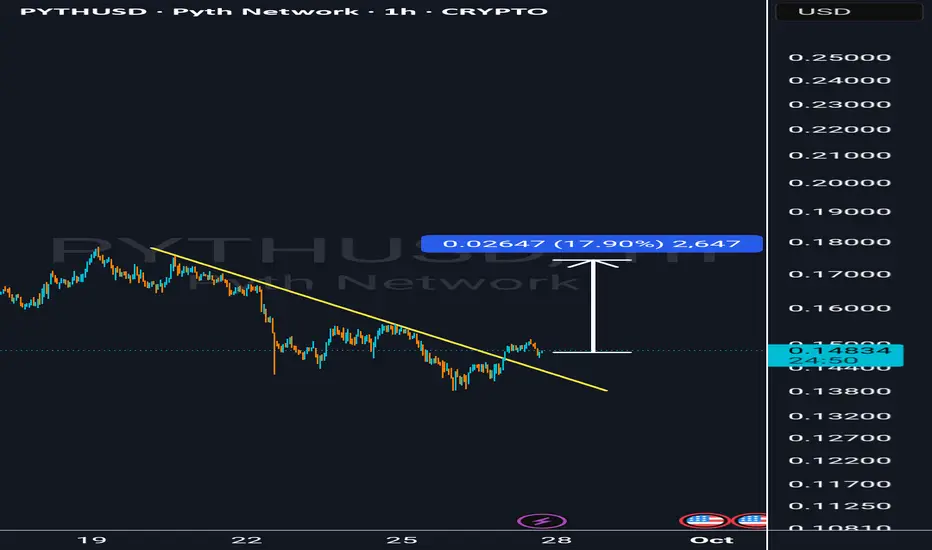
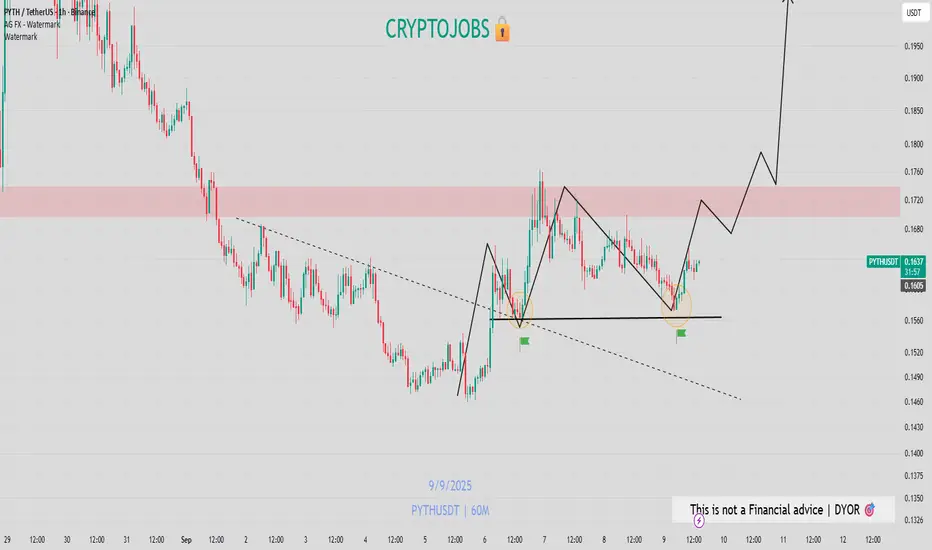
PYTH hunting liquidity near the breakout zonePYTH is in a retrament back to levels at which market participation traded a breakout. This zone has liquidity to be hunted, and it may get swept. Unless PYTH price action prints a reversal structure, the price is likely to fall to liquidity zones of the past. Prepare.
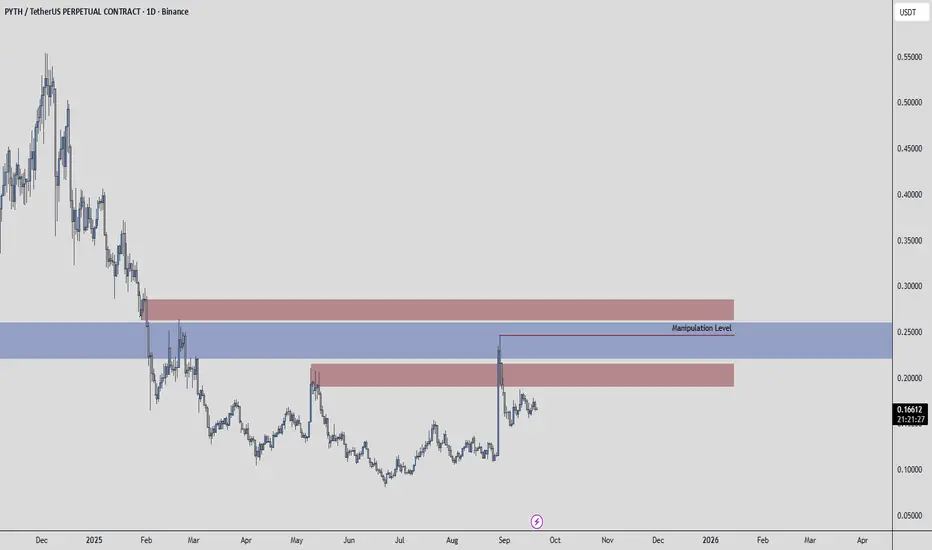
PythNetwork PYTH price analysis🔥 Recently, #PYTH delivered a real X2 show!
But if you’re expecting an immediate continuation of the rally — probably not ❌
📌 Why:
1️⃣ OKX:PYTHUSDT has entered a strong liquidity zone at $0.225–0.265.
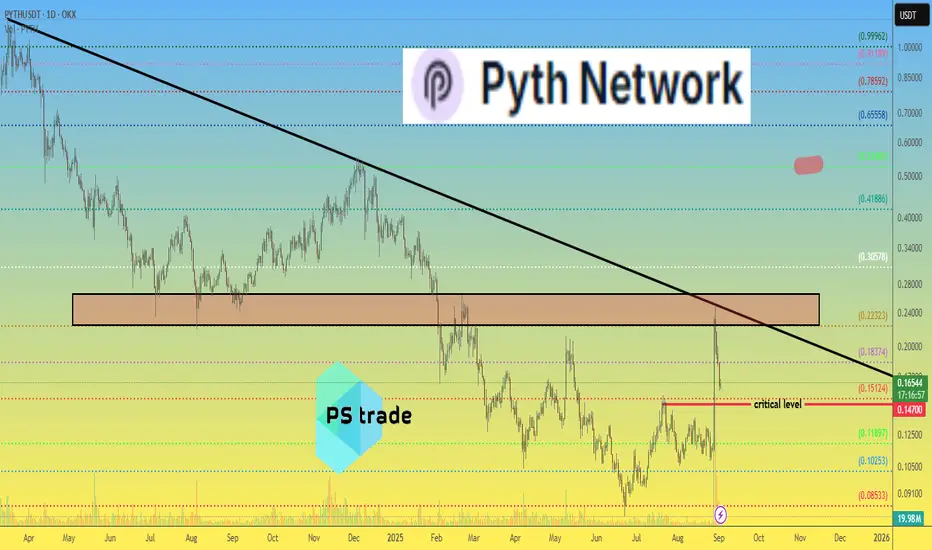
2️⃣ #PYTHUSD hit the descending trendline, stretching back from last year.
Now the key is to hold above the critical $0.147 level to preserve the bullish pattern and keep the growth trend intact 📈
⚡️ For a strong breakout with volume, the market needs time to accumulate strength.
🌍 On a larger scale — $0.50 per #PythNetwork token looks like a very fair price, doesn’t it? 😉
______________
◆ Follow us ❤️ for daily crypto insights & updates!
🚀 Don’t miss out on important market moves
🧠 DYOR | This is not financial advice, just thinking out loud.
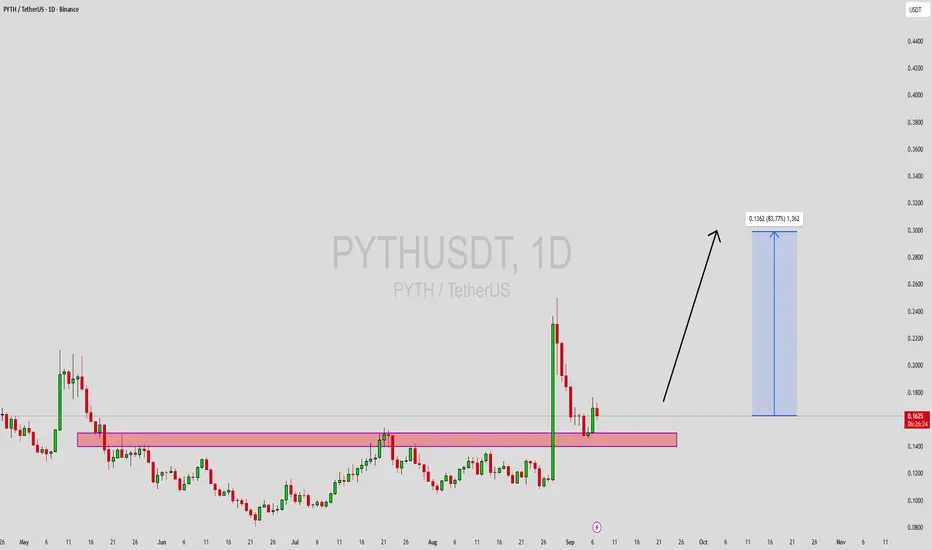
PYTH - bullish setup EURONEXT:PYTH - bullish setup 📈
✅Clean double bottom
✅40%+ retracement happened
✅Monthly support
✅Majors news & adoption on the pipeline
I expect to see another bull rally toward 0.300$+ next!
PYTHUSDT Forming Bullish WavePYTHUSDT is showing a strong bullish wave pattern, signaling the potential for a major upward rally. The recent price action suggests that the market is preparing for a breakout, with higher highs and higher lows forming a strong bullish structure. With expectations of a 70% to 80%+ gain, this setup has caught the attention of traders and investors looking for significant returns in the current market cycle.
The volume for PYTHUSDT has been consistently strong, adding conviction to the bullish momentum. Healthy trading activity indicates that institutional and retail interest is increasing, which is a key driver for sustainable price growth. This surge in volume supports the likelihood of a continuation in the bullish trend, further validating the potential for a sharp breakout.
Investor sentiment is highly positive around this project, with increasing participation reflecting growing confidence in its fundamentals and technical structure. The bullish wave pattern combined with strong investor activity makes PYTH one of the promising tokens to watch closely. Market participants are positioning themselves for the expected breakout, which could fuel rapid gains in the short to mid-term.
Overall, PYTHUSDT is shaping up as a strong bullish candidate in the crypto market. With a bullish wave pattern, strong volume, and rising investor interest, the conditions are set for a potential 70% to 80% rally. Traders should closely watch this pair as it approaches key breakout levels.
✅ Show your support by hitting the like button and
✅ Leaving a comment below! (What is You opinion about this Coin)
Your feedback and engagement keep me inspired to share more insightful market analysis with you!
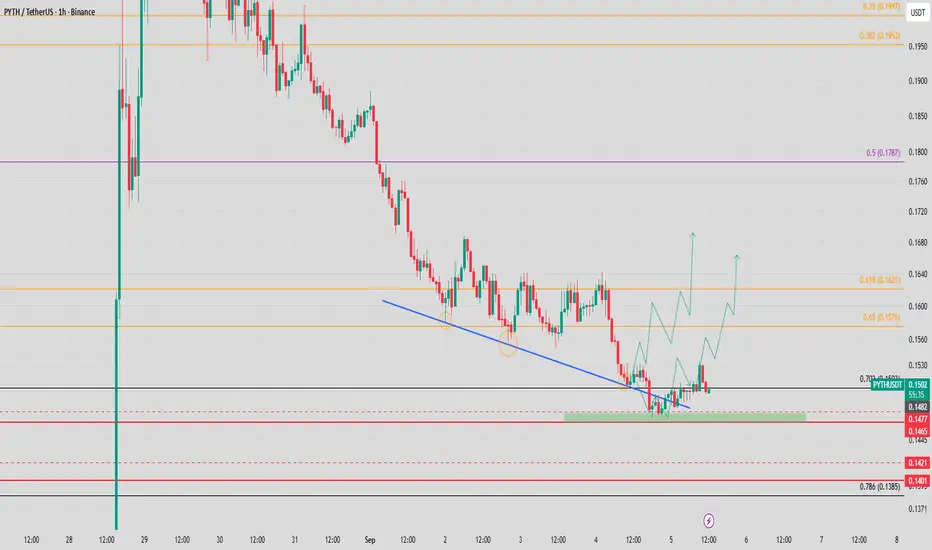
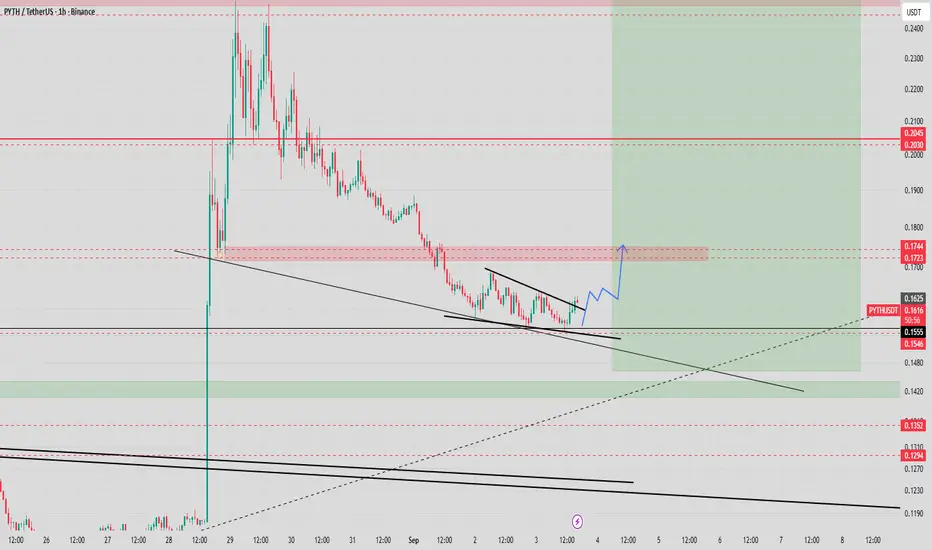
#PYTH/USDT scalp short to 0.1523 #PYTH
The price is moving within a descending channel on the 1-hour frame, adhering well to it, and is heading for a strong breakout and retest.
We have a bearish trend on the RSI indicator that is about to be broken and retested, which supports the decline.
There is a major resistance area (in green) at 0.1833, which represents strong resistance.
For inquiries, please leave a comment.
We are in a consolidation trend below the 100 moving average.
Entry price: 0.1707
First target: 0.1646
Second target: 0.1588
Third target: 0.1523
Don't forget a simple matter: capital management.
When you reach the first target, save some money and then change your stop-loss order to an entry order.
For inquiries, please leave a comment.
Thank you.

PYTH - second TP4 hit!!Impossible not to be happy if you follow me over time… 😏
EURONEXT:PYTH just smashed our Second TP4 ✅
Drop your gains in the comments! 🔥🤑Let’s celebrate those wins together!
PYTH - bullish reaction awaited above 0.1450$ Will EURONEXT:PYTH pump back from this key level I mentionned?
1st entry was bad, but I think it's a good area for bulls here!
Key demand zone 0.1470 - 0.1450$
#PYTH - potential double bottom & key retest EURONEXT:PYTH - update:
Short term = bearish momentum but;
I'm pretty sure that another bottom is going to be see around the current zone here.
Another leg up toward 0.300$ could happen next 📈
Lower key demand zone 0.1400 - 0.1450$
What's your point of view on this one? 👀
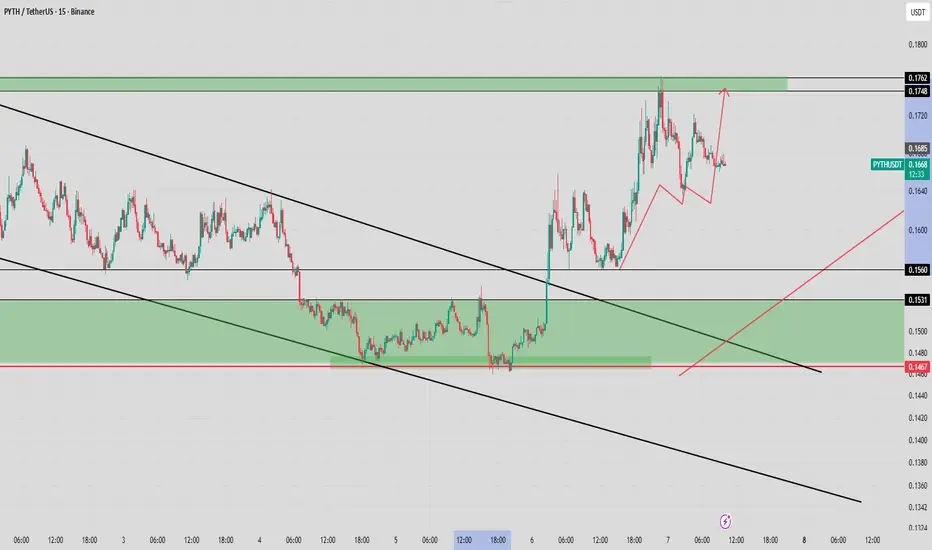
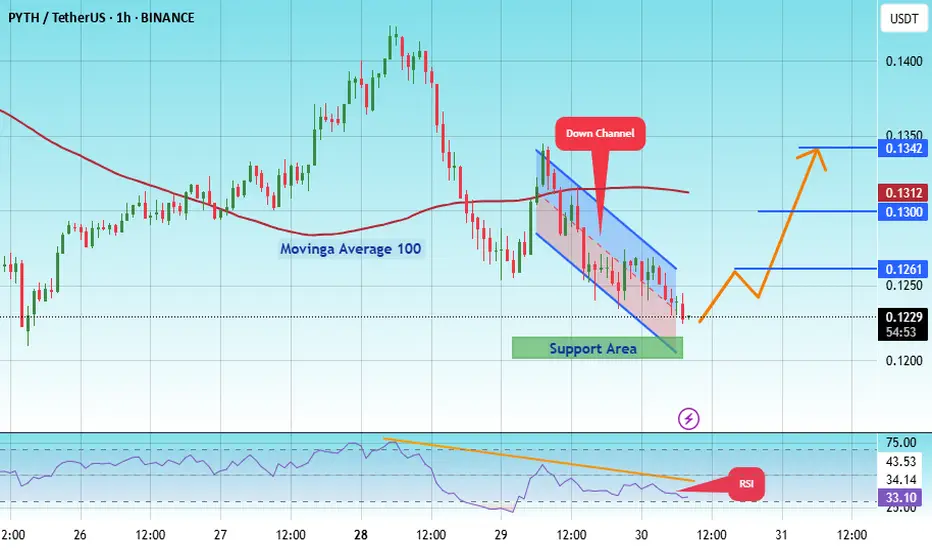
#PYTH/USDT#PYTH
The price is moving within an ascending channel on the 1-hour frame, adhering well to it, and is on track to break it strongly upwards and retest it.
We have support from the lower boundary of the ascending channel, at 1215.
We have a downtrend on the RSI indicator that is about to break and retest, supporting the upside.
There is a major support area in green at 0.1200, which represents a strong basis for the upside.
Don't forget a simple thing: ease and capital.
When you reach the first target, save some money and then change your stop-loss order to an entry order.
For inquiries, please leave a comment.
We have a trend to hold above the 100 Moving Average.
Entry price: 0.1230
First target: 0.1261
Second target: 0.1300
Third target: 0.1342
Don't forget a simple thing: ease and capital.
When you reach your first target, save some money and then change your stop-loss order to an entry order.
For inquiries, please leave a comment.
Thank you.
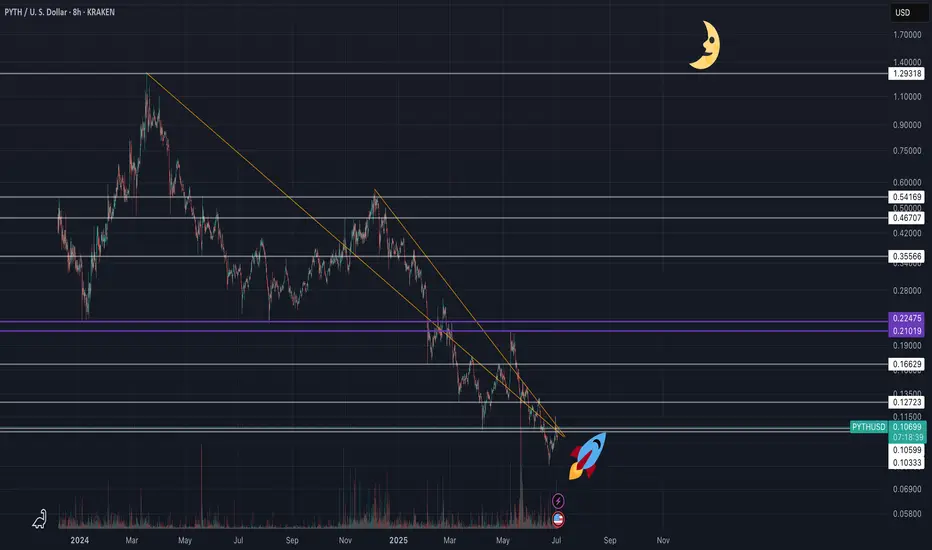
PYTH/USDT Breakout Watch Is the Accumulation Phase Finally Over?📌 Technical Overview:
After nearly 8 months in a strong downtrend, PYTH/USDT is now showing signs of a potential trendline breakout. Price action is testing a critical descending resistance that has been respected since late 2024. This could be the turning point for a major trend reversal.
📉 Historical Context:
PYTH reached a high of $0.55, followed by a consistent downtrend with a series of lower highs and lower lows.
Since June 2025, however, the structure has shifted to higher lows, signaling early accumulation and waning bearish momentum.
📐 Technical Pattern: Descending Trendline Breakout
Price is currently challenging a long-term descending trendline, which has held as resistance since November 2024.
The pattern resembles a falling wedge/descending triangle breakout, typically viewed as a bullish reversal pattern.
A recent bullish candle is attempting to break above the $0.13 level, indicating growing momentum.
🟩 Bullish Scenario: The Reversal is On
If price closes above $0.13–$0.14 and confirms the breakout:
1. Short-Term Targets:
🔼 $0.1736 (Minor resistance / previous demand zone)
🔼 $0.1952 (Breakout retest zone)
2. Mid-Term Targets:
🔼 $0.2457 (Strong consolidation area)
🔼 $0.3196 – $0.3912 (Pre-breakdown range highs)
3. Long-Term Target:
🔼 $0.5258 – $0.5533 (Previous market top)
> A successful breakout could trigger a rally of +200–300%, especially if supported by market-wide bullish sentiment.
🟥 Bearish Scenario: Fakeout Risk
If price fails to hold above the trendline and drops below $0.12:
Support zones to watch:
🔽 $0.1000 (psychological level)
🔽 $0.0860
🔽 $0.0807 (major bottom support)
This would indicate a bull trap, and the market could return to a distribution phase.
🔍 Additional Confluences:
RSI is rising toward 60–65, suggesting bullish momentum is building.
Volume is increasing near the breakout — a good sign of trader interest.
A Golden Cross (EMA 50 crossing EMA 100) could occur soon if upside holds.
✅ Conclusion: Critical Pivot Zone
PYTH is testing a major inflection point. If confirmed, this breakout could end the long-term downtrend and launch a new bullish cycle. A rejection here, however, keeps the bear case alive.
#PYTHUSDT #PYTHBreakout #CryptoAnalysis #AltcoinSetup #TechnicalAnalysis #BreakoutCrypto #TradingView #TrendReversal #CryptoSignals #FallingWedge #BullishMomentum

#PYTH/USDT pump to $ 0.1025soon!#PYTH
The price is moving within a descending channel on the 1-hour frame, adhering well to it, and is on its way to breaking it strongly upwards and retesting it.
We have a bounce from the lower boundary of the descending channel. This support is at 0.0938.
We have a downtrend on the RSI indicator that is about to break and retest, supporting the upside.
There is a major support area in green at 0.0920, which represents a strong basis for the upside.
Don't forget a simple thing: ease and capital.
When you reach the first target, save some money and then change your stop-loss order to an entry order.
For inquiries, please leave a comment.
We have a trend to hold above the 100 Moving Average.
Entry price: 0.0950
First target: 0.0970
Second target: 0.0993
Third target: 0.1025
Don't forget a simple thing: ease and capital.
When you reach the first target, save some money and then change your stop-loss order to an entry order.
For inquiries, please leave a comment.
Thank you.

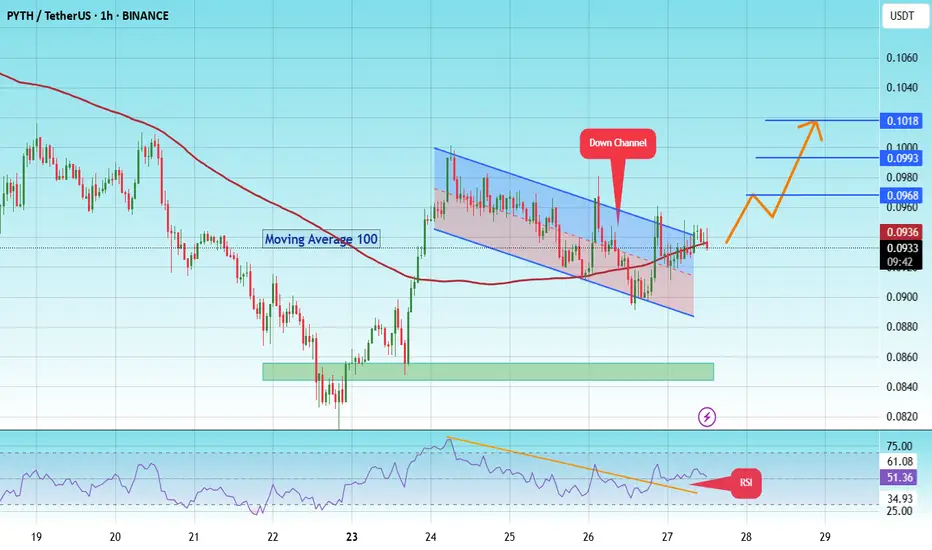
Pyth pump to $0.1018 soon! #PYTH
The price is moving within a descending channel on the 1-hour frame and is expected to break and continue upward.
We have a trend to stabilize above the 100 moving average once again.
We have a downtrend on the RSI indicator that supports the upward break.
We have a support area at the lower boundary of the channel at 0.0895, acting as strong support from which the price can rebound.
We have a major support area in green that pushed the price upward at 0.085.
Entry price: 0.0936
First target: 0.0968
Second target: 0.0993
Third target: 0.1018
To manage risk, don't forget stop loss and capital management.
When you reach the first target, save some profits and then change the stop order to an entry order.
For inquiries, please comment.
Thank you.
PYTH NETWORK (PYTHUSD) - (10X - 50X Potential)Pyth Network is an oracle protocol originally built for Solana, optimized for ultra-low latency and first-party data directly from exchanges and market makers. Unlike Chainlink’s node-aggregator model, Pyth enables real-time price feeds (as fast as 400ms) sourced directly from over 100 institutional providers, including Binance and Cboe.
🧩 Why Pyth?
DeFi apps need fast, accurate pricing to avoid exploits and ensure fair trading. Pyth delivers high-frequency, high-integrity data, especially valuable for derivatives, perpetuals, and high-speed DeFi protocols.
🌐 Massive Expansion
What started on Solana now powers 100+ blockchains, including Ethereum L2s, Cosmos, Sui, Aptos, TON, and more. As of 2025, over 420 protocols integrate Pyth, with over $48B+ monthly trading volume secured. It has become the #2 oracle in DeFi by usage, dominating ecosystems like Solana, Sui, and Injective.
📊 Tokenomics & Unlocks
Max supply: 10B PYTH
Circulating: ~5.75B (mid-2025)
Next major unlock: May 2026 (~2.1B tokens)
Utility: Governance, staking, publisher rewards, and oracle integrity
Pyth’s decentralized governance is growing, with a DAO now guiding key protocol parameters. It’s also expanding beyond price feeds, launching products like randomness (Entropy) and MEV mitigation tools (Express Relay).
Disclaimer: This is not financial advice. Always do your own research before making investment decisions.
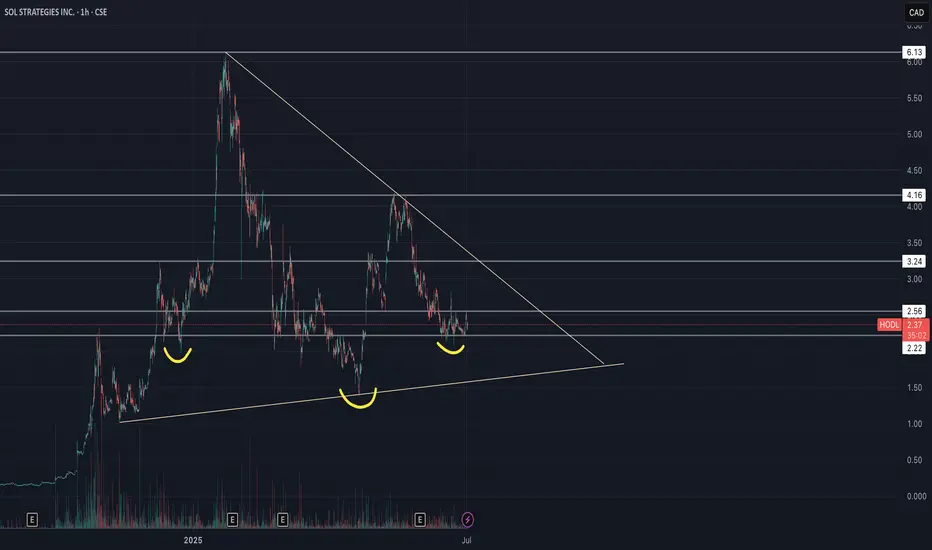
Sol Strategies Inc (HODL) - Inverse H&S🚀 SOL Strategies (HODL) – Public Market Gateway to Solana Yield
SOL Strategies (CSE: HODL) is a publicly traded company laser-focused on the Solana ecosystem. With nearly 395,000 SOL held (most of it staked) and over 3.7 million SOL delegated to their validators, they generate consistent income through staking rewards and validator commissions.
Their business model is simple:
📌 Accumulate SOL → Stake it → Run institutional-grade validators → Earn yield
📌 Expand through partnerships (3iQ, Neptune, BitGo, Pudgy Penguins)
📌 Hold strategic Solana ecosystem tokens like JTO and jitoSOL
📌 Operate with SOC 2-certified infrastructure and pursue a Nasdaq listing
SOL Strategies is not just holding crypto – they are building core infrastructure for Solana, giving equity investors direct exposure to staking economics in one of the fastest-growing blockchain networks.
📊 For traders: HODL stock offers a pure-play vehicle for Solana exposure, with an income-generating twist.
⚠️ Always do your own investment research and make your own decisions before investing.
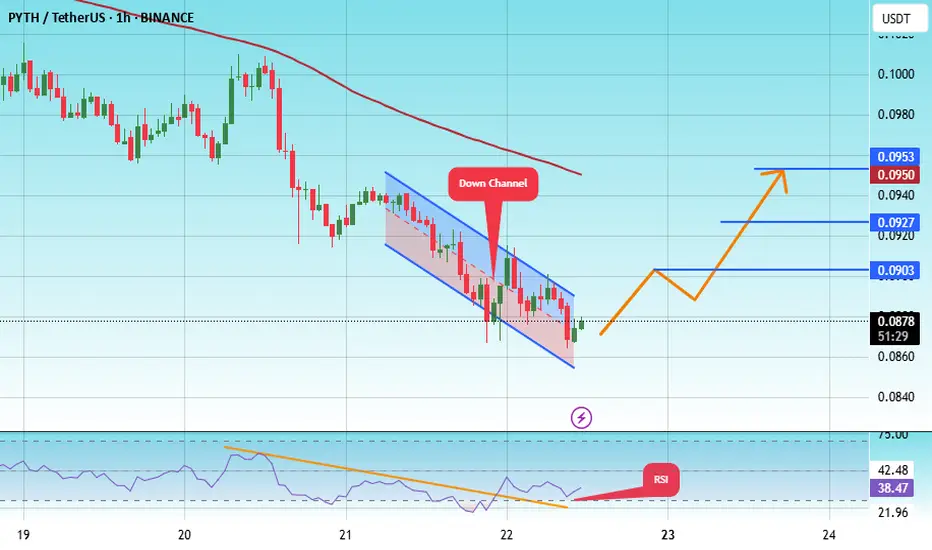
#PYTH/USDT#PYTH
The price is moving within a descending channel on the 1-hour frame, adhering well to it, and is heading for a strong breakout and retest.
We are seeing a bounce from the lower boundary of the descending channel, which is support at 0.0860.
We have a downtrend on the RSI indicator that is about to be broken and retested, supporting the upward trend.
We are looking for stability above the 100 moving average.
Entry price: 0.0880
First target: 0.0903
Second target: 0.0927
Third target: 0.0950
#PYTH/USDT#PYTH
The price is moving within a descending channel on the 1-hour frame, adhering well to it, and is heading toward a strong breakout and retest.
We are experiencing a rebound from the lower boundary of the descending channel. This support is at 0.1030.
We have a downtrend on the RSI indicator that is about to be broken and retested, supporting the upward trend.
We are heading toward stability above the 100 moving average.
Entry price: 0.1080
First target: 0.1111
Second target: 0.1140
Third target: 0.1180

HUGE INCREASES Possible on PYT | Here's WhyPython is a fairly new altcoin with big upside.
From the earlier two charts on the left, we see that initial downturns shouldn't be feared. Historically, SOL and SUI started with downtrends and transitioned into massive upside alts.
Python might especially see parabolic increases, once ETH starts to move towards a new ATH. This will be due to the rotation of liquidity between altcoins in terms of larger and smaller market caps.
Don't miss yesterdays update on ETH!
____________________________
BINANCE:SOLUSDT
COINBASE:SUIUSD
BINANCE:PYTHUSDT

#PYTH/USDT#PYTH
The price is moving within a descending channel on the 1-hour frame, adhering well to it, and is heading for a strong breakout and retest.
We are seeing a bounce from the lower boundary of the descending channel, which is support at 0.1270.
We have a downtrend on the RSI indicator that is about to be broken and retested, supporting the upward trend.
We are looking for stability above the 100 moving average.
Entry price: 0.1280
First target: 0.1322
Second target: 0.1350
Third target: 0.1400

PYTHUSDT | Short Zone at the Blue Box—Proceed with Extra CautionPYTHUSDT is pressing lower with conviction, and the blue box marks our primary area to consider short entries. Although buyers are technically present, their support feels fragile; every test of this zone risks failing unless you have a strong appetite for heightened risk.
Why the Blue Box Matters
• Price has paused here before, making it a logical spot for sellers to reemerge.
• The current decline suggests sellers are in control and likely to defend this zone again.
Conditions for a Short Entry
Lower‑Time‑Frame Breakdown
Observe a clear breakdown pattern on shorter charts—whether a series of lower highs or a decisive support breach.
Volume Confirmation
Seek evidence that selling volume outpaces buying volume as price approaches the blue box.
CDV Divergence
Confirm that cumulative delta volume does not support the rally, indicating genuine exhaustion among buyers.
Entering here demands extra conviction and precise execution. If these confirmations line up, a short trade could offer favorable risk‑reward. Without them, it is wiser to watch from the sidelines until a clearer setup emerges.
📌I keep my charts clean and simple because I believe clarity leads to better decisions.
📌My approach is built on years of experience and a solid track record. I don’t claim to know it all but I’m confident in my ability to spot high-probability setups.
📌If you would like to learn how to use the heatmap, cumulative volume delta and volume footprint techniques that I use below to determine very accurate demand regions, you can send me a private message. I help anyone who wants it completely free of charge.
🔑I have a long list of my proven technique below:
🎯 ZENUSDT.P: Patience & Profitability | %230 Reaction from the Sniper Entry
🐶 DOGEUSDT.P: Next Move
🎨 RENDERUSDT.P: Opportunity of the Month
💎 ETHUSDT.P: Where to Retrace
🟢 BNBUSDT.P: Potential Surge
📊 BTC Dominance: Reaction Zone
🌊 WAVESUSDT.P: Demand Zone Potential
🟣 UNIUSDT.P: Long-Term Trade
🔵 XRPUSDT.P: Entry Zones
🔗 LINKUSDT.P: Follow The River
📈 BTCUSDT.P: Two Key Demand Zones
🟩 POLUSDT: Bullish Momentum
🌟 PENDLEUSDT.P: Where Opportunity Meets Precision
🔥 BTCUSDT.P: Liquidation of Highly Leveraged Longs
🌊 SOLUSDT.P: SOL's Dip - Your Opportunity
🐸 1000PEPEUSDT.P: Prime Bounce Zone Unlocked
🚀 ETHUSDT.P: Set to Explode - Don't Miss This Game Changer
🤖 IQUSDT: Smart Plan
⚡️ PONDUSDT: A Trade Not Taken Is Better Than a Losing One
💼 STMXUSDT: 2 Buying Areas
🐢 TURBOUSDT: Buy Zones and Buyer Presence
🌍 ICPUSDT.P: Massive Upside Potential | Check the Trade Update For Seeing Results
🟠 IDEXUSDT: Spot Buy Area | %26 Profit if You Trade with MSB
📌 USUALUSDT: Buyers Are Active + %70 Profit in Total
🌟 FORTHUSDT: Sniper Entry +%26 Reaction
🐳 QKCUSDT: Sniper Entry +%57 Reaction
📊 BTC.D: Retest of Key Area Highly Likely
📊 XNOUSDT %80 Reaction with a Simple Blue Box!
📊 BELUSDT Amazing %120 Reaction!
📊 Simple Red Box, Extraordinary Results
I stopped adding to the list because it's kinda tiring to add 5-10 charts in every move but you can check my profile and see that it goes on..
