PYTH/USDT — the Final Defense Before a Potential Breakout Move?PYTH is now trading at a critical turning point, hovering right above the major demand zone at 0.100–0.089 USDT (yellow block).
This area has acted as a strong defensive wall for buyers several times in the past.
However, persistent lower highs under the descending trendline are showing strong selling pressure, forming a descending triangle pattern — a classic sign of market compression before a major move.
As volume gradually declines, the chart suggests that energy is building up for a breakout or breakdown.
The next move from this structure will likely define PYTH’s direction for the next few weeks.
---
🟢 Bullish Scenario
Key condition: Breakout and 12H candle close above the descending trendline and 0.120 USDT, ideally with strong volume confirmation.
Once confirmed, PYTH could start reversing its structure with the following upside targets:
🎯 Target 1: 0.140 (nearest resistance)
🎯 Target 2: 0.165 (previous supply zone)
🎯 Target 3: 0.231–0.250 (major resistance / previous high)
As long as price holds above 0.100, the structure remains valid for a potential bullish reversal.
Suggested stop-loss: below 0.095 (or based on personal risk tolerance).
💬 “A breakout above the trendline could be the first signal of a major reversal. Volume confirmation is key.”
---
🔴 Bearish Scenario
If the price fails to break above the trendline and instead closes below 0.089 USDT, bearish momentum could accelerate sharply.
A confirmed breakdown below this demand area might trigger a stop-loss cascade or panic selling, targeting:
⚠️ Target 1: 0.070
⚠️ Target 2: 0.050
This zone represents the last stand for the bulls — losing it could shift the market into a new bearish phase.
💬 “If 0.089 breaks, strong support becomes a dangerous resistance.”
---
⚙️ Technical Summary
Pattern: Descending Triangle
Strong Support Zone: 0.100–0.089
Bullish Trigger: 12H close above 0.120
Bearish Trigger: 12H close below 0.089
Market Condition: Price compression under pressure — a large directional move is likely approaching.
---
💡 Trader Insight
> “The longer price stays compressed under pressure,
the stronger the breakout potential becomes.
Direction is uncertain — but the storm is near.”
#PYTH #PYTHUSDT #Crypto #TechnicalAnalysis #DescendingTriangle #Breakout #SupportResistance #CryptoChart #PriceAction #AltcoinSetup
Pythusdc

PYTH/USDT Breakout Watch Is the Accumulation Phase Finally Over?📌 Technical Overview:
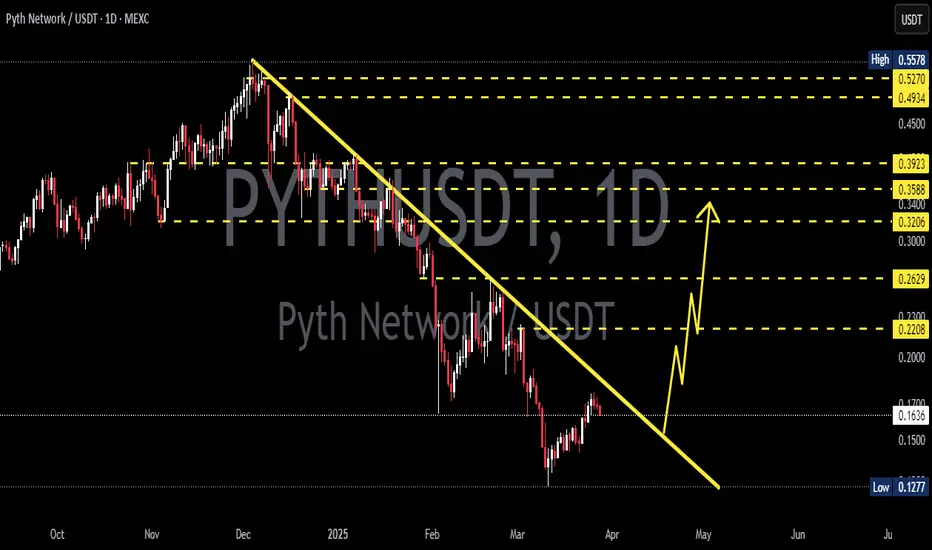
After nearly 8 months in a strong downtrend, PYTH/USDT is now showing signs of a potential trendline breakout. Price action is testing a critical descending resistance that has been respected since late 2024. This could be the turning point for a major trend reversal.
📉 Historical Context:
PYTH reached a high of $0.55, followed by a consistent downtrend with a series of lower highs and lower lows.
Since June 2025, however, the structure has shifted to higher lows, signaling early accumulation and waning bearish momentum.
📐 Technical Pattern: Descending Trendline Breakout
Price is currently challenging a long-term descending trendline, which has held as resistance since November 2024.
The pattern resembles a falling wedge/descending triangle breakout, typically viewed as a bullish reversal pattern.
A recent bullish candle is attempting to break above the $0.13 level, indicating growing momentum.
🟩 Bullish Scenario: The Reversal is On
If price closes above $0.13–$0.14 and confirms the breakout:
1. Short-Term Targets:
🔼 $0.1736 (Minor resistance / previous demand zone)
🔼 $0.1952 (Breakout retest zone)
2. Mid-Term Targets:
🔼 $0.2457 (Strong consolidation area)
🔼 $0.3196 – $0.3912 (Pre-breakdown range highs)
3. Long-Term Target:
🔼 $0.5258 – $0.5533 (Previous market top)
> A successful breakout could trigger a rally of +200–300%, especially if supported by market-wide bullish sentiment.
🟥 Bearish Scenario: Fakeout Risk
If price fails to hold above the trendline and drops below $0.12:
Support zones to watch:
🔽 $0.1000 (psychological level)
🔽 $0.0860
🔽 $0.0807 (major bottom support)
This would indicate a bull trap, and the market could return to a distribution phase.
🔍 Additional Confluences:
RSI is rising toward 60–65, suggesting bullish momentum is building.
Volume is increasing near the breakout — a good sign of trader interest.
A Golden Cross (EMA 50 crossing EMA 100) could occur soon if upside holds.
✅ Conclusion: Critical Pivot Zone
PYTH is testing a major inflection point. If confirmed, this breakout could end the long-term downtrend and launch a new bullish cycle. A rejection here, however, keeps the bear case alive.
#PYTHUSDT #PYTHBreakout #CryptoAnalysis #AltcoinSetup #TechnicalAnalysis #BreakoutCrypto #TradingView #TrendReversal #CryptoSignals #FallingWedge #BullishMomentum

#PYTH/USDT#PYTH
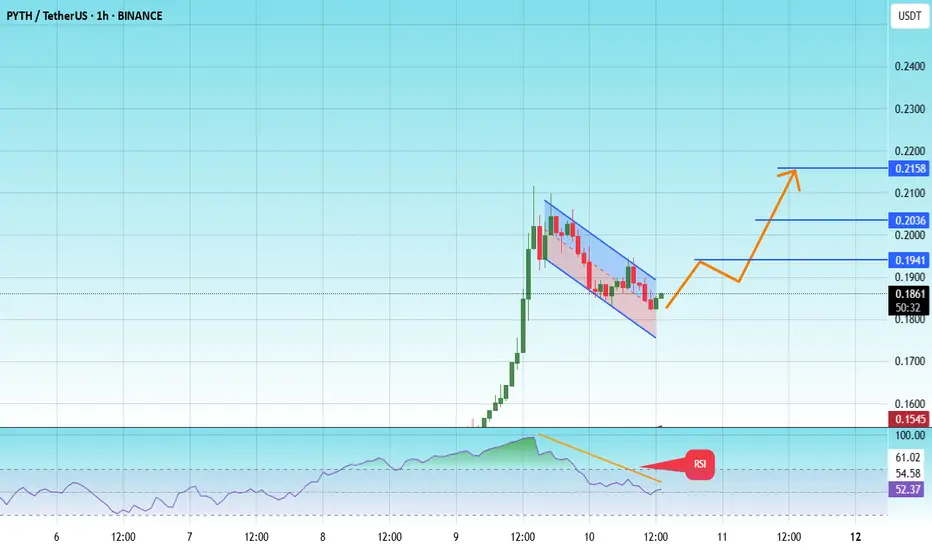
The price is moving within a descending channel on the 1-hour frame and is expected to break and continue upward.
We have a trend to stabilize above the 100 moving average once again.
We have a downtrend on the RSI indicator that supports the upward move with a breakout.
We have a support area at the lower limit of the channel at 0.1800, which acts as strong support from which the price can rebound.
Entry price: 0.1860
First target: 0.1941
Second target: 0.2036
Third target: 0.2160
PYTHUSDT 1DPYTH ~ 1D Analysis
#PYTH Buy gradually after successfully penetrating this resistant line with a short -term target of at least 10%+.
PYTH taget $1.45 (perp)4h time frame
-
TP: $1.4~$1.53
SL: $0.426
-
PYTH follows the Elliott 2nd wave with being sold off since $1.15, but got support from the structural support zone and 0.382 Fibonacci projection, both form a robust bottom at $0.5 so far. If PYTH goes the assumed path, I can say next big pump, made of Elliott 3rd wave, is following and will bring PYTH to make ATH soon. It is hard to estimate critical resistance once PYTH goes over $1.15, so we can use Fibonacci tool to set up the target to profit around $1.4~$1.53, which RRR is over 8.
-
Refer to link below if you're interested in my perspective of Bull High of PYTH.
