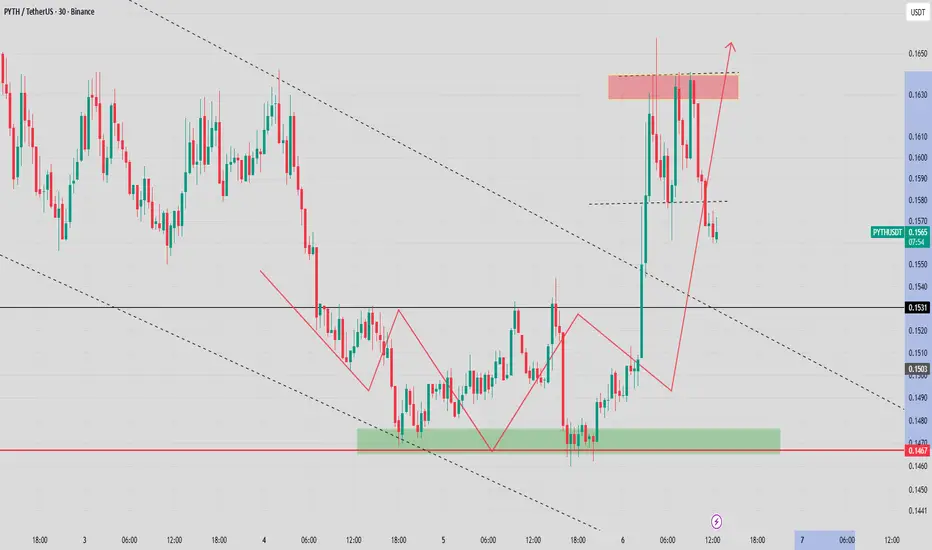
PYTH needs to get the party startedPYTH is sitting on a major demand zone, and momentum is finally showing bullish divergence. Sellers look exhausted, and the volume profile above is thin — meaning any reclaim of this level could trigger a sharp relief move.
Hold this zone and PYTH has room to bounce.
Lose it and the chart hunts lower liquidity.
Key moment for PYTH.
What’s your read?
PYTHUSDT

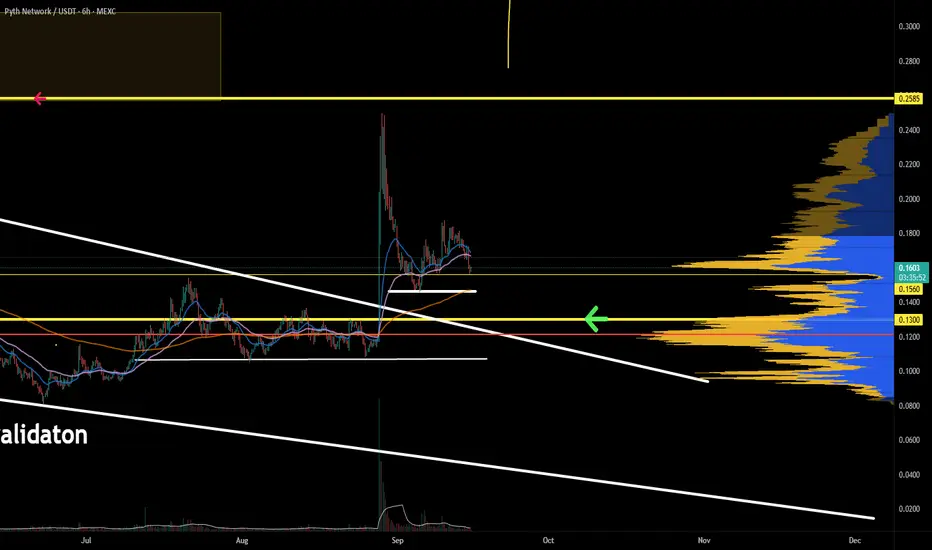
PYTH/USDT — the Final Defense Before a Potential Breakout Move?PYTH is now trading at a critical turning point, hovering right above the major demand zone at 0.100–0.089 USDT (yellow block).
This area has acted as a strong defensive wall for buyers several times in the past.
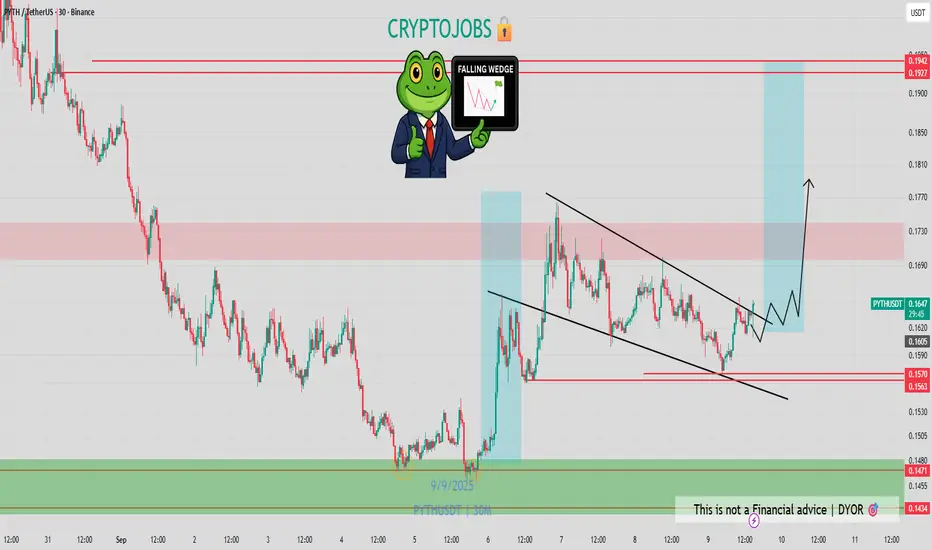
However, persistent lower highs under the descending trendline are showing strong selling pressure, forming a descending triangle pattern — a classic sign of market compression before a major move.
As volume gradually declines, the chart suggests that energy is building up for a breakout or breakdown.
The next move from this structure will likely define PYTH’s direction for the next few weeks.
---
🟢 Bullish Scenario
Key condition: Breakout and 12H candle close above the descending trendline and 0.120 USDT, ideally with strong volume confirmation.
Once confirmed, PYTH could start reversing its structure with the following upside targets:
🎯 Target 1: 0.140 (nearest resistance)
🎯 Target 2: 0.165 (previous supply zone)
🎯 Target 3: 0.231–0.250 (major resistance / previous high)
As long as price holds above 0.100, the structure remains valid for a potential bullish reversal.
Suggested stop-loss: below 0.095 (or based on personal risk tolerance).
💬 “A breakout above the trendline could be the first signal of a major reversal. Volume confirmation is key.”
---
🔴 Bearish Scenario
If the price fails to break above the trendline and instead closes below 0.089 USDT, bearish momentum could accelerate sharply.
A confirmed breakdown below this demand area might trigger a stop-loss cascade or panic selling, targeting:
⚠️ Target 1: 0.070
⚠️ Target 2: 0.050
This zone represents the last stand for the bulls — losing it could shift the market into a new bearish phase.
💬 “If 0.089 breaks, strong support becomes a dangerous resistance.”
---
⚙️ Technical Summary
Pattern: Descending Triangle
Strong Support Zone: 0.100–0.089
Bullish Trigger: 12H close above 0.120
Bearish Trigger: 12H close below 0.089
Market Condition: Price compression under pressure — a large directional move is likely approaching.
---
💡 Trader Insight
> “The longer price stays compressed under pressure,
the stronger the breakout potential becomes.
Direction is uncertain — but the storm is near.”
#PYTH #PYTHUSDT #Crypto #TechnicalAnalysis #DescendingTriangle #Breakout #SupportResistance #CryptoChart #PriceAction #AltcoinSetup

YTHUSDT Analysis – The Biggest Market Crash Yet!👋 Welcome to TradeCityPro Channel!
🌐 Overview of Bitcoin
Before we begin, let me remind you that we’ve moved the Bitcoin analysis section to a separate daily report at your request, so we can go into more detail about Bitcoin’s condition, price action, and dominance:
🌙 Last night, the crypto market witnessed a massive liquidation of nearly $19 billion, marking one of the biggest crashes in the history of digital assets.
📈 At this point, trading or buying in these zones isn’t logical it’s better to stay out of the market for a few days, watch the price action, and let volatility settle before making any moves.
🔥 Weekly Time Frame
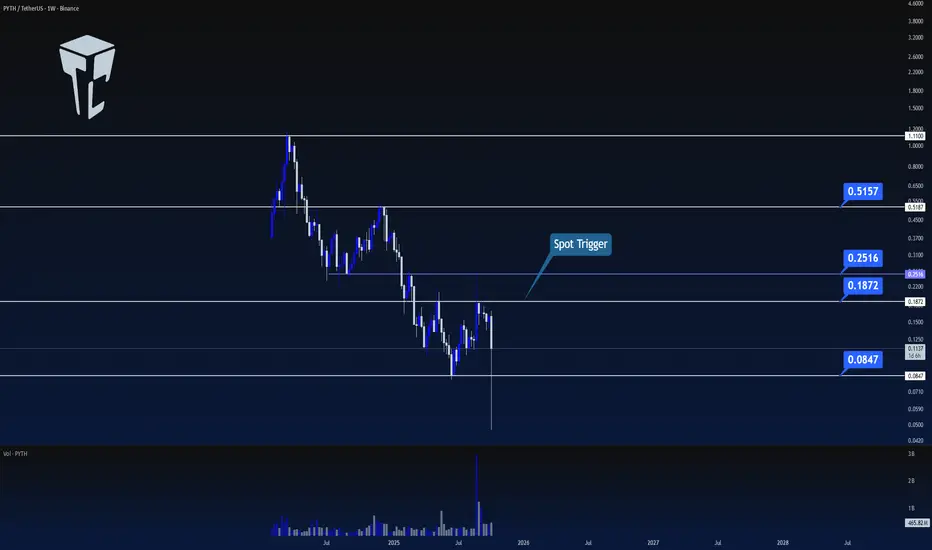
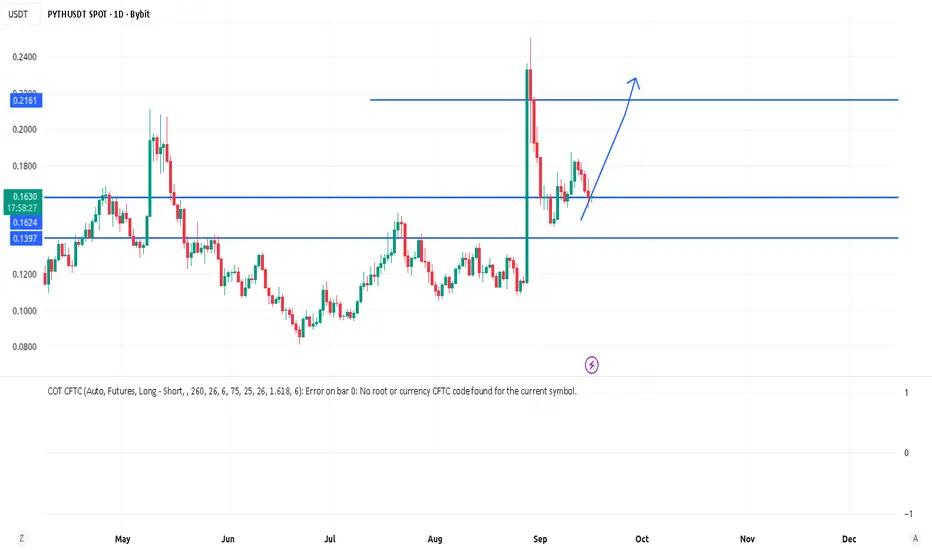
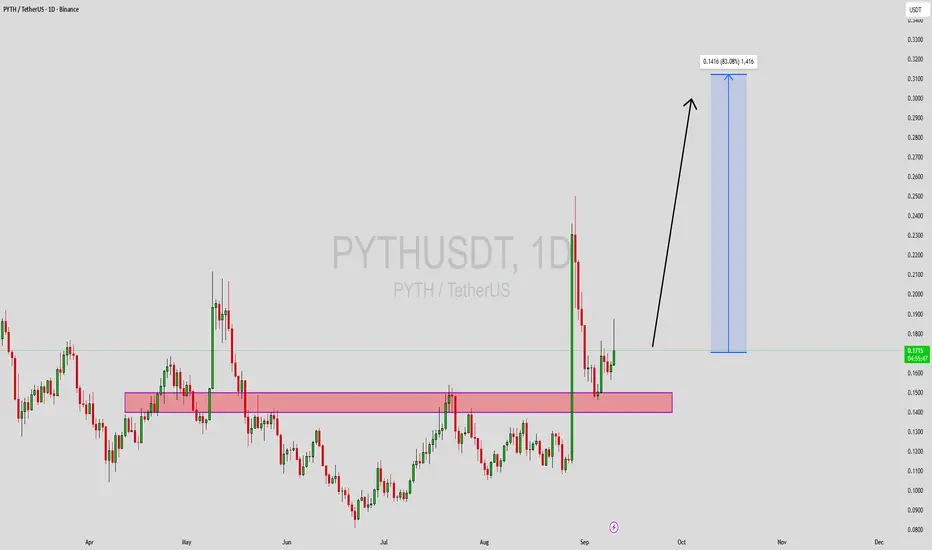
After a 92% drop from its all-time high, PYTH is currently consolidating below the resistance level at $0.1851.
This area is crucial it’s acting as both a psychological and technical barrier where the next trend direction will be defined.
🟢 Spot & Long Entry Setup
⛏ If this weekly candle turns green and we see confirmation, that could become one of the best bullish triggers for accumulation.
However, the main confirmation will be the breakout above $0.1851, which would give us a solid long entry setup.
✍️ Personally, I’m planning to open a long futures position once $0.1851 breaks, and if we later break above $0.2532, I’ll use my futures profits to buy PYTH in spot and hold for a potential longer-term recovery.
📝 Final Thoughts
Stay calm, trade wisely, and let's capture the market's best opportunities!
This analysis reflects our opinions and is not financial advice.
Share your thoughts in the comments, and don’t forget to share this analysis with your friends! ❤️
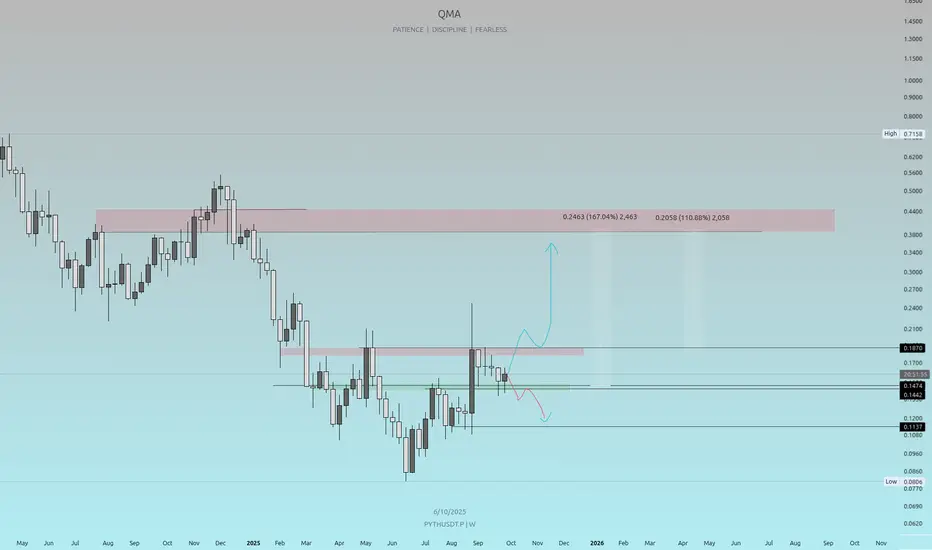
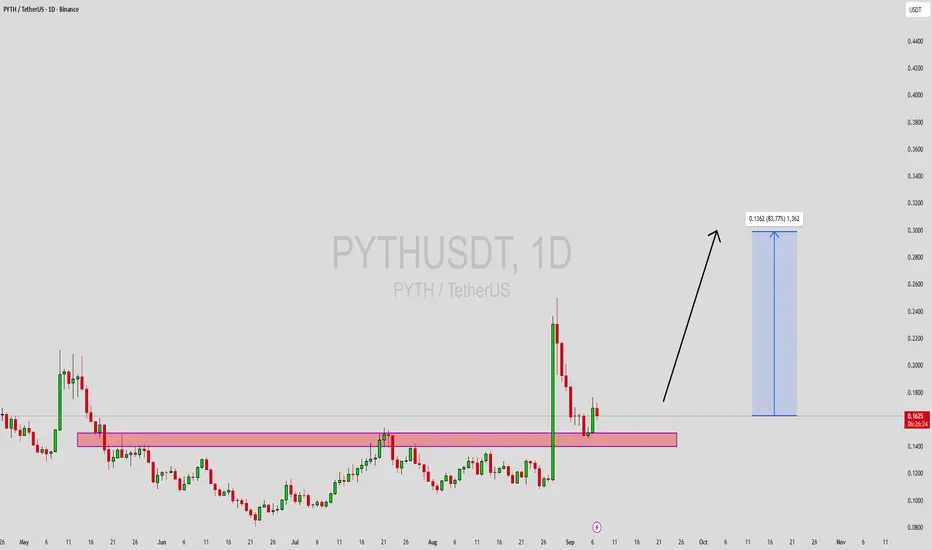
PYTHUSDT Weekly Analysis Is PYTH breaking out for a strong move up or gearing for a correction? This analysis identifies key levels to watch for high-probability entries and exits.
Price Levels to Watch:
Resistance Zone: $0.44–$0.50 (major supply area)
Intermediate Resistance: $0.1870
Current Price Support: $0.1445
Support Zone: $0.1137
Scenarios:
🔵 Bullish: Break and hold above $0.1870 could trigger a move to $0.44+. Possible gains over 100%!
🔴 Bearish: Failure to hold $0.1445 support may lead to retest of $0.0860 region.
Why This Setup?
Clear supply/demand zones highlight significant trader interest.
Weekly timeframe support/resistance for swing trading opportunities.
Focus on patient, disciplined entries with risk management
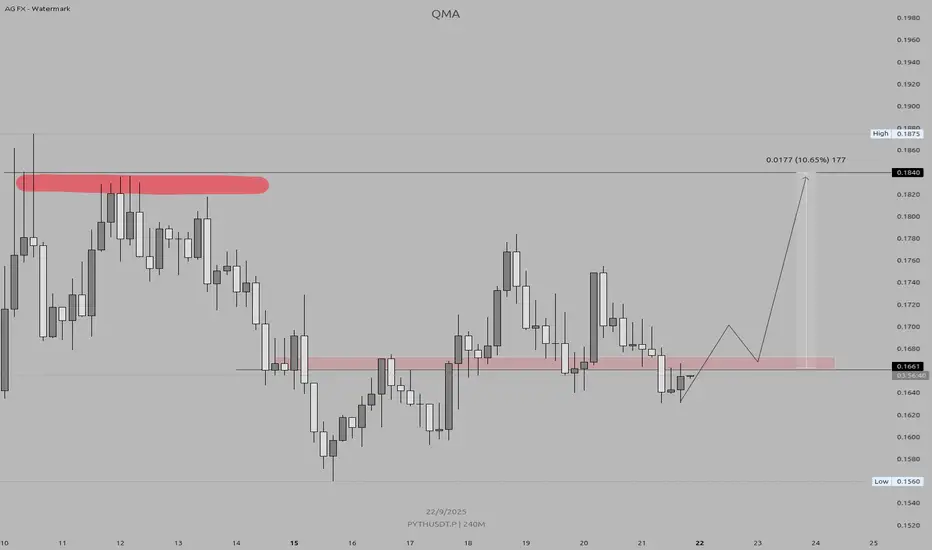
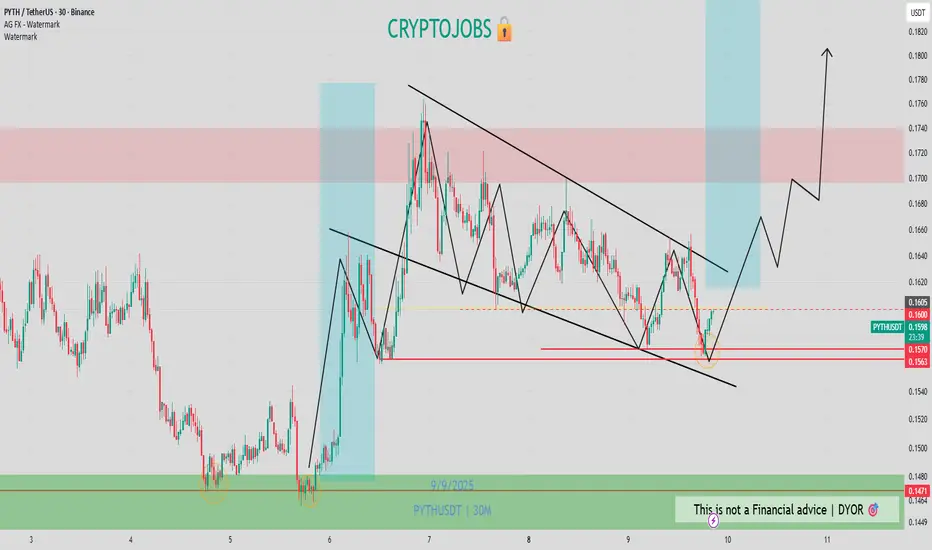
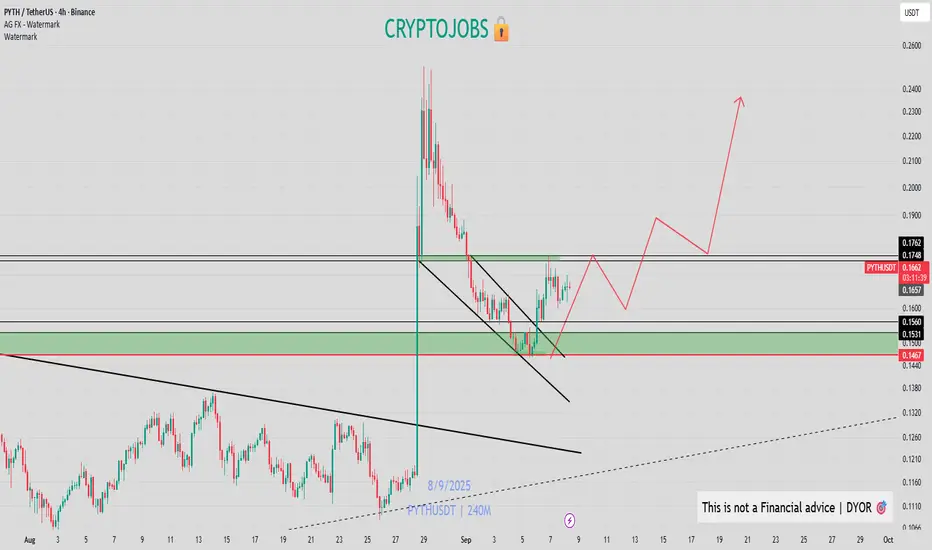
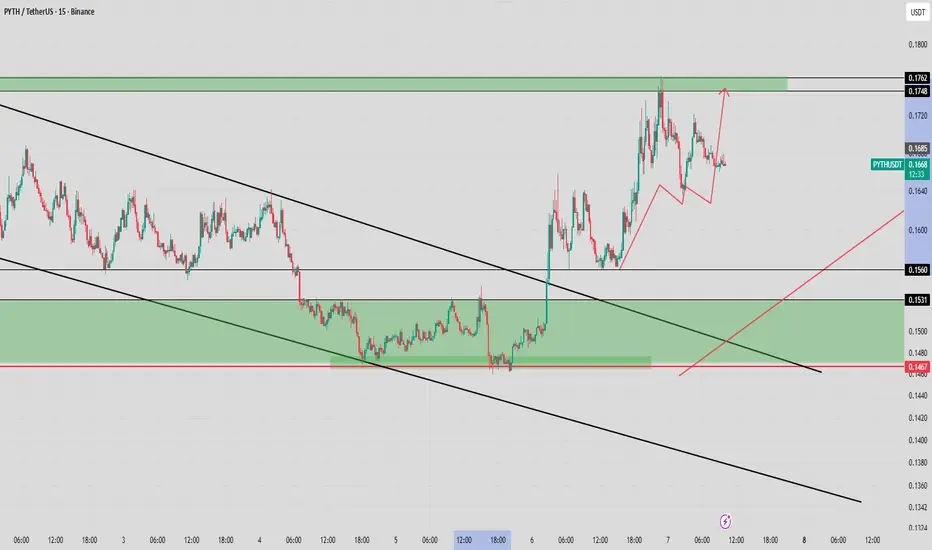
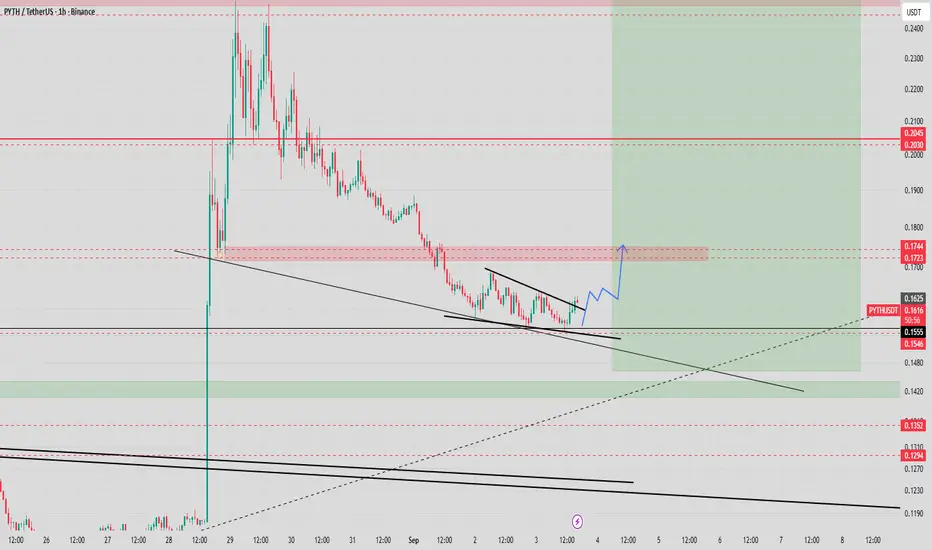
PYTH/USDT – Bullish Re-Test SetupKey Level: 0.167 (Previous Support → Now Resistance)
Target: 0.18 – 0.185
Timeframe: 4H (240M)
✅ Trade Conditions:
Price must reclaim and close above 0.167 on the 4-hour candle.
This confirms bullish strength and breaks the previous downtrend.
🎯 Action:
Enter on close above 0.167
Stop Loss: Below 0.160 (support breakdown)
Take Profit: 0.18 → 0.185
💡 Why?
The zone around 0.167 was strong support earlier. If bulls reclaim it with a strong close, it signals momentum shift. The path of least resistance is now toward 0.18, where prior resistance lies.
🔥 Watch for confirmation — no fakeouts. Only trade if the 4H candle closes cleanly above 0.167.
#PYTH #CryptoTrading #DayTrading #Breakout #TradingView
ATOMUSDT | Short From Red Box, Long-Term SetupResistance Zone;
ATOMUSDT is facing heavy resistance at the red box, making it an attractive short entry zone. Structure shows sellers remain active here, and momentum hasn’t shifted yet.
Risk Management;
For risk management, I’m anchoring this setup with a stop at 7.9. That level is key a breakout and retest above it would invalidate the short idea and open the door for bullish continuation.
Bias and Conditions;
Until then, the bias stays short. CDV is not showing strong buyer commitment, and footprint still reflects selling pressure. As long as those conditions hold, the short idea has weight.
Trade Style;
This is a long-term play, not a quick scalp. Patience is required.
📌I keep my charts clean and simple because I believe clarity leads to better decisions.
📌My approach is built on years of experience and a solid track record. I don’t claim to know it all but I’m confident in my ability to spot high-probability setups.
📌If you would like to learn how to use the heatmap, cumulative volume delta and volume footprint techniques that I use below to determine very accurate demand regions, you can send me a private message. I help anyone who wants it completely free of charge.
🔑I have a long list of my proven technique below:
🎯 ZENUSDT.P: Patience & Profitability | %230 Reaction from the Sniper Entry
🐶 DOGEUSDT.P: Next Move
🎨 RENDERUSDT.P: Opportunity of the Month
💎 ETHUSDT.P: Where to Retrace
🟢 BNBUSDT.P: Potential Surge
📊 BTC Dominance: Reaction Zone
🌊 WAVESUSDT.P: Demand Zone Potential
🟣 UNIUSDT.P: Long-Term Trade
🔵 XRPUSDT.P: Entry Zones
🔗 LINKUSDT.P: Follow The River
📈 BTCUSDT.P: Two Key Demand Zones
🟩 POLUSDT: Bullish Momentum
🌟 PENDLEUSDT.P: Where Opportunity Meets Precision
🔥 BTCUSDT.P: Liquidation of Highly Leveraged Longs
🌊 SOLUSDT.P: SOL's Dip - Your Opportunity
🐸 1000PEPEUSDT.P: Prime Bounce Zone Unlocked
🚀 ETHUSDT.P: Set to Explode - Don't Miss This Game Changer
🤖 IQUSDT: Smart Plan
⚡️ PONDUSDT: A Trade Not Taken Is Better Than a Losing One
💼 STMXUSDT: 2 Buying Areas
🐢 TURBOUSDT: Buy Zones and Buyer Presence
🌍 ICPUSDT.P: Massive Upside Potential | Check the Trade Update For Seeing Results
🟠 IDEXUSDT: Spot Buy Area | %26 Profit if You Trade with MSB
📌 USUALUSDT: Buyers Are Active + %70 Profit in Total
🌟 FORTHUSDT: Sniper Entry +%26 Reaction
🐳 QKCUSDT: Sniper Entry +%57 Reaction
📊 BTC.D: Retest of Key Area Highly Likely
📊 XNOUSDT %80 Reaction with a Simple Blue Box!
📊 BELUSDT Amazing %120 Reaction!
📊 Simple Red Box, Extraordinary Results
📊 TIAUSDT | Still No Buyers—Maintaining a Bearish Outlook
📊 OGNUSDT | One of Today’s Highest Volume Gainers – +32.44%
📊 TRXUSDT - I Do My Thing Again
📊 FLOKIUSDT - +%100 From Blue Box!
📊 SFP/USDT - Perfect Entry %80 Profit!
📊 AAVEUSDT - WE DID IT AGAIN!
I stopped adding to the list because it's kinda tiring to add 5-10 charts in every move but you can check my profile and see that it goes on..
pyth can jump soon !BINANCE:PYTHUSDT showing strong support near 14 and expecting an upside movement soon.
Note: I'm not a good analyst. Just sharing my thoughts. Also ignore my horrible drawing .
Thanks
PYTH hunting liquidity near the breakout zonePYTH is in a retrament back to levels at which market participation traded a breakout. This zone has liquidity to be hunted, and it may get swept. Unless PYTH price action prints a reversal structure, the price is likely to fall to liquidity zones of the past. Prepare.
Bullish ascending accumulation! EURONEXT:PYTH - Bullish ascending accumulation?? 🚀
The next move could be explosive 📈
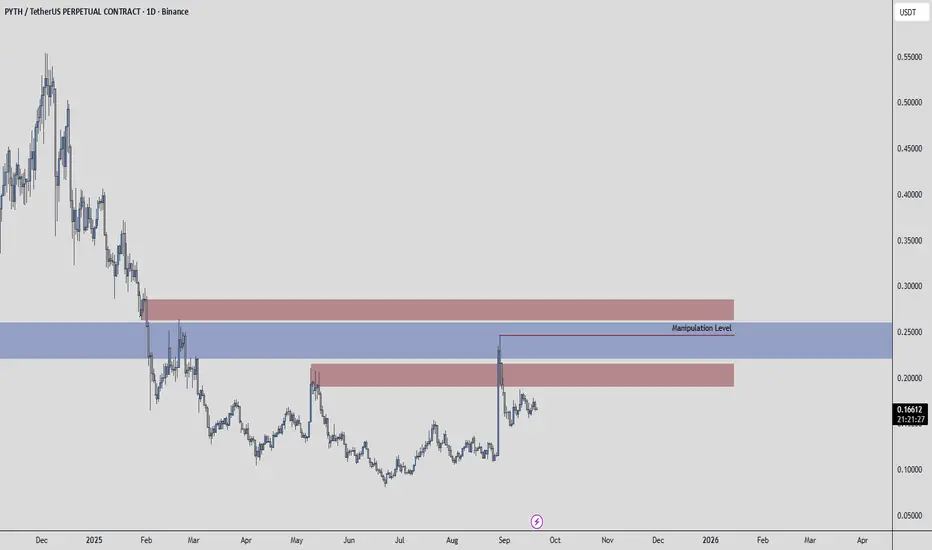
PythNetwork PYTH price analysis🔥 Recently, #PYTH delivered a real X2 show!
But if you’re expecting an immediate continuation of the rally — probably not ❌
📌 Why:
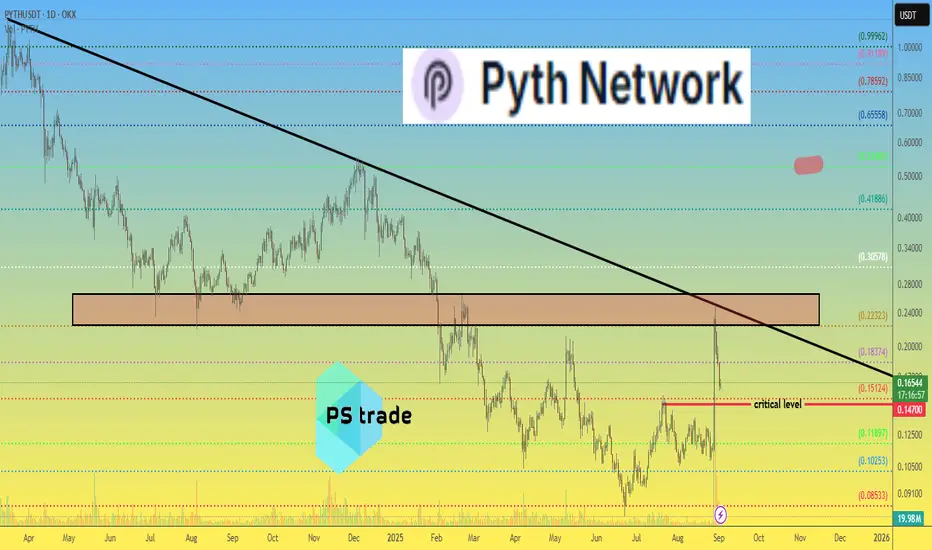
1️⃣ OKX:PYTHUSDT has entered a strong liquidity zone at $0.225–0.265.
2️⃣ #PYTHUSD hit the descending trendline, stretching back from last year.
Now the key is to hold above the critical $0.147 level to preserve the bullish pattern and keep the growth trend intact 📈
⚡️ For a strong breakout with volume, the market needs time to accumulate strength.
🌍 On a larger scale — $0.50 per #PythNetwork token looks like a very fair price, doesn’t it? 😉
______________
◆ Follow us ❤️ for daily crypto insights & updates!
🚀 Don’t miss out on important market moves
🧠 DYOR | This is not financial advice, just thinking out loud.
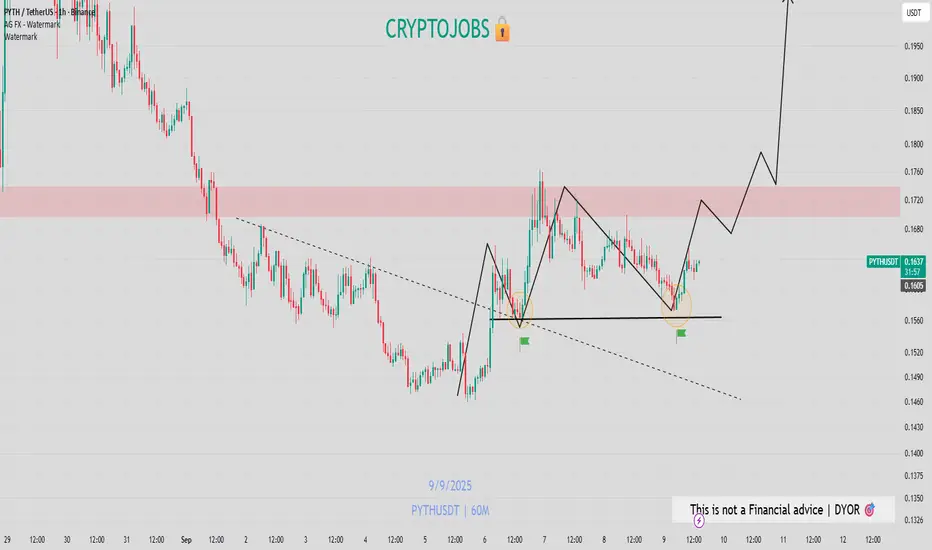
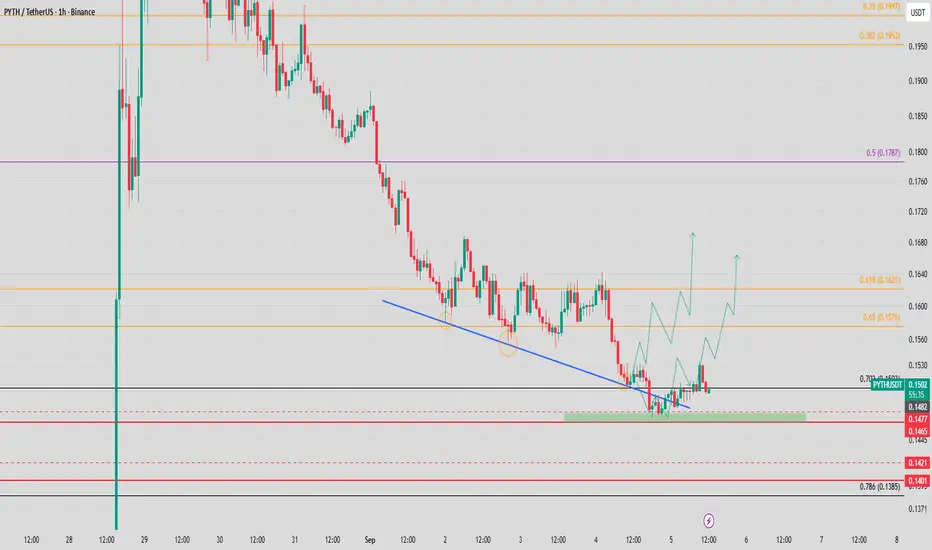
PYTHUSDT Forming Bullish WavePYTHUSDT is showing a strong technical recovery after successfully retesting a key support zone. The price action indicates growing buying pressure as the coin establishes a solid base for the next bullish move. With good trading volume backing the recent surge, market sentiment is leaning positive, and the setup suggests that PYTH could be preparing for a significant rally. The expected upside potential for this move is around 70% to 80%+, which makes this pair highly attractive for both short-term and swing traders.
The current structure highlights that PYTHUSDT has broken past its accumulation range, creating a new bullish wave. This type of breakout often signals the start of a larger upward trend, especially when accompanied by increased market participation. The strength of the bounce from support levels confirms that buyers are stepping in with confidence, pushing momentum in favor of bulls.
With investor interest continuing to grow, PYTH is positioned to capitalize on market liquidity and expand further to the upside. If momentum sustains, the coin could see strong rallies toward new resistance levels in the coming days and weeks. This setup adds PYTHUSDT to the list of coins worth closely monitoring for high-percentage growth opportunities.
✅ Show your support by hitting the like button and
✅ Leaving a comment below! (What is You opinion about this Coin)
Your feedback and engagement keep me inspired to share more insightful market analysis with you!
PYTH - avoid short term market noise! Holding EURONEXT:PYTH for now, structure is really clean 📈
Short term market noise is just here to get you out of this market with empty wallet!
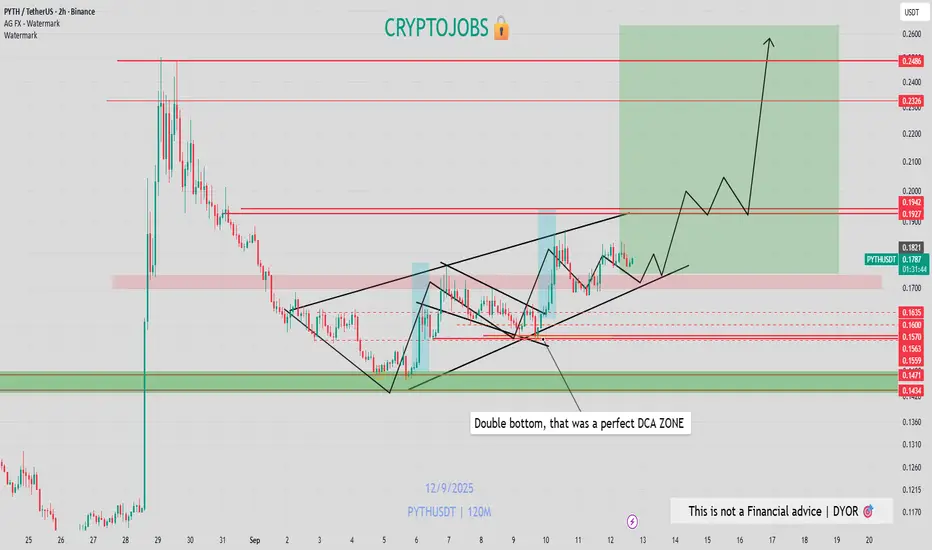
PYTH - bullish setup EURONEXT:PYTH - bullish setup 📈
✅Clean double bottom
✅40%+ retracement happened
✅Monthly support
✅Majors news & adoption on the pipeline
I expect to see another bull rally toward 0.300$+ next!
PYTHUSDT Forming Bullish WavePYTHUSDT is showing a strong bullish wave pattern, signaling the potential for a major upward rally. The recent price action suggests that the market is preparing for a breakout, with higher highs and higher lows forming a strong bullish structure. With expectations of a 70% to 80%+ gain, this setup has caught the attention of traders and investors looking for significant returns in the current market cycle.
The volume for PYTHUSDT has been consistently strong, adding conviction to the bullish momentum. Healthy trading activity indicates that institutional and retail interest is increasing, which is a key driver for sustainable price growth. This surge in volume supports the likelihood of a continuation in the bullish trend, further validating the potential for a sharp breakout.
Investor sentiment is highly positive around this project, with increasing participation reflecting growing confidence in its fundamentals and technical structure. The bullish wave pattern combined with strong investor activity makes PYTH one of the promising tokens to watch closely. Market participants are positioning themselves for the expected breakout, which could fuel rapid gains in the short to mid-term.
Overall, PYTHUSDT is shaping up as a strong bullish candidate in the crypto market. With a bullish wave pattern, strong volume, and rising investor interest, the conditions are set for a potential 70% to 80% rally. Traders should closely watch this pair as it approaches key breakout levels.
✅ Show your support by hitting the like button and
✅ Leaving a comment below! (What is You opinion about this Coin)
Your feedback and engagement keep me inspired to share more insightful market analysis with you!
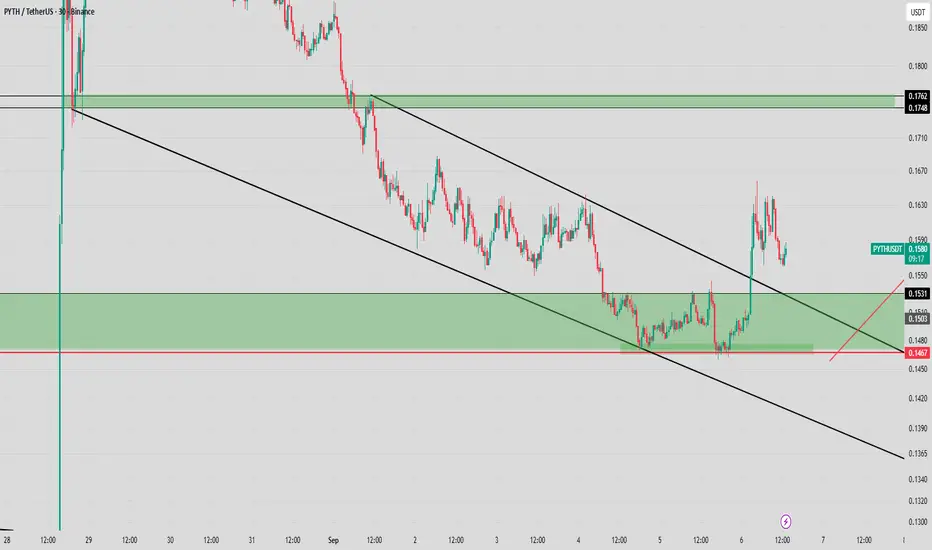
#PYTH/USDT scalp short to 0.1523 #PYTH
The price is moving within a descending channel on the 1-hour frame, adhering well to it, and is heading for a strong breakout and retest.
We have a bearish trend on the RSI indicator that is about to be broken and retested, which supports the decline.
There is a major resistance area (in green) at 0.1833, which represents strong resistance.
For inquiries, please leave a comment.
We are in a consolidation trend below the 100 moving average.
Entry price: 0.1707
First target: 0.1646
Second target: 0.1588
Third target: 0.1523
Don't forget a simple matter: capital management.
When you reach the first target, save some money and then change your stop-loss order to an entry order.
For inquiries, please leave a comment.
Thank you.

PYTH - second TP4 hit!!Impossible not to be happy if you follow me over time… 😏
EURONEXT:PYTH just smashed our Second TP4 ✅
Drop your gains in the comments! 🔥🤑Let’s celebrate those wins together!
Pyth is gonna fileld the gap! As mentionned yesterday, it was the bottom on #PYTH 🔥
After the 40% correction downard, this may be a key bottom before to see a new high. The gape is probably gonna be filled soon! News and FA are too bullish 📈
0.1760 - 0.1800$: next big level to be tested 🎯
PYTH - PERFECT - 110% gains BOOOOOM 🔥
I closed my EURONEXT:PYTH position with average +110% profit
Congrats guys!
PYTH - bullish reaction awaited above 0.1450$ Will EURONEXT:PYTH pump back from this key level I mentionned?
1st entry was bad, but I think it's a good area for bulls here!
Key demand zone 0.1470 - 0.1450$
#PYTH - potential double bottom & key retest EURONEXT:PYTH - update:
Short term = bearish momentum but;
I'm pretty sure that another bottom is going to be see around the current zone here.
Another leg up toward 0.300$ could happen next 📈
Lower key demand zone 0.1400 - 0.1450$
What's your point of view on this one? 👀
PYTH ROADMAPTo me the view is pretty clear.
* The purpose of my graphic drawings is purely educational.
* What i write here is not an investment advice. Please do your own research before investing in any asset.
* Never take my personal opinions as investment advice, you may lose your money.
