$GSAT Follow Up Breakdown 3/2$GSAT Video breakdown on todays choppy action and what to watch for tomorrow!GLong03:36by SimpleStacks7
Qcom Qualcomm Inc have a median target of 175.00, with a high estimate of 200.00 and a low estimate of 122.00. The median estimate represents a +31.18% increase from the last price of 133.40by aledrisimohammed80
QCOM - Short Setup Break 142.43. Stop signal 146.53, stop 152.57. Target 1 126.23. Momentum Target from there. Strong insider selling end of last year. Could consider May $140 Puts Shortby AcornWealthCorp0
Looks Primed To Break Through 52wk high GSAT made recent news with a major partnership with QCOMM. We all know the importance QCOMM is for the modems in Apple's phones and with most likely the launch of the 5G phone this looks primed for huge gains this year. GLongby skinnaj0
QCOM 2/13/2021QCOM still sitting in a HVN within the value area. My initial trade plan is still intact. Breaking out over the anchored VWAP would be an ideal scenario to reduce risk on the position. Longby apaqu0
$QCOM Long setup opportunity.Bouncing off the .5 Fibonacci retracement level. A good way to play this is to set your stop below that level and to set your profit target to the next resistance level. Like if you’re bullish!Longby NikolasTrades116
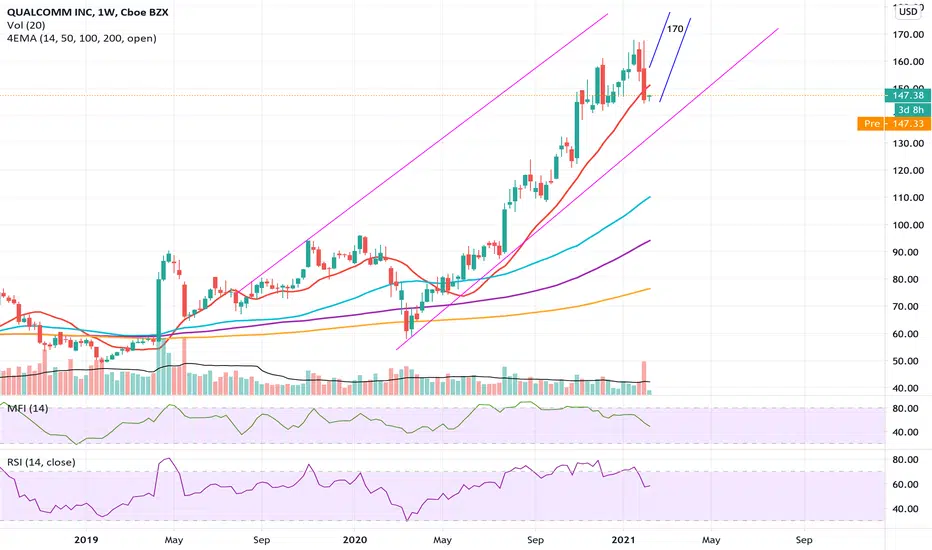
Great Qualcomm play on the retest of the long-term uptrendThe uptrend line from March lows will need to be retested at some point in the medium-term future. Longby Tombis332
QCOM - Brush it off and get up that hill soldier!We are emerging nicely from the selloff. We have a Positive Squeeze happening with bullish candles. After all the selloff was overdone. With a low PE ratio of 24.93 and and a nice EPS we are at a good spot over the next week or so to move higher. Also the volume increase into the close was very nice. This is why I rarely hold stocks into earnings :) GL!Longby sid721
Qcom dipped 10% down after earnings but beatGreat company and they beat this Quarter and the 3 prior Quarters. Nice Revenues, low PE ration, and a nice EPS. They only dipped because of some further looking difficulties.Longby sid727
BREAKOUT ALERT be on the lookout for this to make a movefollow me for more clean charts by Realljuicytradez112
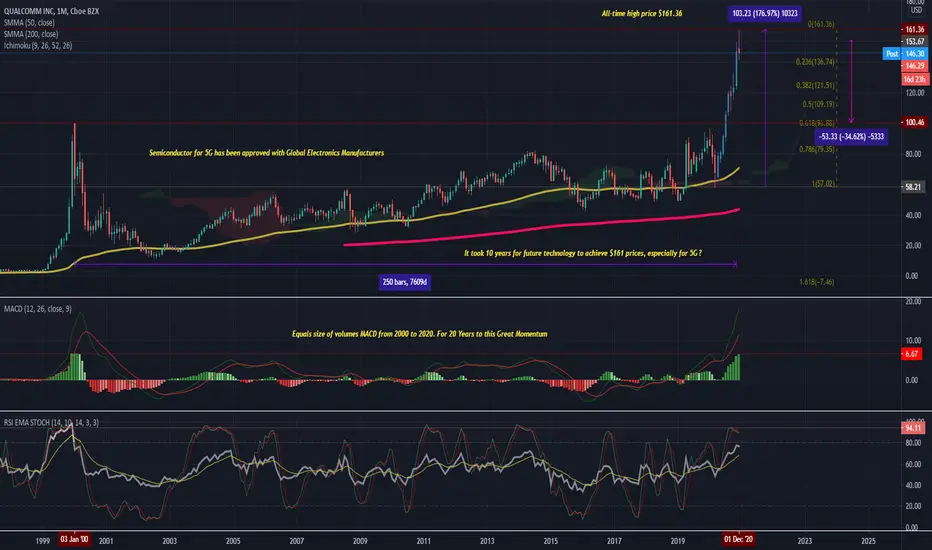
Forecasting Plan Qualcomm Wednesday, 23 December 2020 8:32 AM (WIB) Technology and Artificial Intelligence with 5G will be a more powerful dynamic in every aspect of life with Qualcomm. investor.qualcomm.com Best regards, RyodaBrainless "Live to Ride and Ride to Live" by RyodaBrainless114
QualcommTuesday, 15 December 2020 5:23 AM (WIB) Billions, maybe trillions of times a day… That’s how often people around the world touch something made better by Qualcomm. It could be the smartphone in your pocket, the tablet on your coffee table, that wireless modem in your briefcase… it could even be that navigation system in your car or that action camera strapped to your chest. Who is Qualcomm, and what do we do? We are engineers, scientists, and business strategists. We are from many different countries and speak many different languages. We come from diverse cultures and have unique perspectives. Together, we focus on a single goal—we invent breakthrough technologies that transform how the world connects, computes, and communicates. We often do what many thoughts were impossible. Related Links: www.qualcomm.com www.youtube.com Best regards, RyodaBrainless "Live to Ride and Ride to Live" by RyodaBrainless1
LONG QCOM Good R:R = 4.24Expecting continuation of a trend after pullback. Good risk reward 4.24. This is a pending order, or you can sell $145 PUT options and collect premium regardless of whether it fills or not. Longby asenskiUpdated 331
QCOM 1D RANGE LONG TRADERanges are repeatable trading chart patterns. Ranges are consolidation chart patterns that can breakout either direction. Each chart pattern will have defining trendlines of the support/resistance levels creating the pattern. What ever time frame you are trading this chart pattern, wait for a candle close outside of the trendline in the direction of the breakout candle. (Our time frame preference is the Daily chart). Add volume indicator - Volume is the amount of $ that went into a particular candle or in Forex the # of trades that took place. Add ATR indicator - Volatility is the amount of price movement that occurred. Use the ATR to measure the price movement. When you see descending Volume bars and descending ATR line (which indicates volatility) this shows a dis-interest in traders to invest in this pair creating consolidation which creates the chart pattern. Trade Management after there is a breakout candle close. 1 - Position size (compare volume bar to volume ma line). a - Breakout candle must be 100% of volume average for a full position size. b - If 75% of volume average then ½ position size. (To find 75% of Volume look at the charts volume settings – divide smaller # into larger # = 75%+) If not 75% then stand aside from the trade. 2 – If candle breaks out of a trendline, 15m before the close of the day prepare your buy/sell order. Enter two trades. 1st trade will have a SL & TP. It will close automatically when the 1st TP is hit. 2nd trade only has a SL and will be allowed to run. When 1st TP is hit move the SL to breakeven. Look at ATR and prepare SL at 1.5 of ATR. Prepare 1st trade TP at 1 of ATR. 3 - SL for both trades will be 1.5 x ATR. 4 - 1st trade TP will be 1 x ATR. 5 - No TP on 2nd trade – letting profit run and adjusting SL to follow price. 6 - When 1st TP hit – move 2nd trade SL to breakeven. 7 - Adjust the 2nd trade SL to follow price. *8 – After Breakout candle – if price closes back into chart pattern close trade don't wait for SL to be hit. *9 - When breakout candle is more than 1 ATR from breakout candle open. a - Enter 1st trade at candle close with ½ position size. b - Enter 2nd trade with a pending limit order that is 1 ATR of breakout candle open. c – Price should pullback to that pending limit order for 2nd trade. d – If Price returns back into chart pattern close trade before SL is hit.Longby Tradingstrategyguides1
QCOM w48 2020. Ready to short from 145 to 132Daily I do not see reasons and power to go next. Price should have a rest = corrected Better to go out to see clear trend. Open only from levels of SR Going short Open 145 SL 150 TP 132 RR 3.35 Shortby DmitryZZZ0