QNT Main Trend. Triangle. Distribution. January 2026Time frame: 1 week. After a 147,000% pump, a large symmetrical triangle forms in the distribution zone (this is possible due to the limited supply of only 14.88 million coins, and the concentration of the bulk of the volume among the creators). Reversal zones and percentages to key support/resistance levels are shown.
QNTUSD

QNT Secondary. Pump 147,000% Distribution. Triangle 01 2026Logarithm. Large triangle in the distribution zone. Price is pinched into a corner. Percentages to key support/resistance levels are shown.
Main trend.

QNT/USDT — Compression Phase Hints at an Explosive MoveQNT/USDT on the Weekly (1W) timeframe is currently in a long-term consolidation phase after a sharp decline from its ATH, followed by progressively tightening price action. The current structure indicates a major accumulation phase, where volatility continues to contract and buying and selling pressure remain in balance.
This area represents a critical decision zone for QNT’s next major move.
---
Pattern Explanation
Price is forming a Symmetrical Triangle on the weekly timeframe, characterized by:
Lower Highs (LH) → descending resistance trendline
Higher Lows (HL) → ascending support trendline
Price range narrowing toward the apex
This pattern is neutral by nature, but it often acts as a continuation pattern of the prior trend. A breakout from this structure may trigger a strong impulsive move.
---
Key Levels
Resistance Zones:
102 USDT → minor resistance / early breakout confirmation
131 USDT → mid-level resistance
159 – 194 USDT → major resistance & strong supply zone
Support Zones:
83 USDT → current support / reaction zone
69 USDT → structural support
40 USDT → extreme support / pattern invalidation level
---
Bullish Scenario
The bullish scenario will be confirmed if:
Price breaks and closes weekly above the resistance trendline
Supported by increasing volume
Upside potential:
Initial breakout → 102 USDT
Bullish continuation → 131 USDT
Major target → 159 – 194 USDT
If the breakout is valid, this symmetrical triangle may serve as a base for a long-term trend reversal.
---
Bearish Scenario
The bearish scenario occurs if:
Price breaks down and closes weekly below the support trendline
83 USDT support fails to hold
Downside potential:
Next support → 69 USDT
Further breakdown → 40 USDT
A drop below 40 USDT would invalidate the accumulation structure and open the door for a broader bearish continuation.
---
Conclusion
QNT is currently positioned at a critical level, forming a weekly symmetrical triangle. The market is “building energy” for its next major move.
Traders and investors are advised to wait for clear breakout or breakdown confirmation, as the next direction may define QNT’s trend for the coming months.
#QNT #QNTUSDT #CryptoAnalysis #WeeklyChart #SymmetricalTriangle #MarketStructure #Breakout #SupportResistance #Altcoin

QNT Analysis (1D)From the point where we placed the green arrow on the chart, QNT has started to form a triangle.
Currently, QNT appears to be in wave b of wave D of this triangle.
Wave b of D seems to be a diametric, and only the final wave of this diametric, wave g, remains.
Within the red zone, one can look for sell/short positions.
After the completion of wave b of D, a bearish move is expected to form wave c of D.
targets : 71.43$ _ 64.39$ _ 58.69$
A daily candle close above the invalidation level will invalidate this analysis.
For risk management, please don't forget stop loss and capital management
When we reach the first target, save some profit and then change the stop to entry
Comment if you have any questions
Thank You

#QNT/USDT — Rebound from Historical Zone or Breakdown into Aby#QNT
The price is moving in a descending channel on the 1-hour timeframe. It has reached the lower boundary and is heading towards breaking above it, with a retest of the upper boundary expected.
We have a downtrend on the RSI indicator, which has reached near the lower boundary, and an upward rebound is expected.
There is a key support zone in green at 85.00. The price has bounced from this level multiple times and is expected to bounce again.
We have a trend towards consolidation above the 100-period moving average, as we are moving close to it, which supports the upward movement.
Entry price: 86.33
First target: 88.00
Second target: 90.85
Third target: 94.40
Don't forget a simple principle: money management.
Place your stop-loss below the support zone in green.
For any questions, please leave a comment.
Thank you.

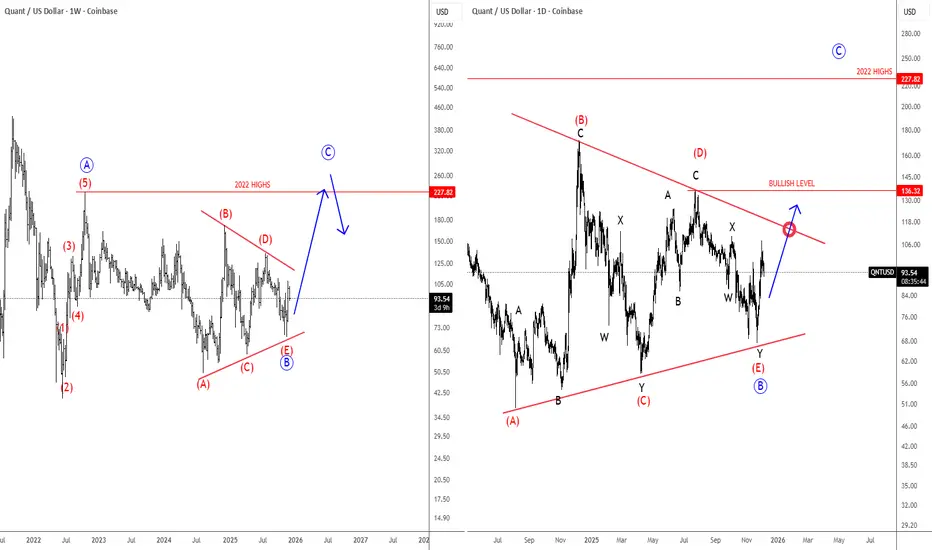
Quant Is Finishing A Bullish Triangle FormationQuant Network is a blockchain interoperability project that lets different blockchains communicate with each other. Its operating system, Overledger, allows developers and businesses to build apps that can run across multiple blockchains at the same time.
The token QNT is used to access and pay for Overledger services.
Quant with ticker QNTUSD is still holding up well above the lower triangle line, so bulls are still here. On the weekly basis, we can now see it finishing a bullish triangle pattern in wave B before we may see another rally for wave C. On a daily chart, it may actually have a completed complex W-X-Y decline within final wave (E) of B, but bullish confirmation for wave C is only above the upper triangle line and 136 level.
QNTUSDT — Rebound from Historical Zone or Breakdown into Abyss?The market has brought QNT/USDT back to one of the most decisive areas in its history — the 78–66 support block, a zone that has served as a major stronghold for long-term holders since 2021.
This isn’t just a technical level — it’s the battlefield where previous fake breakdowns turned into massive reversals and multi-month rallies.
Now, once again, price stands on this critical threshold, but this time the selling pressure feels heavier and more deliberate.
Interestingly, the higher-low structure formed since early 2024 remains intact, aligning perfectly with this same support zone — creating a powerful confluence between horizontal and ascending support.
This makes the current price action a true “make or break” moment for QNT on the weekly timeframe.
The deep wick that pierced below the yellow zone and was quickly pulled back up suggests a liquidity grab — a classic move used by smart money to shake out weak hands before a potential reversal.
But if we see a weekly close below 66, it could mark the beginning of a major structural breakdown toward the 40s.
---
Bullish Scenario:
If QNT manages to defend the 78–66 zone and prints a strong weekly close above 80, a major bullish reversal could be in play.
The first confirmation comes on a breakout above 100.28, which would open the path toward 135 → 159 → 193 as progressive upside targets.
Watch for bullish reversal patterns (hammer, engulfing) with rising volume — those would indicate accumulation and a shift toward expansion phase.
---
Bearish Scenario:
A weekly close below 66 would be a critical warning signal.
Such a breakdown could trigger a continuation move toward 40.6, the next key historical low and liquidity magnet.
Failure of buyers to defend this zone would likely turn the mid-term market structure decisively bearish.
---
Pattern & Technical Structure Summary:
Pattern: Long-term consolidation with an ascending support line since 2024.
Reversal Zone: 78–66 (yellow block).
Confluence: Horizontal + trendline support meet at the same region.
Main Resistances: 100 → 135 → 159 → 193 → 357.
Last Support if broken: 40.6.
Market Behavior: Long wicks show liquidity grabs; market is testing equilibrium before choosing direction.
---
Conclusion:
QNT stands in a golden zone between hope and collapse.
If history repeats, the 78–66 block could once again act as the launchpad for a strong bullish wave over the coming months.
But if this level fails for the first time since 2021, the market could enter an entirely new phase — where only disciplined traders with tight risk management will survive.
The next 1–2 weekly closes will decide QNT’s fate for the quarters ahead.
Watch volume, structure, and the reaction at this key zone carefully.
---
#QNT #Quant #QNTUSDT #CryptoAnalysis #TechnicalAnalysis #SupportZone #BreakoutOrBreakdown #PriceAction #CryptoTrading #SmartMoney #MarketStructure

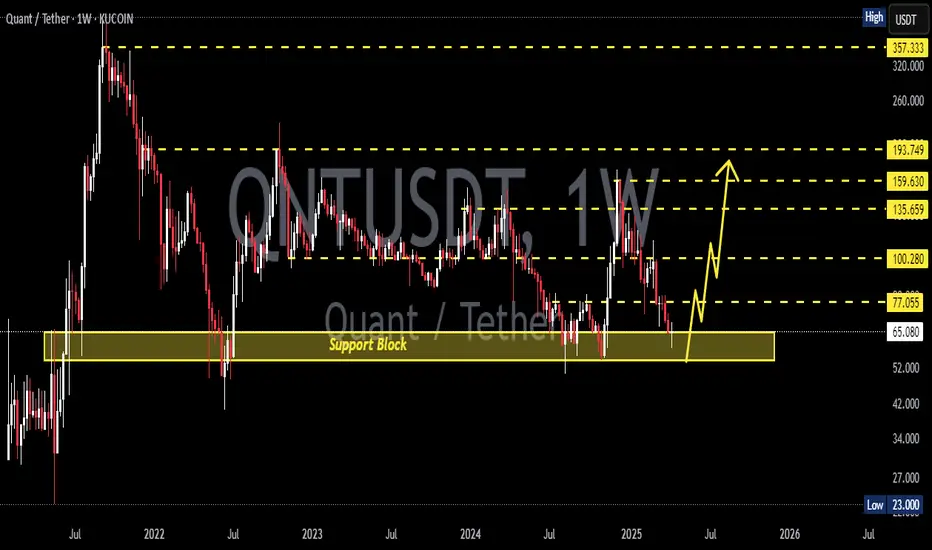
QNT/USDT — Weekly Demand Zone: Major Rebound or Breakdown Ahead?QNT is currently retesting a historical demand zone in the range of $89.76 – $97.77 (Fibonacci 0.5–0.618 confluence). This level has repeatedly acted as a strong pivot point since 2022, and now the market faces yet another decisive moment.
---
🔎 Technical Analysis
Long-Term Trend: Since topping around ~$432, QNT has been in a broader downtrend forming lower highs. However, since 2023 the market has shifted into a sideways accumulation phase above the $80–$100 range.
Key Zone: The highlighted yellow zone ($89.76 – $97.77) is a pivotal demand area. Holding this level could trigger a strong rebound, but a breakdown below would expose much lower targets.
Nearest Resistances: $118.76 → $137.10 → $161.96 → $193.54
Extreme Supports: $70.00 → $40.82
---
✅ Bullish Scenario
Confirmation: A strong weekly close above the demand zone, followed by bullish continuation candles with volume.
Stage 1 Target: $118.76 (≈ +32% upside from $89.76)
Stage 2 Targets: $137.10 → $161.96 → $193.54 if momentum accelerates.
Pattern Outlook: Potential double bottom / re-accumulation structure on the weekly timeframe, waiting for breakout confirmation above key resistance.
---
⚠️ Bearish Scenario
Risk: A weekly close below $89.76 (0.618 Fib) would confirm breakdown of the demand zone.
Downside Targets: $70.00 as the next support, with a potential retest of the historical low at $40.82 if bearish pressure intensifies.
Pattern Outlook: A breakdown here could trigger long liquidation cascades and accelerate the bearish trend.
---
📌 Setup & Risk Management
Aggressive Entry: Scale in within the $89–$98 range, but only with daily/weekly bullish confirmation (pin bar / engulfing close).
Conservative Entry: Wait for a confirmed breakout + weekly close above $118.76 to validate trend reversal.
Stop Loss: Below $84 (under the 0.618 Fib + historical wick support).
Risk-to-Reward Example: Entry $94, stop $84, target $118.76 → R:R ≈ 2.48 : 1.
---
🎯 Conclusion
The $89.76 – $97.77 demand zone is the make-or-break level for QNT in the mid-term outlook:
Hold → potential rebound rally towards $118–$193.
Break → bearish continuation likely, with targets down to $70 or even $40.
QNT is at a critical crossroads: will this demand zone once again spark a rally, or will it finally give way to a deeper breakdown?
---
#QNT #QNTUSDT #Quant #Crypto #TechnicalAnalysis #PriceAction #Fibonacci #SupportResistance #CryptoTrading #SwingTrade

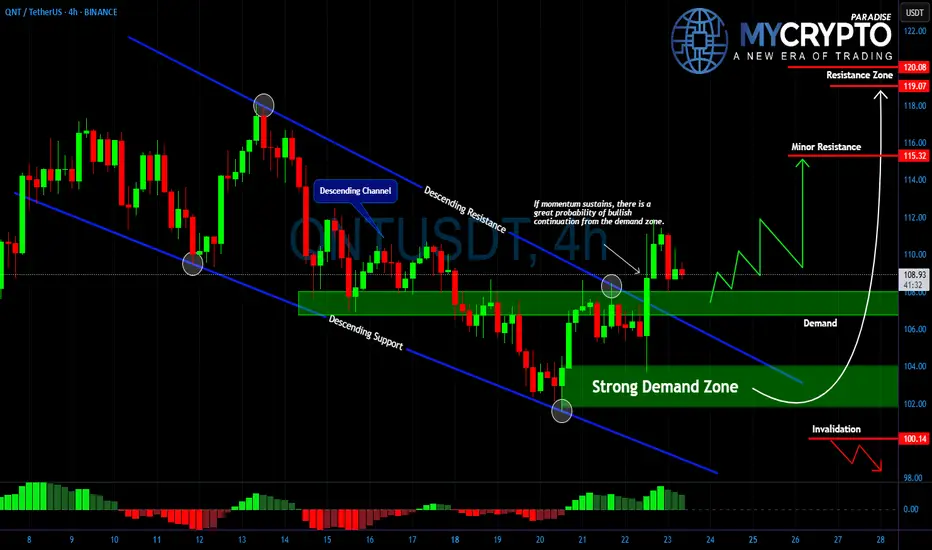
QNT at Demand Zone – Breakout or Breakdown Ahead?Yello traders, #QNTUSDT is now testing a critical demand zone that has repeatedly acted as strong support between 102 and 105. After weeks of moving inside a descending channel, buyers have managed to defend this level, and the market is once again attempting a bullish continuation.
💎Momentum remains fragile, and the immediate test lies ahead at 115, which stands as minor resistance. A clean break and hold above this level could unlock a push toward the stronger resistance zone at 119–120, where sellers are likely to become more aggressive.
💎On the other side, a failure to sustain above the demand zone would quickly shift the structure bearish again. If price breaks below 100, the bullish scenario would be invalidated and deeper downside could follow.
💎This is a decisive moment for #QNT. Patience and discipline are key, as the next move will either confirm a strong breakout or trap late buyers before reversing. Strive for consistency, not quick profits. The market is designed to punish the impatient and reward those who wait for confirmation at key levels.
MyCryptoParadise
iFeel the success🌴
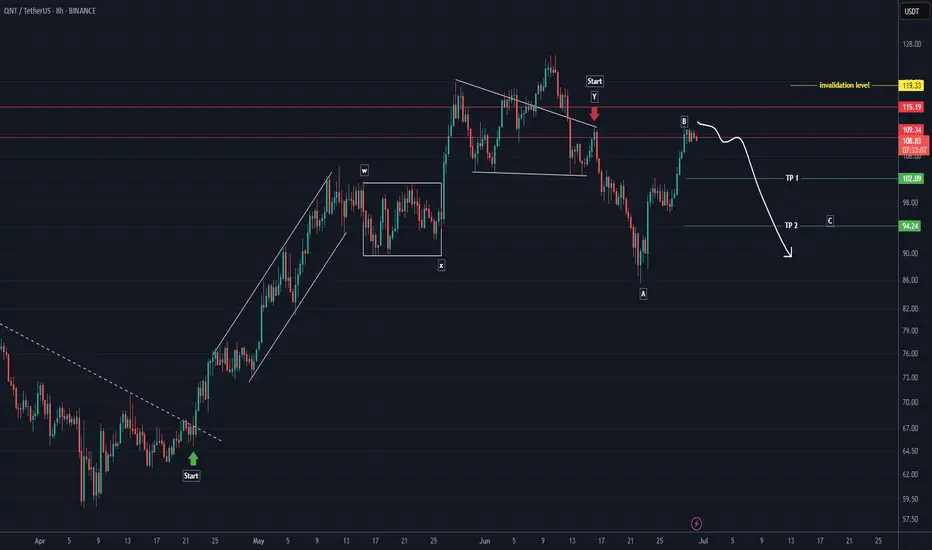
QNT Analysis (8H)From the point where we placed the red arrow on the chart, it seems that NEIRO’s correction has begun.
This correction appears to be a diagonal (diametric) pattern, and we are currently at the end of wave F.
Wave G could complete within the green zone, where we can look for a Rebuy setup.
The targets are marked on the chart.
If a daily candle closes below the invalidation level, this analysis will be invalidated.
For risk management, please don't forget stop loss and capital management
When we reach the first target, save some profit and then change the stop to entry
Comment if you have any questions
Thank You
QNTUSDT | Attractive Zone, But Buyer Strength Still LackingQNTUSDT left behind a clean demand zone on its way up, and that area could offer a decent long opportunity with the right confirmation.
However, if you ask for my broader view, I’m still cautious. Buyers haven’t proven enough strength yet. CDV isn’t convincing, and order flow lacks aggression.
That said, this week started with noticeable buyer presence across the board. If that momentum spills into QNTUSDT, this zone might hold and push price higher.
It’s early for full conviction, but not a bad place for a calculated entry — as long as risk is controlled.
📌I keep my charts clean and simple because I believe clarity leads to better decisions.
📌My approach is built on years of experience and a solid track record. I don’t claim to know it all but I’m confident in my ability to spot high-probability setups.
📌If you would like to learn how to use the heatmap, cumulative volume delta and volume footprint techniques that I use below to determine very accurate demand regions, you can send me a private message. I help anyone who wants it completely free of charge.
🔑I have a long list of my proven technique below:
🎯 ZENUSDT.P: Patience & Profitability | %230 Reaction from the Sniper Entry
🐶 DOGEUSDT.P: Next Move
🎨 RENDERUSDT.P: Opportunity of the Month
💎 ETHUSDT.P: Where to Retrace
🟢 BNBUSDT.P: Potential Surge
📊 BTC Dominance: Reaction Zone
🌊 WAVESUSDT.P: Demand Zone Potential
🟣 UNIUSDT.P: Long-Term Trade
🔵 XRPUSDT.P: Entry Zones
🔗 LINKUSDT.P: Follow The River
📈 BTCUSDT.P: Two Key Demand Zones
🟩 POLUSDT: Bullish Momentum
🌟 PENDLEUSDT.P: Where Opportunity Meets Precision
🔥 BTCUSDT.P: Liquidation of Highly Leveraged Longs
🌊 SOLUSDT.P: SOL's Dip - Your Opportunity
🐸 1000PEPEUSDT.P: Prime Bounce Zone Unlocked
🚀 ETHUSDT.P: Set to Explode - Don't Miss This Game Changer
🤖 IQUSDT: Smart Plan
⚡️ PONDUSDT: A Trade Not Taken Is Better Than a Losing One
💼 STMXUSDT: 2 Buying Areas
🐢 TURBOUSDT: Buy Zones and Buyer Presence
🌍 ICPUSDT.P: Massive Upside Potential | Check the Trade Update For Seeing Results
🟠 IDEXUSDT: Spot Buy Area | %26 Profit if You Trade with MSB
📌 USUALUSDT: Buyers Are Active + %70 Profit in Total
🌟 FORTHUSDT: Sniper Entry +%26 Reaction
🐳 QKCUSDT: Sniper Entry +%57 Reaction
📊 BTC.D: Retest of Key Area Highly Likely
📊 XNOUSDT %80 Reaction with a Simple Blue Box!
📊 BELUSDT Amazing %120 Reaction!
📊 Simple Red Box, Extraordinary Results
📊 TIAUSDT | Still No Buyers—Maintaining a Bearish Outlook
📊 OGNUSDT | One of Today’s Highest Volume Gainers – +32.44%
I stopped adding to the list because it's kinda tiring to add 5-10 charts in every move but you can check my profile and see that it goes on..

#QNT/USDT#QNT
The price is moving in a descending channel on the 1-hour frame and is expected to continue upwards
We have a trend to stabilize above the moving average 100 again
We have a descending trend on the RSI indicator that supports the rise by breaking it upwards
We have a support area at the lower limit of the channel at a price of 86
Entry price 92
First target 98
Second target 103
Third target 110

QNTUSDT 2D AnalysisQNT ~ 2D Analysis
#QNT Buy on retesting this support block or buy after successfully breaking this resistance line with a short term target of at least 10%+.

QNT is about to take off like a rocket soon (1D)The higher structure of QNT is bullish, but its internal structure has turned bearish.
Therefore, we can look for buy/long positions in fresh and unmitigated Demand zones.
Targets are marked on the chart.
A daily candle closing below the invalidation level will invalidate this analysis.
Do not enter the position without capital management and stop setting
Comment if you have any questions
thank you

QNT is breaking out of the descending wedge upper trend line.QNT is now starting to trade outside the upper trendline of the descending wedge and is likely to make an attempt to move toward the equilibrium zone—or close to it.
This will be interesting to watch.
Good luck, and always use a stop-loss!

QNTUSDT 1WQNT ~ 1W Analysis
#QNT Buy gradually from here if you still have a Conviction on this coin with a short -term target of at least 15%+.
QNTUSD - Bullish PhaseGood tokenomics.
Medium caps entering a bullphase.
QNT is at a good level.
Thank you,
St.Gex
Not a trading advice!

QNT could double in price quicker than you think!The QNT charts are looking incredible right now, and all ISO 20022 tokens are now exhibiting the same, or very similar, internal five-wave patterns that I believe are about to move up to the next level.
Although I don't own any QNT and have no plans to, many of my followers do. Either way, the charts are starting to look like a nice slice of cherry pie.
Good luck, and always use a stop loss!

QNT analysis (12H)The price appears to have completed an ABC pattern and is now in wave D or X. The red zone is where sell/short positions can be considered.
Targets are marked on the chart.
A daily candle closing above the invalidation level will invalidate this analysis.
For risk management, please don't forget stop loss and capital management
Comment if you have any questions
Thank You

#QNT Ready For Bullish Rally Despite Bearish Market Sentiment Yello, Paradisers! Is #QNTUSDT About to Break Out, or Will Bears Keep It Trapped? Let's check the latest setup of #Quant and see what might happen next:
💎#QNT has been trapped inside this wedge for months, making lower highs and lower lows. #QNTUSD is showing signs of a potential breakout, but there’s one key resistance level above that could decide everything.
💎Bulls need to break above $115, which has been a major rejection point. A clean breakout here could trigger a rally towards $140-$160, where the next strong resistance zone is waiting. The MACD is showing higher highs while price made lower lows, a classic bullish divergence. This signals that momentum is shifting in favor of buyers.
💎Strong support is around $80-$85, where buyers have stepped in multiple times. Losing this level would lead to a drop to $61-$55, the next major support zone. The Bulls have defended both of these levels before, so they will probably do so this time, too.
💎However, if the bears drag the price below the $55-$61 support level, the bullish setup will be invalidated. In such a case, the bears will drag the price to down levels further.
Stay focused, patient, and disciplined, Paradisers🥂
MyCryptoParadise
iFeel the success🌴

QNTUSDT - Price Projection & StrategyThe current QNT price action presents two key scenarios:
🔴 Bearish Path (Red Line)
QNT could first drop to ~$35 before establishing a strong support level, setting up for a major reversal.
🟢 Bullish Path (Green Line)
If QNT maintains current support levels and breaks resistance, it could enter a strong uptrend.
A steady climb could lead to key Fibonacci retracement levels around $313 - $346.
If momentum continues, price targets could extend toward $665+.
Profit-Taking Strategy
I plan to take profits at green box zones:
✅ First major target: $313 - $346
✅ Ultimate target: $665+

#QNT/USDT#QNT
The price is moving in a descending channel on the 1-hour frame and is adhering to it well and is heading to break it strongly upwards and retest it
We have a bounce from the lower limit of the descending channel, this support is at a price of 92
We have a downtrend on the RSI indicator that is about to break and retest, which supports the rise
We have a trend to stabilize above the moving average 100
Entry price 43
First target 95
Second target 97
Third target 99

QNTUSDT 1WQNT ~ 1W Analysis
#QNT Buy gradually from here if you still have a Conviction on this Coin with a minimum target of 20%+.
