QNTUSDT IS PRIMED FOR BREAKOUT ON H1 !🔥 QNTUSDT primed for breakout on 1H!
📊 Setup:
- Support held at recent lows (orange dots)
- Momentum building (green volume spikes)
- Resistance test → GREEN TARGET ZONE ahead!
🎯 Trade Plan:
Entry: Break above red line (~current high)
TP1: Green box low | TP2: Box high
SL: Below recent low
RR: 1:4+ | Hold AS per your desirable RR or SL
#QNTUSDT #Crypto #Breakout #Altcoins
Qntusdt

QNT Quant Cryptocurrency Buy AreaQNT Quant is not a bad project, but still not a buy for me!
In my opinion, QNT (Quant) crypto appears to address a significant challenge in the blockchain space by focusing on bridging disparate blockchains. The ability to create multi-chain applications or mApps using Quant seems promising, as it enables enhanced usability and communication between different blockchain networks. This is particularly crucial in the cryptocurrency landscape, where interoperability and seamless connectivity among various projects and platforms can greatly benefit the industry as a whole. By facilitating cross-blockchain communication, Quant has the potential to unlock new possibilities for developers and users, fostering innovation and efficiency within the decentralized ecosystem.
I have a large buy area in which I'm willing to average down if it`s the case: $41 - $71.
looking forward to read your opinion about it.

QNT Analysis (1D)From the point where we placed the green arrow on the chart, QNT has started to form a triangle.
Currently, QNT appears to be in wave b of wave D of this triangle.
Wave b of D seems to be a diametric, and only the final wave of this diametric, wave g, remains.
Within the red zone, one can look for sell/short positions.
After the completion of wave b of D, a bearish move is expected to form wave c of D.
targets : 71.43$ _ 64.39$ _ 58.69$
A daily candle close above the invalidation level will invalidate this analysis.
For risk management, please don't forget stop loss and capital management
When we reach the first target, save some profit and then change the stop to entry
Comment if you have any questions
Thank You

QNT Main Trend. Triangle. Distribution. January 2026Time frame: 1 week. After a 147,000% pump, a large symmetrical triangle forms in the distribution zone (this is possible due to the limited supply of only 14.88 million coins, and the concentration of the bulk of the volume among the creators). Reversal zones and percentages to key support/resistance levels are shown.

QNT Secondary. Pump 147,000% Distribution. Triangle 01 2026Logarithm. Large triangle in the distribution zone. Price is pinched into a corner. Percentages to key support/resistance levels are shown.
Main trend.

QNT/USDT — Compression Phase Hints at an Explosive MoveQNT/USDT on the Weekly (1W) timeframe is currently in a long-term consolidation phase after a sharp decline from its ATH, followed by progressively tightening price action. The current structure indicates a major accumulation phase, where volatility continues to contract and buying and selling pressure remain in balance.
This area represents a critical decision zone for QNT’s next major move.
---
Pattern Explanation
Price is forming a Symmetrical Triangle on the weekly timeframe, characterized by:
Lower Highs (LH) → descending resistance trendline
Higher Lows (HL) → ascending support trendline
Price range narrowing toward the apex
This pattern is neutral by nature, but it often acts as a continuation pattern of the prior trend. A breakout from this structure may trigger a strong impulsive move.
---
Key Levels
Resistance Zones:
102 USDT → minor resistance / early breakout confirmation
131 USDT → mid-level resistance
159 – 194 USDT → major resistance & strong supply zone
Support Zones:
83 USDT → current support / reaction zone
69 USDT → structural support
40 USDT → extreme support / pattern invalidation level
---
Bullish Scenario
The bullish scenario will be confirmed if:
Price breaks and closes weekly above the resistance trendline
Supported by increasing volume
Upside potential:
Initial breakout → 102 USDT
Bullish continuation → 131 USDT
Major target → 159 – 194 USDT
If the breakout is valid, this symmetrical triangle may serve as a base for a long-term trend reversal.
---
Bearish Scenario
The bearish scenario occurs if:
Price breaks down and closes weekly below the support trendline
83 USDT support fails to hold
Downside potential:
Next support → 69 USDT
Further breakdown → 40 USDT
A drop below 40 USDT would invalidate the accumulation structure and open the door for a broader bearish continuation.
---
Conclusion
QNT is currently positioned at a critical level, forming a weekly symmetrical triangle. The market is “building energy” for its next major move.
Traders and investors are advised to wait for clear breakout or breakdown confirmation, as the next direction may define QNT’s trend for the coming months.
#QNT #QNTUSDT #CryptoAnalysis #WeeklyChart #SymmetricalTriangle #MarketStructure #Breakout #SupportResistance #Altcoin

qnt looks ready for 150$qnt breaking crucial horizontal area, upon successful breakout it can target descending trendline, and once descending trendline got cleared then it can give rally towards 150 in coming days

QNT = stable before a big move. Quant is sitting at a major point of interest after a long compression. Price is pressing into a well-defined demand zone that’s been defended multiple times.
Downside momentum is fading, with each push lower showing less follow-through. That often signals seller exhaustion, not expansion.
Above price sits a clear volume and resistance stack. A reclaim of the mid-range could open a cleaner path higher, while a loss of this floor is the line in the sand.
This is a decision zone. Patience and confirmation matter here.
What’s your bias on QNT?

QNTUSDT Breakdown Loading? Yello Paradisers! Have you seen what’s forming on #QNT’s chart? A clean Head and Shoulders pattern is developing, and it’s signaling that a major move could be just around the corner.
💎The structure shows clear bullish exhaustion, with the left shoulder, head, and right shoulder all forming under weakening momentum. Price is now pressing directly against the neckline supports the final barrier before a potential trend reversal.
💎Adding fuel to the fire, #QNT has already broken below its ascending trendline, confirming that buyers are losing grip. If we get a confirmed close below the neckline with volume, the bearish setup becomes active, opening the door to more downside.
💎The first area to watch is 81.70, a minor support where short-term buyers may react. But the main downside target sits between 69.65 and 67.52, a strong historical demand zone and high-volume area that could attract heavier bids.
💎As long as QNT stays below 99.70, the bearish outlook holds. A reclaim of that level would invalidate the pattern and give bulls another shot at pushing higher.
Stay sharp, the setup is clean, but it’s also a classic trap zone.
MyCryptoParadise
iFeel the success🌴

#QNT/USDT — Rebound from Historical Zone or Breakdown into Aby#QNT
The price is moving in a descending channel on the 1-hour timeframe. It has reached the lower boundary and is heading towards breaking above it, with a retest of the upper boundary expected.
We have a downtrend on the RSI indicator, which has reached near the lower boundary, and an upward rebound is expected.
There is a key support zone in green at 85.00. The price has bounced from this level multiple times and is expected to bounce again.
We have a trend towards consolidation above the 100-period moving average, as we are moving close to it, which supports the upward movement.
Entry price: 86.33
First target: 88.00
Second target: 90.85
Third target: 94.40
Don't forget a simple principle: money management.
Place your stop-loss below the support zone in green.
For any questions, please leave a comment.
Thank you.

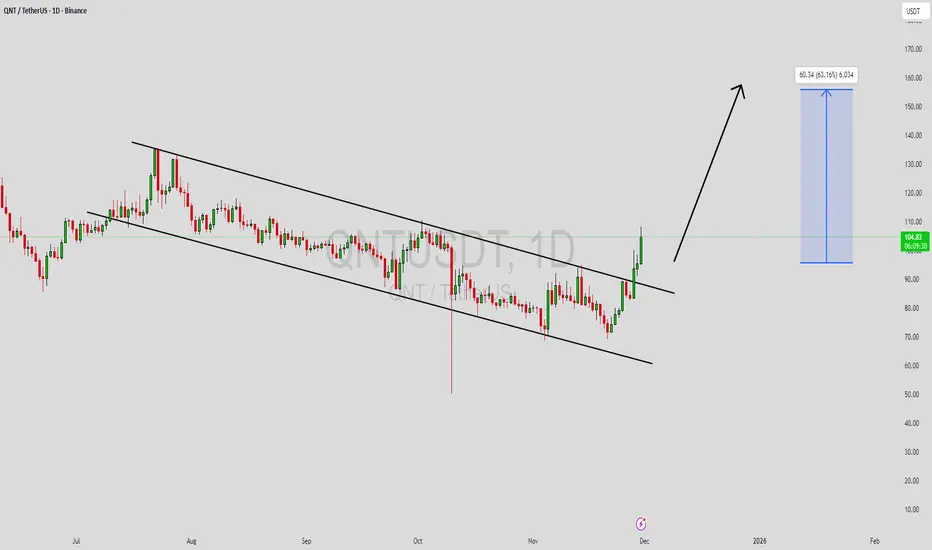
QNTUSDT Forming Falling WedgeQNTUSDT is forming a clear falling wedge pattern, a classic bullish reversal signal that often indicates an upcoming breakout. The price has been consolidating within a narrowing range, suggesting that selling pressure is weakening while buyers are beginning to regain control. With consistent volume confirming accumulation at lower levels, the setup hints at a potential bullish breakout soon. The projected move could lead to an impressive gain of around 50% to 60% once the price breaks above the wedge resistance.
This falling wedge pattern is typically seen at the end of downtrends or corrective phases, and it represents a potential shift in market sentiment from bearish to bullish. Traders closely watching QNTUSDT are noting the strengthening momentum as it nears a breakout zone. The good trading volume adds confidence to this pattern, showing that market participants are positioning early in anticipation of a reversal.
Investors’ growing interest in QNTUSDT reflects rising confidence in the project’s long-term fundamentals and current technical strength. If the breakout confirms with sustained volume, this could mark the start of a fresh bullish leg. Traders might find this a valuable setup for medium-term gains, especially as the wedge pattern completes and buying momentum accelerates.
✅ Show your support by hitting the like button and
✅ Leaving a comment below! (What is your opinion about this Coin?)
Your feedback and engagement keep me inspired to share more insightful market analysis with you!
QNT Update🚨📊 QNT Update
QNT has broken out above the red resistance zone 🔴🔥.
If the bullish momentum continues,
price could move up toward the $109 target —
the next major level on the chart.
Strong breakout, now watching for continuation.

QNTUSDT Forming Falling WedgeQNTUSDT is forming a clear falling wedge pattern, a classic bullish reversal signal that often indicates an upcoming breakout. The price has been consolidating within a narrowing range, suggesting that selling pressure is weakening while buyers are beginning to regain control. With consistent volume confirming accumulation at lower levels, the setup hints at a potential bullish breakout soon. The projected move could lead to an impressive gain of around 60% to 70% once the price breaks above the wedge resistance.
This falling wedge pattern is typically seen at the end of downtrends or corrective phases, and it represents a potential shift in market sentiment from bearish to bullish. Traders closely watching QNTUSDT are noting the strengthening momentum as it nears a breakout zone. The good trading volume adds confidence to this pattern, showing that market participants are positioning early in anticipation of a reversal.
Investors’ growing interest in QNTUSDT reflects rising confidence in the project’s long-term fundamentals and current technical strength. If the breakout confirms with sustained volume, this could mark the start of a fresh bullish leg. Traders might find this a valuable setup for medium-term gains, especially as the wedge pattern completes and buying momentum accelerates.
✅ Show your support by hitting the like button and
✅ Leaving a comment below! (What is your opinion about this Coin?)
Your feedback and engagement keep me inspired to share more insightful market analysis with you!

TradeCityPro | QNT Faces Key Resistance, Eyes Potential Reversal👋 Welcome to TradeCity Pro!
Let’s dive into the analysis of the QNT coin, one of the RWA (Real-World Asset) coins with a $25.1 million market cap, currently ranked 65th on CoinMarketCap.
⏳ 4-Hour Timeframe
On the 4-hour timeframe, this coin is currently in a large range box, and it is now near the upper boundary of this box.
⭐ The upper boundary of this box represents a strong resistance zone, and as you can see, the last time the price was rejected from this zone, a bearish move started.
📊 Currently, the price has moved near this zone, and before reaching it, the price started to correct.
💡 As long as the price remains above 81.18, any downward movement can be considered a correction. If the price touches the zone again and breaks it, we can open a long position.
💥 If the price stabilizes below the 81.18 level, and if selling volume increases, we can open a short position. In that case, the price could move toward the 70.62 support level.
📉 The main confirmation for the bearish trend and the start of a new downward wave for this coin will come after the price stabilizes below 70.62.
📝 Final Thoughts
Stay calm, trade wisely, and let's capture the market's best opportunities!
This analysis reflects our opinions and is not financial advice.
Share your thoughts in the comments, and don’t forget to share this analysis with your friends! ❤️

QNTUSDT UPDATE#QNT
UPDATE
QNT Technical Setup
Pattern: Falling Wedge Pattern
Current Price: $89.59
Target Price: $153.00
Target % Gain: 70.93%
Technical Analysis: QNT is breaking out of a falling wedge pattern on the 1D chart, signaling bullish reversal potential. The breakout above the resistance trendline with growing bullish momentum confirms a shift in structure, supported by increasing volume, targeting higher resistance levels.
Time Frame: 1D
Risk Management Tip: Always use proper risk management.

QNTUSDT — Rebound from Historical Zone or Breakdown into Abyss?The market has brought QNT/USDT back to one of the most decisive areas in its history — the 78–66 support block, a zone that has served as a major stronghold for long-term holders since 2021.
This isn’t just a technical level — it’s the battlefield where previous fake breakdowns turned into massive reversals and multi-month rallies.
Now, once again, price stands on this critical threshold, but this time the selling pressure feels heavier and more deliberate.
Interestingly, the higher-low structure formed since early 2024 remains intact, aligning perfectly with this same support zone — creating a powerful confluence between horizontal and ascending support.
This makes the current price action a true “make or break” moment for QNT on the weekly timeframe.
The deep wick that pierced below the yellow zone and was quickly pulled back up suggests a liquidity grab — a classic move used by smart money to shake out weak hands before a potential reversal.
But if we see a weekly close below 66, it could mark the beginning of a major structural breakdown toward the 40s.
---
Bullish Scenario:
If QNT manages to defend the 78–66 zone and prints a strong weekly close above 80, a major bullish reversal could be in play.
The first confirmation comes on a breakout above 100.28, which would open the path toward 135 → 159 → 193 as progressive upside targets.
Watch for bullish reversal patterns (hammer, engulfing) with rising volume — those would indicate accumulation and a shift toward expansion phase.
---
Bearish Scenario:
A weekly close below 66 would be a critical warning signal.
Such a breakdown could trigger a continuation move toward 40.6, the next key historical low and liquidity magnet.
Failure of buyers to defend this zone would likely turn the mid-term market structure decisively bearish.
---
Pattern & Technical Structure Summary:
Pattern: Long-term consolidation with an ascending support line since 2024.
Reversal Zone: 78–66 (yellow block).
Confluence: Horizontal + trendline support meet at the same region.
Main Resistances: 100 → 135 → 159 → 193 → 357.
Last Support if broken: 40.6.
Market Behavior: Long wicks show liquidity grabs; market is testing equilibrium before choosing direction.
---
Conclusion:
QNT stands in a golden zone between hope and collapse.
If history repeats, the 78–66 block could once again act as the launchpad for a strong bullish wave over the coming months.
But if this level fails for the first time since 2021, the market could enter an entirely new phase — where only disciplined traders with tight risk management will survive.
The next 1–2 weekly closes will decide QNT’s fate for the quarters ahead.
Watch volume, structure, and the reaction at this key zone carefully.
---
#QNT #Quant #QNTUSDT #CryptoAnalysis #TechnicalAnalysis #SupportZone #BreakoutOrBreakdown #PriceAction #CryptoTrading #SmartMoney #MarketStructure

QNT Update📊 QNT Update
QNT is testing the red resistance zone 🔴
If it breaks out, the first target will be the green line level ✅

36%Please be patient while buying on this chart; let it form some strong green candles around the support level.

QNT Market Update📊 QNT Market Update
QNT has formed a bearish Double Top pattern ⚠️ and broke the blue support level 🔵
If the price keeps retracing down to the green zone 🟢, it could bounce again and give a potential long entry from this zone with confirmation ✅

QNT Market Update📊 GETTEX:QNT Market Update
GETTEX:QNT is testing the red resistance zone 🔴
If it breaks out with confirmation, the first target will be the green line level 🎯

Quant Facing the Wall of SellersGETTEX:QNT is still respecting its long-term resistance line. Every time price has tried to break above it, sellers have stepped in, keeping the structure bearish.
Right now, QNT is holding above a key zone that has acted as strong support in the past. If buyers can defend this level and push back toward resistance, we could see another test of the upper line.
In short: support is holding, resistance is heavy, the real move comes only if QNT can finally break through that long-term resistance line.
DYOR, NFA
Stay tuned for more update!

QNT/USDT — Weekly Demand Zone: Major Rebound or Breakdown Ahead?QNT is currently retesting a historical demand zone in the range of $89.76 – $97.77 (Fibonacci 0.5–0.618 confluence). This level has repeatedly acted as a strong pivot point since 2022, and now the market faces yet another decisive moment.
---
🔎 Technical Analysis
Long-Term Trend: Since topping around ~$432, QNT has been in a broader downtrend forming lower highs. However, since 2023 the market has shifted into a sideways accumulation phase above the $80–$100 range.
Key Zone: The highlighted yellow zone ($89.76 – $97.77) is a pivotal demand area. Holding this level could trigger a strong rebound, but a breakdown below would expose much lower targets.
Nearest Resistances: $118.76 → $137.10 → $161.96 → $193.54
Extreme Supports: $70.00 → $40.82
---
✅ Bullish Scenario
Confirmation: A strong weekly close above the demand zone, followed by bullish continuation candles with volume.
Stage 1 Target: $118.76 (≈ +32% upside from $89.76)
Stage 2 Targets: $137.10 → $161.96 → $193.54 if momentum accelerates.
Pattern Outlook: Potential double bottom / re-accumulation structure on the weekly timeframe, waiting for breakout confirmation above key resistance.
---
⚠️ Bearish Scenario
Risk: A weekly close below $89.76 (0.618 Fib) would confirm breakdown of the demand zone.
Downside Targets: $70.00 as the next support, with a potential retest of the historical low at $40.82 if bearish pressure intensifies.
Pattern Outlook: A breakdown here could trigger long liquidation cascades and accelerate the bearish trend.
---
📌 Setup & Risk Management
Aggressive Entry: Scale in within the $89–$98 range, but only with daily/weekly bullish confirmation (pin bar / engulfing close).
Conservative Entry: Wait for a confirmed breakout + weekly close above $118.76 to validate trend reversal.
Stop Loss: Below $84 (under the 0.618 Fib + historical wick support).
Risk-to-Reward Example: Entry $94, stop $84, target $118.76 → R:R ≈ 2.48 : 1.
---
🎯 Conclusion
The $89.76 – $97.77 demand zone is the make-or-break level for QNT in the mid-term outlook:
Hold → potential rebound rally towards $118–$193.
Break → bearish continuation likely, with targets down to $70 or even $40.
QNT is at a critical crossroads: will this demand zone once again spark a rally, or will it finally give way to a deeper breakdown?
---
#QNT #QNTUSDT #Quant #Crypto #TechnicalAnalysis #PriceAction #Fibonacci #SupportResistance #CryptoTrading #SwingTrade

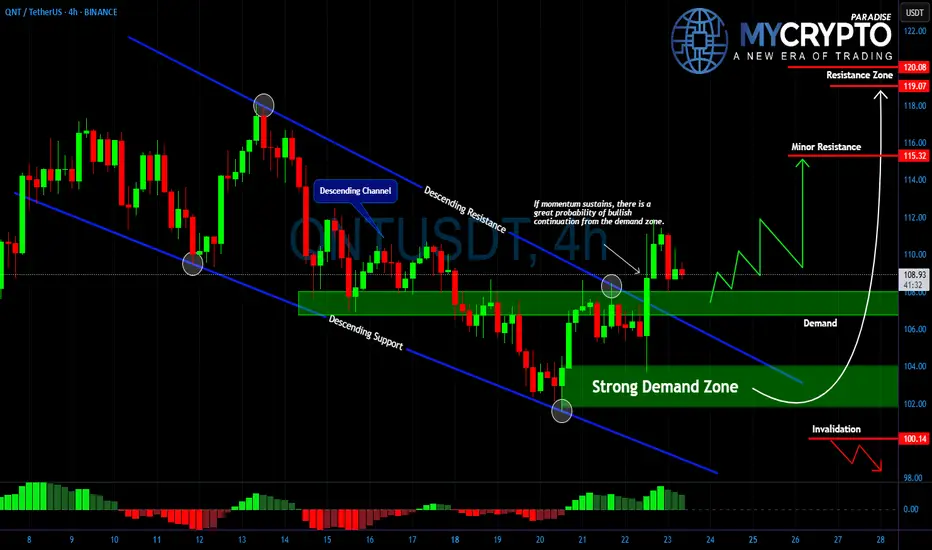
QNT at Demand Zone – Breakout or Breakdown Ahead?Yello traders, #QNTUSDT is now testing a critical demand zone that has repeatedly acted as strong support between 102 and 105. After weeks of moving inside a descending channel, buyers have managed to defend this level, and the market is once again attempting a bullish continuation.
💎Momentum remains fragile, and the immediate test lies ahead at 115, which stands as minor resistance. A clean break and hold above this level could unlock a push toward the stronger resistance zone at 119–120, where sellers are likely to become more aggressive.
💎On the other side, a failure to sustain above the demand zone would quickly shift the structure bearish again. If price breaks below 100, the bullish scenario would be invalidated and deeper downside could follow.
💎This is a decisive moment for #QNT. Patience and discipline are key, as the next move will either confirm a strong breakout or trap late buyers before reversing. Strive for consistency, not quick profits. The market is designed to punish the impatient and reward those who wait for confirmation at key levels.
MyCryptoParadise
iFeel the success🌴