QNTUSDT Breakdown Loading? Yello Paradisers! Have you seen what’s forming on #QNT’s chart? A clean Head and Shoulders pattern is developing, and it’s signaling that a major move could be just around the corner.
💎The structure shows clear bullish exhaustion, with the left shoulder, head, and right shoulder all forming under weakening momentum. Price is now pressing directly against the neckline supports the final barrier before a potential trend reversal.
💎Adding fuel to the fire, #QNT has already broken below its ascending trendline, confirming that buyers are losing grip. If we get a confirmed close below the neckline with volume, the bearish setup becomes active, opening the door to more downside.
💎The first area to watch is 81.70, a minor support where short-term buyers may react. But the main downside target sits between 69.65 and 67.52, a strong historical demand zone and high-volume area that could attract heavier bids.
💎As long as QNT stays below 99.70, the bearish outlook holds. A reclaim of that level would invalidate the pattern and give bulls another shot at pushing higher.
Stay sharp, the setup is clean, but it’s also a classic trap zone.
MyCryptoParadise
iFeel the success🌴
Qntusdtsignals

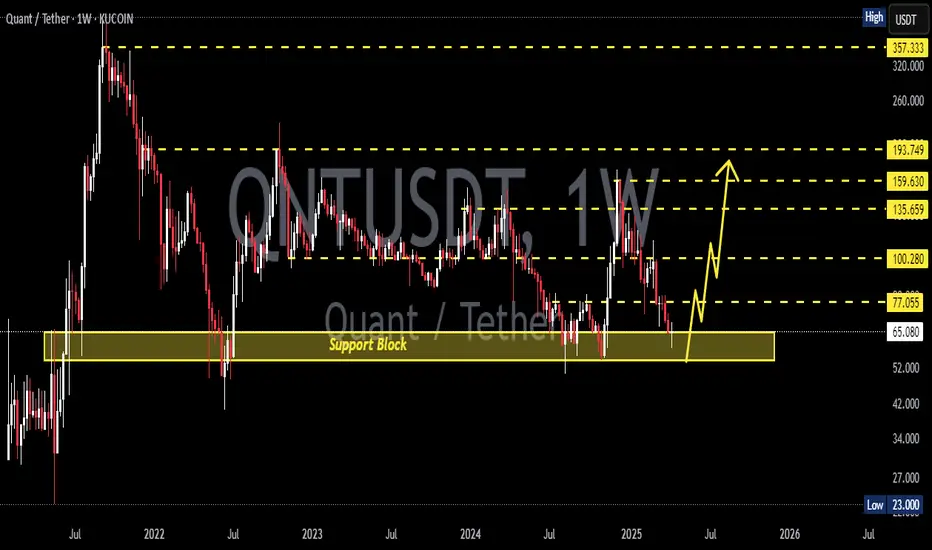
QNTUSDT — Rebound from Historical Zone or Breakdown into Abyss?The market has brought QNT/USDT back to one of the most decisive areas in its history — the 78–66 support block, a zone that has served as a major stronghold for long-term holders since 2021.
This isn’t just a technical level — it’s the battlefield where previous fake breakdowns turned into massive reversals and multi-month rallies.
Now, once again, price stands on this critical threshold, but this time the selling pressure feels heavier and more deliberate.
Interestingly, the higher-low structure formed since early 2024 remains intact, aligning perfectly with this same support zone — creating a powerful confluence between horizontal and ascending support.
This makes the current price action a true “make or break” moment for QNT on the weekly timeframe.
The deep wick that pierced below the yellow zone and was quickly pulled back up suggests a liquidity grab — a classic move used by smart money to shake out weak hands before a potential reversal.
But if we see a weekly close below 66, it could mark the beginning of a major structural breakdown toward the 40s.
---
Bullish Scenario:
If QNT manages to defend the 78–66 zone and prints a strong weekly close above 80, a major bullish reversal could be in play.
The first confirmation comes on a breakout above 100.28, which would open the path toward 135 → 159 → 193 as progressive upside targets.
Watch for bullish reversal patterns (hammer, engulfing) with rising volume — those would indicate accumulation and a shift toward expansion phase.
---
Bearish Scenario:
A weekly close below 66 would be a critical warning signal.
Such a breakdown could trigger a continuation move toward 40.6, the next key historical low and liquidity magnet.
Failure of buyers to defend this zone would likely turn the mid-term market structure decisively bearish.
---
Pattern & Technical Structure Summary:
Pattern: Long-term consolidation with an ascending support line since 2024.
Reversal Zone: 78–66 (yellow block).
Confluence: Horizontal + trendline support meet at the same region.
Main Resistances: 100 → 135 → 159 → 193 → 357.
Last Support if broken: 40.6.
Market Behavior: Long wicks show liquidity grabs; market is testing equilibrium before choosing direction.
---
Conclusion:
QNT stands in a golden zone between hope and collapse.
If history repeats, the 78–66 block could once again act as the launchpad for a strong bullish wave over the coming months.
But if this level fails for the first time since 2021, the market could enter an entirely new phase — where only disciplined traders with tight risk management will survive.
The next 1–2 weekly closes will decide QNT’s fate for the quarters ahead.
Watch volume, structure, and the reaction at this key zone carefully.
---
#QNT #Quant #QNTUSDT #CryptoAnalysis #TechnicalAnalysis #SupportZone #BreakoutOrBreakdown #PriceAction #CryptoTrading #SmartMoney #MarketStructure

Quant Facing the Wall of SellersGETTEX:QNT is still respecting its long-term resistance line. Every time price has tried to break above it, sellers have stepped in, keeping the structure bearish.
Right now, QNT is holding above a key zone that has acted as strong support in the past. If buyers can defend this level and push back toward resistance, we could see another test of the upper line.
In short: support is holding, resistance is heavy, the real move comes only if QNT can finally break through that long-term resistance line.
DYOR, NFA
Stay tuned for more update!

QNT/USDT — Weekly Demand Zone: Major Rebound or Breakdown Ahead?QNT is currently retesting a historical demand zone in the range of $89.76 – $97.77 (Fibonacci 0.5–0.618 confluence). This level has repeatedly acted as a strong pivot point since 2022, and now the market faces yet another decisive moment.
---
🔎 Technical Analysis
Long-Term Trend: Since topping around ~$432, QNT has been in a broader downtrend forming lower highs. However, since 2023 the market has shifted into a sideways accumulation phase above the $80–$100 range.
Key Zone: The highlighted yellow zone ($89.76 – $97.77) is a pivotal demand area. Holding this level could trigger a strong rebound, but a breakdown below would expose much lower targets.
Nearest Resistances: $118.76 → $137.10 → $161.96 → $193.54
Extreme Supports: $70.00 → $40.82
---
✅ Bullish Scenario
Confirmation: A strong weekly close above the demand zone, followed by bullish continuation candles with volume.
Stage 1 Target: $118.76 (≈ +32% upside from $89.76)
Stage 2 Targets: $137.10 → $161.96 → $193.54 if momentum accelerates.
Pattern Outlook: Potential double bottom / re-accumulation structure on the weekly timeframe, waiting for breakout confirmation above key resistance.
---
⚠️ Bearish Scenario
Risk: A weekly close below $89.76 (0.618 Fib) would confirm breakdown of the demand zone.
Downside Targets: $70.00 as the next support, with a potential retest of the historical low at $40.82 if bearish pressure intensifies.
Pattern Outlook: A breakdown here could trigger long liquidation cascades and accelerate the bearish trend.
---
📌 Setup & Risk Management
Aggressive Entry: Scale in within the $89–$98 range, but only with daily/weekly bullish confirmation (pin bar / engulfing close).
Conservative Entry: Wait for a confirmed breakout + weekly close above $118.76 to validate trend reversal.
Stop Loss: Below $84 (under the 0.618 Fib + historical wick support).
Risk-to-Reward Example: Entry $94, stop $84, target $118.76 → R:R ≈ 2.48 : 1.
---
🎯 Conclusion
The $89.76 – $97.77 demand zone is the make-or-break level for QNT in the mid-term outlook:
Hold → potential rebound rally towards $118–$193.
Break → bearish continuation likely, with targets down to $70 or even $40.
QNT is at a critical crossroads: will this demand zone once again spark a rally, or will it finally give way to a deeper breakdown?
---
#QNT #QNTUSDT #Quant #Crypto #TechnicalAnalysis #PriceAction #Fibonacci #SupportResistance #CryptoTrading #SwingTrade

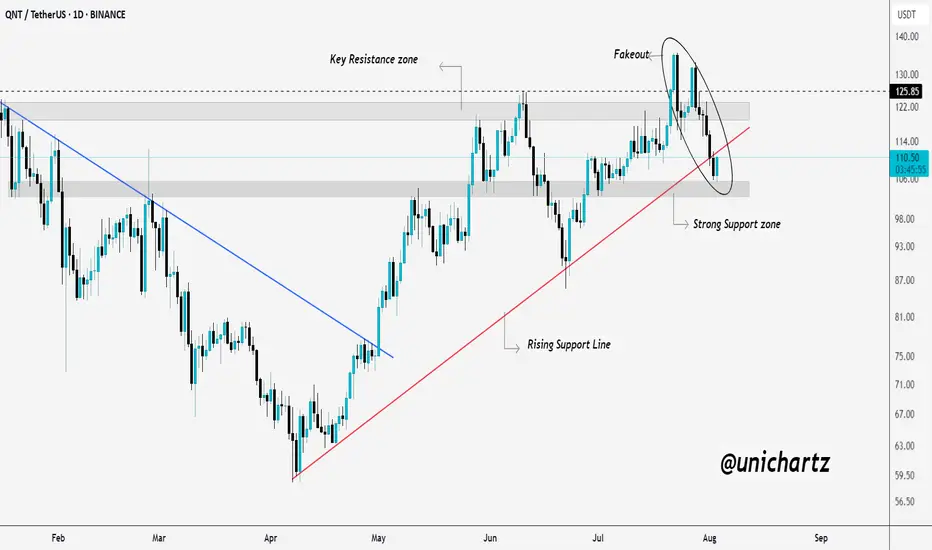
QNT Price Action Heating Up at Critical ZoneGETTEX:QNT attempted to break above its key resistance zone but ended up creating a fakeout, trapping late buyers at the top.
The sharp rejection dragged the price back down toward a strong support zone, which also aligns with the rising trendline.
This area is now a key decision point, if the price holds, a bullish reversal could follow. But if it breaks below, further downside is likely. This level will define QNT’s next major move.
DYOR, NFA
QNTUSDT 2D AnalysisQNT ~ 2D Analysis
#QNT Buy on retesting this support block or buy after successfully breaking this resistance line with a short term target of at least 10%+.

QNTUSDT 1WQNT ~ 1W Analysis
#QNT Buy gradually from here if you still have a Conviction on this coin with a short -term target of at least 15%+.
Quant (QNT): Entering a Bullish ScenarioStrong Upside Potential
Quant (QNT) has officially entered a bullish phase, as the price refused to drop below $84, signaling a strong buying zone and market confidence. Currently trading at $106, QNT is showing momentum to easily break through key resistance levels at $130 and $170 in the coming months.
If the bullish trend continues, QNT could be on track to challenge its all-time high and potentially set a new record by the end of 2025.
Key Levels to Watch
Support Zone: $84 (strong rejection area, confirming bullish sentiment).
Short-Term Resistance: $130 (first breakout level).
Mid-Term Target: $170 (key area before testing new highs).
Long-Term Potential: New all-time high by late 2025, depending on market conditions and demand for QNT’s blockchain solutions.
Conclusion: QNT Positioned for a Major Breakout
With solid support at $84 and a strong push above $106, QNT is poised for a significant rally. The next major moves include breaking $130 and $170, which would set the stage for a new all-time high by the end of 2025.

QNTUSDT 1WQNT ~ 1W Analysis
#QNT Buy gradually from here if you still have a Conviction on this Coin with a minimum target of 20%+.

QNTUSDT 1WQNT Update ~ 1W
#QNT If you still have Conviction on this coin,. This support block would be a very good buying place for now. With a minimum target of 20%+

#QNT/USDT#QNT
The price is moving in a descending channel on the 4-hour frame and it was broken upwards
We have a trend to stabilize above the moving average 100
We have a downtrend on the RSI indicator that supports the rise by breaking it upwards
We have a major support area in green at a price of 58.00
Entry price 63.90
First target 71.60
Second target 76.50
Third target 82.90

QNTUSDT Is a Bullish Breakout or Bearish Fakeout—What’s Next?Yello, Paradisers! Is #QNTUSDT gearing up for a powerful rally, or could we be on the brink of a deeper pullback? Here's what you need to know:
💎#QNT has shown signs of bullish strength by breaking above a key resistance level, which has now been retested as support. If the price continues to respect this support, it could signal a bullish continuation. The next critical step for confirmation is a break above $95.6, followed by a daily candle close above this level. If this happens, we could see QNT pushing toward its major resistance target in the next leg upward.
💎If the support fails to hold, there’s a risk of a fakeout, with QNT potentially dropping toward the $70 demand zone. This level is crucial for sustaining any bullish momentum. A rebound from here would be necessary to reclaim the support at $82, allowing the bullish scenario to remain in play.
💎Should QNT break below the $70 demand zone and close beneath it on the daily chart, it would invalidate the bullish outlook. This could lead to further downward pressure and a deeper correction in the coming sessions.
Remember, Paradisers, the market is a game of probabilities, not certainties. Always trade with clear confirmations, and never let emotions dictate your strategy. Play it smart and stay disciplined!
MyCryptoParadise
iFeel the success🌴

QNTUSDTQNT ~ 1W
#QNT This is the lowest support block for now. if you still have Conviction on this coin,. Buy gradually on this support block,. With a minimum target of 20%++

QNTUSDT 1WQNT ~ 1W
#QNT Getting the lowest price is extremely rare.
now is the right time to buy COINBASE:QNTUSD , This is the lowest price so far.

QNT - pump +30%
_ trend line
- the flag that's been drawn
- (let's pump it)
if you like the idea, please "Like" it. This is the best "Thanks!" for the author 😊 P.S. Always do your own analysis before a trade. Put a stop loss. Fix profits in installments. Withdraw profits in fiat and please yourself and your friends.

QNTUSD 1WQNT ~ 1W 📈
#QNT It is very interesting to make purchases in this Support zone. We will make purchases in stages with a minimum target of 20% of this Support Zone.

QNT/USDT IDEAOn the weekly timeframe, the QNT/USDT trading pair has formed a triangle pattern. This pattern typically indicates a period of consolidation and often precedes a significant price movement. Traders and investors are currently awaiting a breakout from this pattern. If the breakout is successful, it is anticipated that the price of QNT will experience a substantial increase.
Considering the technical analysis, there is a bullish sentiment regarding this breakout. In the event of a successful breakout from the triangle pattern, there is a strong possibility that the price of QNT could soar. It is speculated that a bullish move of 100-200% could potentially occur once the price breaks out of this triangle pattern.
It should be noted that this analysis is purely based on technical indicators and speculation. It is crucial for individuals interested in trading QNT/USDT to conduct their own research (DYOR) and not solely rely on this information for making financial decisions.

QNTUSD 1WQNT ~ 1W 📈
#QNT It's only a matter of time until this resistance line is broken through, make purchases gradually from here, with a target of at least 20%++ 🚀🚀

QNT/USDT The price show a bullish momentum for back to upward!💎 QNT has recently demonstrated notable market dynamics, currently in the process of retesting the demand area.
💎 If this retesting phase proves to be valid, there is a possibility of the price climbing upward with the next target being the resistance area. A successful breakout from this resistance area could probability pave the way for an easy movement towards our target area.
💎 However, if QNT fails to bounce at the demand area, the price may potentially retreat to the Bullish Order Block (OB) area to gather new momentum for an upward movement.
💎 QNT must bounce from the Bullish OB area if it intends to sustain its upward trajectory. Failure to bounce, resulting in a breakdown of this area, could signal a bearish trend continuation, leading to further downward movement.

QNT - Looking Primed for Bullish PA up to 92.9
📈Solid Bullish Play Shaping Up 📈
🟢Weekly ERL Taken
🟢Strong H4 Bullish Reaction to W-ERL
🟢H4 Limit Entry at H4 FVG
🟢Sniper Entry With M15 Bullish Displacement reaction to H4 FVG
🎯Target: BSL at Weekly FVG/IRL : 92.9

QNT USDT Break the Triangle in 1 HR TF. BINANCE:QNTUSDT QNT USDT Break the Triangle in 1 HR TF. Long setup 1:1 R/R Ratio.

QNTUSDTPQuant (QNT) Price Prediction & Forecast for 2023
Quant (QNT) has been one of the most promising digital assets in the cryptocurrency market. The price of QNT has shown a steady uptrend since the beginning of 2021, with many analysts predicting further growth in the near future. The Gartley pattern is a technical analysis tool that traders use to identify potential market trends, and it appears that a bullish Gartley pattern is developing on the weekly timeframe for QNT.
The Gartley pattern is a pattern that traders use to identify potential turning points in the market. The pattern consists of four price swings labeled X, A, B, and C. The pattern is considered bullish when it forms after a downtrend, and the potential reversal zone (PRZ) ( D ) is a price level where the pattern could potentially reverse. The PRZ is identified using Fibonacci retracement levels which are based on the mathematical principles of the Fibonacci sequence.
For Full Article Visit our Website link in Bio

Qnt Breaking Bullish Flag Qntusdt
Breaking Bullish Flag Incase Of Successful Breakout Expecting 20%-30% Bullish Move
