AAPL: The 30% Rule — Why Apple’s Next True Low Likely at 200 USD🍎 AAPL WEEKLY SNAPSHOT — EXECUTIVE SUMMARY
✨ Apple Inc. is entering the late phase of a multi-year corrective cycle
📉 Primary thesis: A ~30% correction is still unfolding, consistent with prior Apple macro drawdowns
🏛️ Macro backdrop: Dow Jones Industrial Average extended near psychological 50,000 → late-cycle risk elevated
⏳ Timing focus: 2025 distribution → 2026 corrective low
🎯 Projected downside target: $200 ±10 macro support + valuation reset
________________________________________
🔍 Why the 30% Correction Matters Historical Fractal Logic
Apple has repeatedly respected ~30% drawdowns during secular bull markets — not crashes, but controlled re-ratings:
• 📌 2021 → 2022:
• High → Low ≈ -30%
• Trigger: tightening cycle + growth multiple compression
• Outcome: strong multi-quarter recovery
• 📌 2024 → 2025:
• High → Low ≈ -30%
• Trigger: AI-led over-extension + index concentration risk
• Outcome: range repair, not trend resumption
• 📍 Current Cycle (2025 → 2026):
• Structure suggests another proportional leg
• Distribution at highs → rolling lower highs → trend exhaustion
• Measured move from 286 ⇒ ~200 aligns with historical symmetry
📐 Market logic: Apple doesn’t usually collapse — it compresses.
________________________________________
🧱 Key Technical Zones Weekly / Monthly
• 🔺 286–280: Macro ceiling / cycle high (distribution complete)
• ⚖️ 245–235: Mid-range congestion (temporary reactions possible)
• 🟨 215–200: High-probability terminal support zone
• 🚨 Invalidation (bear thesis): Sustained acceptance above 286
________________________________________
🧠 Macro Confluence Why 2026 Matters
• 📊 DJIA near historic extension → mean reversion risk rising
• 💰 Passive flows crowded into mega-caps (AAPL = core holding)
• 🧮 Valuation sensitivity at cycle peaks historically resolves via price, not time
• 🕰️ Apple corrections often lag index tops, bottoming after broader sentiment breaks
________________________________________
🎯 Strategic Trade Framework
• ❌ Avoid chasing long exposure at highs
• 🧘♂️ Expect volatility + range expansion before clarity
• 🛒 Best long-term accumulation: only near 200 zone, not earlier
• 🧭 Tactical traders may short rallies below 280 with tight risk
• 🏦 Post-2026: High-quality reset likely sets up next secular advance
________________________________________
🗳️ AAPL Weekly Scenarios — Levels Quiz
Which path do you see next?
🅰️ Hold above 245 → extended range before final breakdown
🅱️ Break 235 → acceleration toward 215–200 macro support
🅲 Flush to ~200 in 2026 → generational accumulation window
🅳 Your level: comment the one price that changes your bias
QQQ

XAU/USD | Bullish Structure Remains Intact (READ THE CAPTION)By analyzing the #Gold chart on the 4-hour timeframe, we can see that price first made a clean pullback to $4274, then strong demand stepped in and pushed gold sharply higher to $4440. After reaching this key psychological resistance, price corrected and is now trading around $4414.
If gold can close and hold above $4404, we can expect further upside. That said, a short-term pullback toward the $4334–$4346 zone is still possible. With ongoing geopolitical risks, gold could even push toward levels above $4550 in the short term. Let’s see how the market reacts next.
Please support me with your likes and comments to motivate me to share more analysis with you and share your opinion about the possible trend of this chart with me !
Best Regards , Arman Shaban

SPY Weekly Outlook – Week 1 of 2026SPY Weekly Outlook – Week 1 of 2026
Technical Look:
Price moved exactly as planned in my December 21 Weekly SPY outlook (you can check the linked idea). The market bottomed on December 17, which was also anticipated in my December 14 Weekly SPY prediction. After that, price pushed into all time highs and got rejected from those levels.
Currently, SPY is retracing from the highs and appears to be seeking additional liquidity and energy before any continuation higher. This consolidation phase may take longer than initially expected.
Scenarios – Prediction:
I am tracking two main scenarios for SPY during January 5–9.
Scenario 1: Bullish Scenario
The 684 level is marked as an options put wall. I will be closely watching for a 4H close above this level.
A confirmed 4H close above 684 would indicate that the bullish scenario is in play, and I would look to engage on the long side.
Potential upside targets for this scenario:
686.75 – 689 – 691.75
Scenario 2: Bearish Scenario
If price fails to break above 684 and starts declining, I would consider that SPY is seeking lower prices.
Downside targets in this scenario:
678.75 – 673 – 669.25
If price breaks 678.75 aggressively , I would then consider lower targets to be in play. Otherwise, the 678.75 level could act as a strong bounce zone for a potential upside reaction.
Position Management Notes:
Each target level may cause significant pullbacks or reversals. Personally, I take partial profits at these levels and keep the remaining position open toward the next targets, while trailing the stop loss to breakeven. This is how I manage my positions.
I share deeper US Market breakdowns and weekly scenario updates on Substack. Link is in my profile.
Disclaimer: This analysis is for educational purposes only and reflects my personal opinion. It is not financial advice.

Be prepared for an impulsive move soon!- NASDAQ:QQQ is coiled for an impulsive break.
- Watch out to ride the momentum

$SOFI Volatility Contraction Pattern Analysis (VCP)Overview of SOFI's Recent Price Action
In late May and early June 2025, SOFI experienced a significant breakout. Following this breakout, the stock price surged approximately 137% to reach its all-time high. By September, SOFI had already gained around 120%, but this rapid ascent was accompanied by increased volatility, resulting in pronounced swings in price. These wide price movements continued until the stock achieved its 137% gain. Upon reaching its peak, volatility intensified further as the process of price discovery accelerated.
Volatility Contraction Phase
Starting in early December, the volatility began to contract, and this contraction has persisted since then. This pattern of decreasing volatility suggests a potential resolution point in the near future.
Trading Approach and Setup
Based on these observations, the hypothesis is that the volatility contraction pattern will resolve to the upside. In preparation for a possible breakout, an alert has been set on the upper downtrend line. If this alert is triggered, it will prompt a search for a favorable risk-reward entry. At present, SOFI remains on the watchlist as a B+ / A setup, indicating a potentially strong opportunity if market conditions confirm the hypothesis.
Important Considerations for Investors
It is strongly recommended that readers conduct their own analysis and follow their individual trading strategies. All investments carry inherent risks, and making thoughtful, informed decisions is essential when allocating capital in financial markets.

MNQ LONGS head and shoulders was pretty obvious today bear flag and trap after trap. We havent quite swept NYSE PM low;s. For a short term scalp im targetting my neckline with a SL of 822.5. forming a possible tripple bottom bear just be cautious you still are in a bear flag but that doesnt mean you can scalp longs for free money within a bearish pattern

QQQ Weekly Outlook – Week 1 of 2026QQQ Weekly Outlook – Week 1 of 2026
Technical Look:
Price moved exactly as planned in my December 21 Weekly QQQ outlook (you can check the linked idea). The market bottomed on December 17, as anticipated in my December 14 Weekly QQQ prediction, and then started to move higher. Price reached both of my targets and began retracing from those levels. (Please refer to the linked post for details)
Currently, QQQ is retracing from the highs and appears to be seeking additional liquidity and energy before any continuation higher. This consolidation phase may take longer than initially expected.
Scenarios – Prediction:
Scenario 1: Bullish Scenario
I am looking for price to break and close above the 614.5 level on the 4H timeframe.
A confirmed 4H close above 614.5 would indicate that the bullish scenario is in play, and I would consider engaging on the long side.
Potential upside targets for this scenario:
621.75 – 629.5
Scenario 2: Bearish Scenario
If price fails to break above 614.5, I would consider that QQQ is shifting into a bearish flow and seeking lower prices. In that case, I would look to engage on the short side.
Downside targets for this scenario:
610 – 606.25 – 600 – 588.5
The 588.5 level represents the most extended bearish scenario. If price breaks 600 aggressively , I would then expect a move toward 588.5.
Position Management Notes:
Each target level may trigger significant pullbacks or reversals. Personally, I take partial profits at these levels and keep the remaining position open toward the next targets, while trailing the stop loss to breakeven. This is how I manage my positions.
I share deeper US Market breakdowns and weekly scenario updates on Substack. Link is in my profile.
This analysis is for educational purposes only and reflects my personal opinion. It is not financial advice.

$QQQ Wedging Pattern AnalysisVolatility Contraction Pattern (VCP) Overview
The QQQ ETF is currently positioned in a noteworthy technical setup known as the Volatility Contraction Pattern (VCP), which has gained recognition through the work of Mark Minervini. The VCP is one of Minervini’s favored patterns for trading, characterized by a series of price contractions and tightening ranges that often precede a significant move.
Support and Resistance Levels
An important aspect of the current chart is the clearly defined area of support and resistance. These levels are visually represented on the chart, with the price having moved both above and below. Presently, the price action is “coiling” and “tightening,” which further supports the formation of the VCP.
Potential Breakout Direction
Although the VCP can result in a breakout in either direction, it typically resolves in alignment with the prevailing trend. In this case, the dominant trend has been upward, suggesting a higher probability of an upward breakout.
Trade Management and Risk Considerations
An alert has been placed on the upper downtrend line to monitor for a potential breakout. If the alert is triggered, it will be an opportunity to evaluate a favorable risk-reward entry point.
Risk Disclaimer
Readers are strongly encouraged to perform their own analysis and adhere to their personal trading strategies. All investments entail inherent risks, so it is vital to make careful and informed decisions when allocating capital in financial markets.

Stock Market Forecast | BTC TSLA NVDA AAPL AMZN META MSFTQQQ stock market Forecast
Nvidia Stock NVDA Forecast
Apple Stock AAPL Forecast
Microsoft Stock MSFT Forecast
Google Stock GOOGL Forecast
Amazon Stock AMZN Forecast
Meta Forecast Technical Analysis
Tesla Stock TSLA Forecast
Magnificent 7 stocks forecast
Bitcoin CRYPTOCAP:BTC forecast
SP:SPX NASDAQ:NDX CME_MINI:NQ1! CME_MINI:ES1!

MU Trade ideaI am waiting for next target 309 to take short position targeting 257, this crazy stock will keep moving upward for sure and correction happens with high %, lets see this week if reached 309 only 5% far.

QQQ mid-term TANasdaq is having negative divergence in volumes, there'e a trampoline move in the process with a potential squeeze downside, be careful and watch for the correction in upcoming days.

YTD 2025 Market Performance Overview by ProjectSyndicate
🟡 1. YTD 2025 Market Performance Summary
Below is a snapshot of major asset class returns through 2025 YTD:
📊 Performance Infographic – YTD Returns (2025)
• Precious Metals
◦ 🥈 Silver: +150%
◦ 🥇 Platinum: +147%
◦ 🪙 Palladium: +92%
◦ 🟡 Gold: +64%
• Equity Markets
◦ 📈 Nikkei: +27%
◦ 📈 DAX: +22%
◦ 📈 QQQ: +22%
• Cryptocurrencies (Risk Assets)
◦ 🪙 Bitcoin (BTC): –4%
◦ 🪙 Ethereum (ETH): –10%
Insight: Classic safe havens precious metals vastly outperformed equities and digital assets through 2025, reflecting both macro uncertainty and the ongoing demand for real assets.
🌟 2. Key Investment Themes for 2025
🔶 A. Precious Metals Rally
Performance Drivers:
• Elevated inflation expectations and rate cut prospects pushed investors into hard assets.
• Silver’s industrial demand (EVs, solar, electrification) amplified its gain vs. gold.
• Platinum & palladium benefited from supply constraints and vehicle emissions tech demand.
• Safe-haven demand lifted gold to multi-decade highs.
🤖 B. AI Technology Sector
While we don’t have precise index returns in this report for AI technology stocks, broad AI adoption drove significant equity performance — especially among semiconductor and AI platform leaders:
• NVDA Nvidia — continued leadership in AI compute.
• AMD — robust gains from data-center and AI client demand.
🧬 C. Biotechnology & Innovation
Biotech remains a structural growth sector due to:
• Aging demographics and healthcare demand.
• New drug modalities and AI-assisted discovery.
• Continued regulatory approvals of new therapeutic classes.
Although biotech performance varies by sub-sector, its role in diversified growth portfolios remains strong.
⚠️ D. Crypto Markets — Flat to Red
• BTC and ETH posted slight declines YTD, contrasting sharply with metals and equities.
• Cryptocurrencies did not act as “digital gold” in 2025 — failing to preserve value relative to hard assets.
Implication: Risk on/off dynamics favored traditional safe havens over digital assets this year.
📅 3. 2026 Gold Price Forecasts — Institutional Consensus
Gold closed 2025 at record highs, and analysts project continued strength in 2026, with a wide range of forecast scenarios:
📈 Gold Price Forecasts for 2026
Forecast Source 2026 Target Notes
J.P. Morgan Global Research ~$5,055/oz (Q4) Strong demand & diversification drivers.
JP Morgan Private Bank / Argonaut ~$5,200–$5,300/oz Elevated institutional demand scenarios.
Goldman Sachs ~$4,900/oz Supported by central bank demand and rate cuts.
Bank of America ~$5,000/oz Broad institutional view.
UBS ~$4,500 (mid-year) Moderately bullish.
World Gold Council (Bear Scenario) ~$3,360–$3,990/oz Bearish if reflation reduces safe-haven demand.
Macro Consensus / Technical Models ~$4,000–$5,300/oz Consensus range based on surveys and models.
Longer-Term & High Estimates $6,000+ More speculative long forecast.
🧠 4. Strategy & Portfolio Implications
📌 Safe Haven Allocation
Given the robust 2025 performance and continued demand drivers, consider maintaining allocations to:
• Physical gold & ETFs
• Silver & industrial metals exposure
• Mining equities and royalty companies
📌 Growth & Innovation Exposure
Balance metals and defensive positioning with growth via:
• AI & semiconductors
• Biotechnology themes
• Select equities in cyclical markets
📌 Crypto Positioning
Given flat/red performance in 2025:
• Reassess crypto allocations relative to risk tolerance.
• Focus on long-term structural adoption catalysts if retaining exposure.
🏁 5. Conclusion
2025 reinforced the case for diversification across asset classes.
• Precious metals delivered standout returns — driven by safe haven demand, supply constraints, and monetary dynamics.
• AI technology and biotech remain secular growth themes, offering upside in equity portfolios.
• Crypto assets lagged traditional hedges, highlighting continued market segmentation in risk assets.
• 2026 gold price forecasts are broadly bullish, though with a wide range of scenarios — from conservative to highly aggressive institutional estimates.

Stock Market Forecast | BTC TSLA NVDA AAPL AMZN META MSFTQQQ stock market Forecast CME_MINI:ES1! SP:SPX NASDAQ:NDX
Nvidia Stock NVDA Forecast
Apple Stock AAPL Forecast
Microsoft Stock MSFT Forecast
Google Stock GOOGL Forecast
Amazon Stock AMZN Forecast
Meta Forecast Technical Analysis
Tesla Stock TSLA Forecast
Magnificent 7 stocks forecast
Bitcoin CRYPTOCAP:BTC forecast

QQQ (NQ-US100) Weekly Prediction – Outlook (21 DEC)QQQ (NQ-US100) Weekly Prediction – Outlook (21 DEC)
📊 Market Sentiment
Market sentiment turned fully bullish after the CPI data came in significantly lower than expected on Thursday. While the consensus expectation was 3.1%, the actual CPI print came at 2.7%, representing a meaningful downside surprise.
This data does not directly determine the outcome of the January FED meeting, as another CPI report will be released on January 13, 2026, which will be far more critical for the FED’s decision making process. However, the current soft inflation trend increased the probability of another lower CPI reading in January, which positively impacted risk sentiment across markets.
📈 Technical Analysis
Last week’s QQQ analysis played out perfectly. I hope you were able to capitalize on it. Price reversed precisely from the levels we anticipated following the CPI release. I am linking last week’s QQQ weekly analysis below for reference.
After the CPI data, price transitioned back into a clean bullish structure on both the daily and weekly timeframes. On Friday, QQQ rallied impulsively and closed the week with strong bullish momentum.
Overall, I think the market structure supports bullish continuation.
📌 Game Plan
I think QQQ may directly test 618.5 (Target 1) early in the week, followed by a move toward 625.75. These are the two bullish targets I expect to be reached within this week.
Price may also move toward these targets without any meaningful retracement. I plan to close one third of my call options at 618.5 and the remaining portion at 625.75 from the positions I am holding since Thursday.
If price pulls back to 611.75 or 607 before reaching 625.75 and prints strong 1H or 4H bullish candle closes, I will look to add new call option positions targeting 625.75.
In the event of a developing bearish structure, I will provide updates. However, at this stage, I do not see any clear bearish signals.
💬 For deeper sentiment and strategy insights, subscribe to my Substack free access available.
This analysis is for educational purposes only and does not constitute financial advice. Always conduct your own research before trading or investing.

Bulllflag QQQ Tight stopPretty clear in the picture consolidating around price you could argue its a triple top but people often forget even within a triple top you can rip past price just to come back down. Doubt we see an explosive move today but something to be mindful of

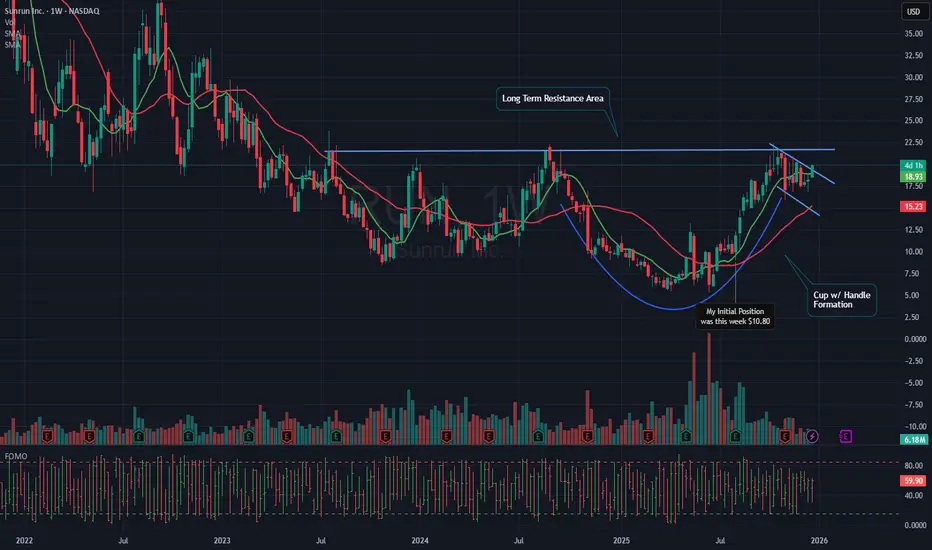
$RUN Cup w/ Handle Breakout AnalysisOverview
SUNRUN has experienced a notable upward movement today, gaining 8.89% as of this writing. This increase has propelled the stock above what appears to be a Cup with Handle formation, a technical pattern often associated with a bullish breakout. Given this development, the current price area could be a favorable point for initiating a new position. Typically, a breakout is confirmed when the price moves above a long-term resistance level.
Position Details
I established a full-size position in SUNRUN in early August at a price of $10.80 per share. Later, in November, I added a smaller amount at $17.95 per share, which increased my average cost to $11.68 per share. Currently, I am up 69% on this position. I did not add more shares today, as I missed the initial surge and prefer not to pursue the price higher. My plan is to wait for the stock to consolidate, even if that occurs at a higher price, since there is no clear area to set a reasonable stop loss for additional shares at this time.
Outlook and Watchlist Recommendation
I am sharing this update because I believe SUNRUN has the potential for further significant gains and should be considered for your watchlist. I will continue to update this analysis when a favorable risk-reward entry point becomes apparent.
Important Disclaimer
Readers are strongly encouraged to perform their own analysis and adhere to personal trading strategies. Keep in mind that all investments carry inherent risk. Making thoughtful and informed decisions is crucial when allocating capital in financial markets.
SPY (ES-US500-SPX) Weekly Prediction – Outlook (21 DEC)SPY (ES-US500-SPX) Weekly Prediction – Outlook (21 DEC)
📊 Market Sentiment
Market sentiment turned fully bullish after the CPI data came in significantly lower than expected on Thursday. While the expectation was 3.1%, the actual CPI print came at 2.7%, which was a meaningful downside surprise.
This data does not directly determine the outcome of the January FED meeting, as another CPI report will be released on January 13, 2026, which will be far more critical for the FED’s decision making process. However, the current soft inflation trend increased the probability of another lower CPI reading in January, which positively impacted risk sentiment across markets.
📈 Technical Analysis
In my previous SPY analysis last week, I clearly outlined the expectation of an early week pullback followed by a precise reversal level. That scenario played out exactly as anticipated.
Following the CPI release, price completed its reversal and closed the week with very strong bullish price action on Friday. In my opinion, this behavior suggests that the corrective phase has likely ended and price is now preparing for continuation to the upside.
📌 Game Plan
I think price may target the 683.5 level early in the week.
For call options and long positions, the key lower timeframe reaction zones I will be monitoring are 678.25 and 675.25.
If price rallies directly toward 683.5, I plan to sell the majority of my existing call positions around that level. However, if price first tests 678.25 or 675.25 before reaching 683.5, I am considering adding additional call exposure from those zones.
That said, my decision to enter will strongly depend on 1H and 4H candle closes. I will not enter positions in a market that simply breaks through these levels. If price tests these zones and prints strong bullish 1H or 4H closes, that is when I will begin executing call option entries.
💬 For deeper sentiment and strategy insights, subscribe to my Substack free access available.
This analysis is for educational purposes only and does not constitute financial advice. Always conduct your own research before trading or investing.

Nasdaq ETF QQQ: Liquidity Sweep Then Expansion Play📊 ASSET DETAILS
Instrument: QQQ — Invesco QQQ Trust Series
Market: NASDAQ
Type: ETF
Trading Style: Swing Trade
Bias: 🟢 Bullish
🧠 MARKET STRUCTURE & TECHNICAL CONTEXT
QQQ is currently respecting a bullish market structure, supported by a triangular moving average pullback and clean retest.
This behavior typically signals trend continuation, not reversal, provided key liquidity zones remain defended.
📌 Key confirmations:
Higher-timeframe trend intact
Price reacting positively to dynamic support
Healthy pullback (not impulsive selling)
Liquidity resting below current price action
🧩 TRADE PLAN — THIEF STYLE (EDUCATIONAL / ENTERTAINMENT)
🟢 Bias
Bullish continuation scenario
🎯 ENTRY STRATEGY (THIEF LAYER METHOD)
This plan uses a layered limit order approach, commonly known as a scaling-in / cost-averaging style entry.
You may also choose any price level entry based on your own confirmation.
Example Layered Buy Limits:
605.00
610.00
615.00
620.00
➡️ You may increase or adjust layers based on your own risk profile and execution model.
⚠️ This method is designed to avoid emotional chasing and allows flexibility during volatility.
🛑 STOP LOSS (REFERENCE LEVEL)
Stop Level: 600.00
📌 Note for Thief OGs:
This stop level is not a recommendation.
Risk management is your personal responsibility.
Use your own stop logic if it better fits your strategy.
🎯 TARGET / EXIT ZONE
Primary Target: 650.00
📍 Rationale:
Strong resistance / supply zone
Potential overbought conditions
Possible liquidity trap above highs
🧠 When price reaches this zone, capital preservation > greed.
Escaping with profits is always a professional move.
📌 Reminder:
This target is not mandatory — partials, trailing exits, or custom targets are valid alternatives.
🔗 RELATED PAIRS & CORRELATED MARKETS TO WATCH
📈 AMEX:SPY (S&P 500 ETF)
Confirms broader market risk-on sentiment
Strength in SPY often supports continuation in QQQ
💻 NASDAQ:AAPL / NASDAQ:MSFT / NASDAQ:NVDA
Heavy-weight components of QQQ
Institutional accumulation in these names often leads QQQ direction
💵 TVC:DXY (US Dollar Index)
Weak or sideways DXY typically supports tech strength
Strong DXY may slow upside momentum
📉 TVC:VIX
Rising VIX = caution
Suppressed VIX supports bullish continuation
⚠️ IMPORTANT NOTES (READ BEFORE COMMENTING)
This setup is educational & entertainment-based
No guarantee of outcome
Markets can invalidate any setup at any time
Always manage risk and position size responsibly
✨ “If you find value in my analysis, a 👍 and 🚀 boost is much appreciated — it helps me share more setups with the community!”
⚠️ DISCLAIMER
This is a thief-style trading strategy just for fun.
Nothing here should be considered financial advice.

QQQ Trading Opportunity! SELL!
My dear followers,
This is my opinion on the QQQ next move:
The asset is approaching an important pivot point 617.26
Bias - Bearish
Safe Stop Loss - 620.93
Technical Indicators: Supper Trend generates a clear short signal while Pivot Point HL is currently determining the overall Bearish trend of the market.
Goal - 611.35
About Used Indicators:
For more efficient signals, super-trend is used in combination with other indicators like Pivot Points.
Disclosure: I am part of Trade Nation's Influencer program and receive a monthly fee for using their TradingView charts in my analysis.
———————————
WISH YOU ALL LUCK

Stock Market Forecast | BTC TSLA NVDA AAPL AMZN META MSFTQQQ stock market Forecast
Nvidia Stock NVDA Forecast
Apple Stock AAPL Forecast
Microsoft Stock MSFT Forecast
Google Stock GOOGL Forecast
Amazon Stock AMZN Forecast
Meta Forecast Technical Analysis
Tesla Stock TSLA Forecast
Magnificent 7 stocks forecast
Bitcoin CRYPTOCAP:BTC forecast
SP:SPX NASDAQ:NDX CME_MINI:ES1!

YEN CARRY TRADE LAST WAVE UP 5 of C of B CRASH SOON AFTERThe chart of the yen carry trade The reason for the coming CRASH in world markets for 2026 . Best of trades WAVETIMER !

Santa Rally / V-Shaped Recovery WatchNASDAQ:QQQ continues to respect the 50 & 100 DMA, just like every selloff since July. Momentum indicators are exiting oversold territory, suggesting a familiar upside rotation.
AMEX:SPY confirms.
AMEX:IWM remains structurally bullish on the monthly (cup & handle).
CRYPTOCAP:BTC shows classic oversold mean reversion behavior.
Key risk: loss of 100 DMA.
Bias: upside continuation while support holds.

$QCOM Delayed News RallyOverview of the Qualcomm News Rally
On October 27th, Qualcomm Technologies, Inc. announced the launch of its next-generation AI inference-optimized solutions for data centers. These new products, the Qualcomm® AI200 and AI250 chip-based accelerator cards and racks, are built on the company’s NPU technology leadership. They deliver rack-scale performance and superior memory capacity, enabling fast AI inference with exceptional performance per dollar per watt. This marks a significant advancement for scalable, efficient, and flexible generative AI across various industries.
Market Reaction and Stock Performance
Following the announcement, trading volume on October 27th surged—possibly reaching the highest levels ever recorded for the stock. Qualcomm’s share price responded positively, gaining approximately 22% and ultimately closing up just over 11% for the day. However, after this initial rally, profit-taking led to a selloff, and the stock reached a closing low on November 20th.
Trading Strategy and Position Management
After observing the market reaction to the news, I chose not to pursue the upward price movement immediately. Instead, I patiently waited for a pullback, which turned out to be deeper than anticipated. Over the following weeks, I identified the downtrend and drew a trend line. When the stock price broke above this downtrend line, I entered a half-size position, setting a stop just below the day’s low. The stock climbed swiftly, then retreated to test the 50-day moving average (red), where it formed what I interpreted as a reversal candle yesterday. This morning, the reversal appeared confirmed, suggesting the potential for a continued uptrend. With this confirmation, I increased my holdings to a full-size position, placing a stop for the added shares just below today’s low.
Disclaimer and Investment Considerations
Readers are strongly encouraged to conduct their own analysis and follow their individual trading strategies. It is important to recognize that all investments involve inherent risk. Thoughtful and informed decision-making is essential when allocating capital in financial markets.
