QQQ – Weekly Structure OverviewThesis
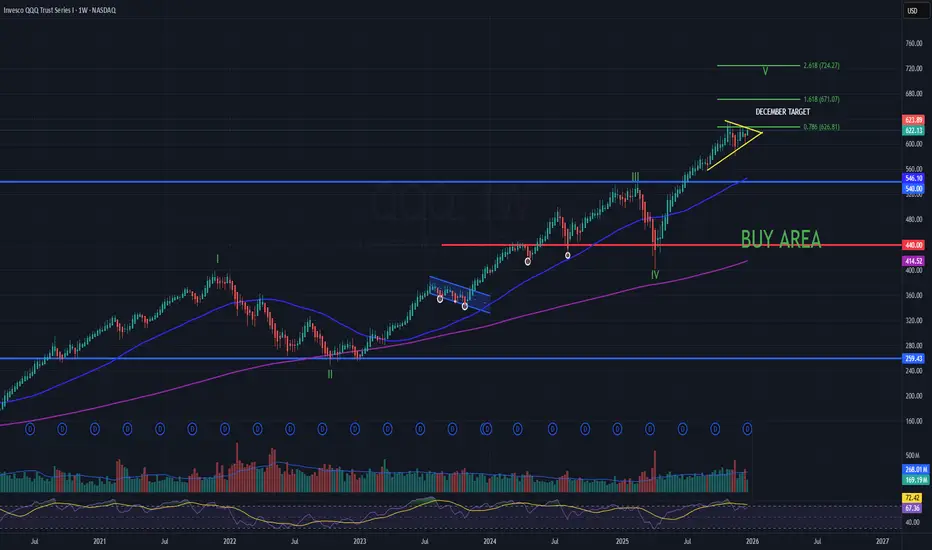
Weekly uptrend intact. Price is extended; next decision is breakout vs. consolidation near highs. We are next to the end of the long term bull trend.
Context
200WMA is rising and aligns with major support near 440 (long-term mean reversion / reset zone).
What I see
- Prior stress phases reverted toward the 200WMA (2022 and early 2025).
- Current structure is a rising consolidation near highs (compression).
What matters now
- Continuation remains favored while price holds above key trend support ($600 on chart).
- A clean weekly expansion above the consolidation keeps upside structure intact.
Buy / Accumulation zone
- Long-term accumulation zone: $440 area (200WMA + horizontal support confluence).
Targets
- Extension reference: 2.618 Fib $720s (measured upside within current structure).
Qqqforecast
WEEKLY QQQ (NQ-US100-USTECH) Outlook - Prediction (14 DEC)WEEKLY QQQ (NQ-US100-USTECH) Outlook - Prediction (14 DEC)
📊 Market Sentiment
Market sentiment has turned slightly bullish again following the FED’s rate cut decision. We saw the market react quickly after Powell’s speech. QE has restarted, and the FED stated it will buy $40 billion of Treasury bills over the next 30 days. This narrative supports the bullish case; however, $40B is relatively small compared to the overall size of the U.S. market.
At the same time, the bearish narrative is strengthening. Powell stated that “rates are now in a plausible range of neutral,” and the FED emphasized that it will assess incoming data until the January meeting. No decision has been made for January yet.
This keeps the market in a state of uncertainty and when the market lacks a clear narrative, it often turns bearish. Keep this in mind.
📈 Technical Analysis
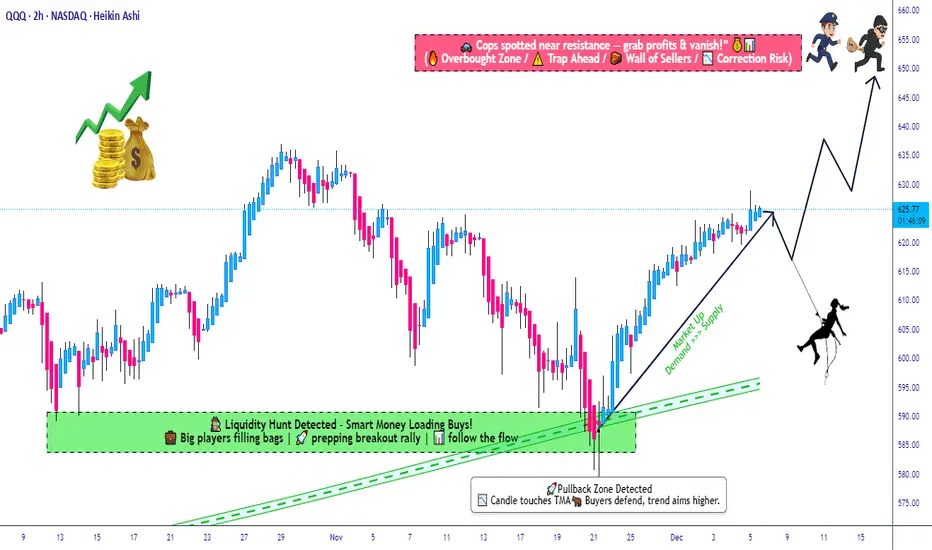
QQQ hit the 629 level, as I pointed out last week. I am linking last week’s QQQ prediction below for reference.
Price ran the 629 level but could not close above it. After that, we saw selling pressure due to SPY and YM hitting all time highs and getting rejected. QQQ was the weaker index last week, which explains why we did not expand as much as SPY and why QQQ failed to reach all time highs.
I believe the expansion higher will resume, but first price needs to gather more energy before continuing upward.
📌 Prediction – Outlook
I am tracking three different scenarios:
Scenario 1 (Black Line) – Bullish:
Price runs the 610.5 level and closes above it. If this occurs, I will be buying calls, targeting 617.5 first, with a runner for higher levels.
Scenario 2 (Orange Line):
Price retraces to 610.5 and closes below, creating a deeper pullback. Price then reaches 605.5 and closes back above it. This would likely initiate bullish momentum.
In this case, I would be buying calls, targeting 610.5 first and 617.5 as the second target.
Scenario 3 (Red Line) – Bearish:
Price retraces to 610.5 and aggressively closes below. Price then continues lower toward 597.5 without showing strength.
If price later closes back above 597.5, I will look to buy calls.
Initial profit targets would be 605.5 and 610.5.
💬 For detailed insights and broader market context, please check my Substack link in profile.
For educational purposes only. This is not financial advice.

MASSIVE RALLY OR MASSIVE CRASH...In this video we will talk about if the markets are in store for a MASSIVE RALLY OR MASSIVE CRASH...
NASDAQ:QQQ AMEX:SPY AMEX:IWM

QQQ Structured Bullish Scenario • Compression Into MA Support📌 Asset: QQQ — Invesco QQQ Trust Series 1 (NASDAQ ETF)
🔎 Style: Swing / Day-Trade Profit Playbook
🎨 Theme: Bullish Pullback Setup using Triangular Moving Average + Layered Entry Strategy
📈 Bullish Pullback Plan — “Thief Layering Strategy” Edition 🕵️♂️💰
QQQ is pulling back into a Triangular Moving Average zone, forming a clean bullish reaction area. Price behavior shows controlled momentum, healthy retracement, and a potential continuation toward the upper supply zone.
To keep it fun — Thief OG Style is included but in TradingView-permitted language and friendly terms.
🎯 Entry Plan (Layered Limit Entries — “Thief Style but TV-Friendly”)
Using a layered entry method (multiple limit orders placed at different levels to reduce average cost and control risk):
Buy Limit Layer 1: 605
Buy Limit Layer 2: 610
Buy Limit Layer 3: 615
Buy Limit Layer 4: 620
(Traders may increase or reduce the number of layers based on their own strategy and risk tolerance.)
🛑 Stop Loss (Risk Control Zone)
📍 Proposed Risk Level: 600
This is shared for educational insight only — every trader must select their own SL depending on risk appetite.
🎯 Target Zone (Resistance + Police Force Zone 🚓😆)
Projected upside target: 650
The resistance zone has strong reaction history + signs of overbought conditions + possible liquidity traps.
So take profit smartly and exit with gains before “police force” catches late buyers.
(Again: this TP is optional — traders should decide their own TP levels.)
📚 Market Context & Correlation Watchlist 🔍🌐
QQQ is heavily correlated with major US tech indices & megacap tech stocks. Watching related pairs helps understand volatility, liquidity shifts, market strength, and trend momentum.
🔗 Related Pairs to Watch (Cross-Checks & Correlation Insight)
💠 NASDAQ:NDX / PEPPERSTONE:NAS100
Direct parent index of QQQ
Moves almost identically
Great for trend confirmation
💠 SP:SPX / AMEX:SPY
Broader market risk sentiment
If SPY + QQQ align in bullish direction → strength confirmed
💠 TVC:VIX
Volatility meter
Lower VIX supports bullish continuation
💠 NASDAQ:AAPL , NASDAQ:MSFT , NASDAQ:NVDA , NASDAQ:AMZN , NASDAQ:GOOGL
These top components control majority of QQQ weighting
Bullish tech megacaps = higher probability QQQ reaches target
💠 TVC:DXY (Dollar Index)
Strong USD = pressure on equities
Weak USD = supportive for QQQ rallies
💠 NASDAQ:TLT / US10Y
Bond yields inverse to growth stocks
Falling yields can provide additional bullish fuel for QQQ
🧠 Key Technical Points 🛠️🔥
Triangular MA acting as dynamic support
Healthy pullback with controlled selling
Layering entries reduces average cost & improves RR
Resistance zone at 650 aligns with prior structure
Megacaps still holding bullish bias
Volatility decreasing → favorable for continuation
✨ “If you find value in my analysis, a 👍 and 🚀 boost is much appreciated — it helps me share more setups with the community!”
⚠️ Disclaimer
This is a thief-style trading strategy just for fun.
#QQQ #NASDAQ #ETF #SwingTrade #DayTrading #TechnicalAnalysis #TriangularMA #LayeringStrategy #LimitOrders #MarketAnalysis #TradingPlaybook #USMarkets #Stocks #TraderLifestyle #Investing #BullishSetup #TrendContinuation #RiskManagement #ChartAnalysis
Why I'm NOT Buying the Dip on QQQ (Yet)Many traders are trying to catch a falling knife on the Nasdaq right now. Here is why my system says "Wait."
Looking at the Quant Master system on the 4H timeframe:
Trend is King: The candles are Red. This means Price is below the Volatility Stop and below the institutional VWAP anchor. There is no "Green Light" to buy yet.
Beware the "Black" Zones: If the candles turn Black, it means volatility has spiked or momentum has died (Chop). I do not trade in Black zones. I am waiting for clear Blue structure.
The Exit Was Clear: If you look at the top of the chart, the system printed multiple Purple Triangles. This signaled that the trend was exhausted relative to its statistical baseline. If you didn't take profit there, the market took it for you.
The Plan:
I am sitting on my hands until price closes ABOVE the VWAP (Orange Line) and the Stop Loss line turns Blue.
Trade what you see, not what you think.

QQQ Bearish Pullback: Retest Toward 590–595 ZoneQQQ on the 1D chart has been trending higher for months, but the latest session printed a clean Bearish Engulfing with a ~1.86% drop and a break below the 20-day (around 614.50). That rejection left fresh supply near the recent high at 635 and flipped 610–615 into near-term resistance. Momentum has shifted short-term to the downside even as the broader structure remains bullish.
Primary path: a corrective leg toward the 590–595 demand zone. That area aligns with prior polarity and the 60-day moving average, with the lower Bollinger Band near 588 adding confluence. A sustained break below 610 would likely unlock that move, where buyers can attempt to stabilize price and rebuild trend structure.
Alternative: if buyers reclaim 622 on a daily close, the bearish signal is invalidated and the door reopens for a retest of 635. Conversely, if 590 fails decisively, the correction can extend toward the 120-day region around 570–575, signaling a deeper, medium-term reset.
This is a study, not financial advice. Manage risk and invalidations

$QQQ this might the spot. Hello and good night, evening, afternoon, or morning wherever you may be. I have been looking at names all day and I wanted to check the indexes: NASDAQ:QQQ and $SPY.
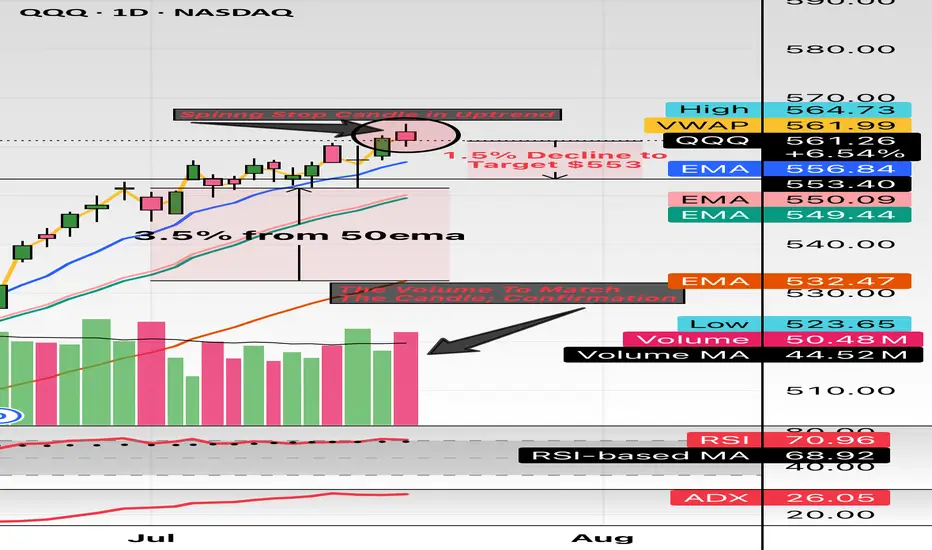
Here we have the indexes up almost 30% from the April lows and sitting about 10% YTD. The candle highlighted is the spinning stop candle and has volume to match. These candles usually take place (green or red) in downtrends or uptrends and provide pivotal indication. The market has major earnings this week (07/21/2025 to 07/25/2025) with names like Google, Tesla, General Dynamics, Verizon, Domino’s And so forth.
This week could be a catalyst to see some great volatility. I believe staying 3% from moving averages so I have noted 3.5% from the 50EMA and revisiting the 20EMA and 21EMA in the low $550 area. My target is $553 which is only a 1.4% move which can happen in one session in this environment while staying 3.5% above the 50EMA.
My trade idea will be $553p for 07/25/2025. Good luck!
WSL
Bears Intensify... $QQQ - Pullback LikelyBears Intensify... NASDAQ:QQQ
🐻 Falling Wedge Breakdown
🐻 Hammer Candle
🐻 Bearish Wr%
🐻 H5 Flow Increasing

$QQQ WARNING! 6-7% Downside Possible🚨 NASDAQ:QQQ WARNING! 🚨
Holding steady... for now.
But if we break down out of the Daily WCB and through this wedge, it’s game over—GAP FILL incoming!
💥 MM: $493.31 MT: 16 July 💥
If that happens, I’m cutting all swings FAST. Stay sharp!

QQQ best count if we rally above 525 The chart is the qqq wave structure the only alt is it is a triangle formation and that be down and up and down then rally back to above the heavy selling at 531 target I think

2007 Top /2025 day 38td t-minus 2.5 days Major TOP The chart in focus is the 2007 chart we are now day 38 in the pattern and in 2007 we took 40td to make a new high And I have posted my models .I see the next rally to reach anywhere from 6035/on the low end to 6177 on the high end focus 6147 where Ax 1.618 = wave C or 3 Best of trades WAVETIMER

$QQQ Needs this pullback to happen!NASDAQ:QQQ a healthy pullback to fill the GAP and retest the 100/200DMA here going into next week.
A break through these MA's would be very bearish.

QQQ about to FLUSH?! Let's talk about it!I'm not saying it's over but you have to admit it does feel like we are going to see a decent size pullback...2-6% over the next few weeks on the NASDAQ:QQQ AMEX:SPY
- TVC:VIX back over 20
- US20Y hit 52 week high
- USDJPY starting to creep towards April lows
- $491.54 GAP to fill on NASDAQ:QQQ
- $447.58 Bigger GAP to fill on NASDAQ:QQQ
- Credit starting to become and issue
- Banks/ Credit companies tanked today
There is bullish pieces as well but we do look extended here and a healthy 2-6% would be welcomed...A break of $475 level spells trouble on QQQ.
$QQQ is due for a pullback! GAP fill inboundNASDAQ:QQQ is due for a pullback!
- Slamming into $522ish Volume shelf
- At the red barrier and needs to peel off
- GAP fill down to $491.54
- Strong volume but can't push through $522 resistance

THIS TIME IT'S DIFFERENT!🔥 THIS TIME IT'S DIFFERENT! 🔥
Can you see the shift?! VOLUME IS HERE—AND IT'S MASSIVE. 💪💰
Unlike those weak, fleeting rallies that got crushed under waves of red, this one is packed with bullish buyers and offside hedge funds READY TO SEND IT HIGHER. 🚀📈
Not to mention the last time we had this level of above average volume for this long was in October 2023 when we were coming out of a bear market and it was only the beginning of our ascent higher!
I'm not saying we can't have a pullback soon...I'm just simply saying the volume is here and it looks like dips will indeed be shallow.
ATH retest INBOUND!
Are you positioned for the move? 👀
AMEX:SPY NASDAQ:QQQ

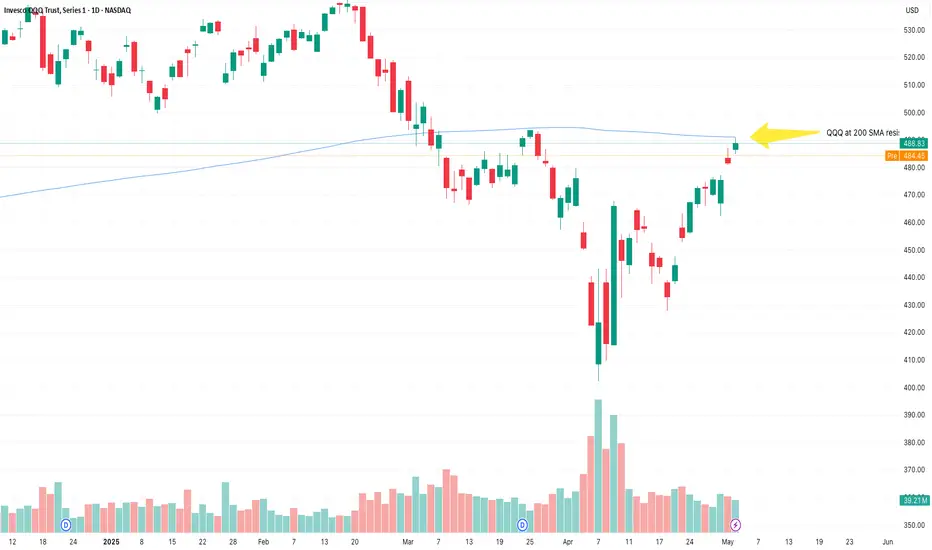
QQQ at SMA 200 resistance There might be some pullback here
I am staying bullish as long as it is above 477.58.
$QQQ Inverse H&S ready to GO!NASDAQ:QQQ
We’ve spotted an Inverse Head & Shoulders breakout on the 1-hour chart, and we’re currently in the retest phase.
- Measured Move (MM): $483.55
- Measured Timeframe (MT): May 1st @ 7 PM
Let’s see if we can maintain momentum tomorrow and steer clear of any unexpected news or market shocks tonight.
Not financial advice

$QQQ - Headed for the Next Leg DownNASDAQ:QQQ - Headed for the Next Leg Down
Bearish Wedge broke down today!
Measured Move: $377.15
Measured Timeframe: 06May
Below my H5_D Indicator and the Wr% is in motion down to the Green Barrier.
All signs are pointing LOWER!
Not Financial Advice

QQQ SHORT @ $448 TO $433Price also happens to be at the 60% fib level which is added confluence. Will most likely cut this trade around $435 just to secure profit and so I don't have to hold as long. If it decides to crash then of course ill hold. stop loss no higher than $450.7

$QQQ Poised for Lift-Off: Flipping Resistance, Eyeing $470-$475!🚀 NASDAQ:QQQ Poised for Lift-Off: Flipping Resistance, Eyeing $470-$475! 🚀
As mentioned in my recent post, we’ve successfully flipped the $443.14 resistance into support—a key technical shift!
🔹 Momentum Building:
- Wr% Indicator: Making higher lows and advancing steadily towards the Red Barrier.
- Volume Gap: Still in play and ready to be filled.
With a higher low now established, I believe we’re set up for a potential move to $470-$475 next week.
📈 Let’s see how this plays out—exciting times ahead!
💡 Have an amazing weekend, friends!
Not financial advice

Nasdaq: Higher Low or Lower High?NASDAQ:QQQ
Are we making a lower low or a higher low?
This $438-$444 previous resistance needs to hold and be flipped into support to continue this rally.
If not then we are going to break the lows!
Not financial advice

Island Bottom CONFIRMED on $QQQ IF we GAP up tomorrow!Island Bottom CONFIRMED on NASDAQ:QQQ IF we GAP up tomorrow!
I only believe we GAP up tomorrow IF there is news of China coming to the negotiation table with the U.S after they have raised the Reciprocal Tariffs to 104%.
If this doesn't happen then this isn't confirmed and we see a retest of $400 IMO!
I'm not playing this as a trade until we get confirmation! Too dangerous!
Not financial advice

How bad will it get? Let's talk about it!🌟 My Market Probabilities: 🌟
1⃣ 15% chance of a V-Shape recovery with a bottom at $410–$425
2⃣ 45% chance of a COVID-like Flash Crash resolving at
$385–$400
3⃣ 33% chance of a 2022-level bear market down to
$330–$350
4⃣ 5% chance of a 2008-level crash hitting $250–$260
5⃣ 2% chance of a crazy Dot.com-level crash dropping to $90–$110
💡 No matter which scenario unfolds, it’s a blessing in disguise! These dips create incredible opportunities to invest in great companies or indexes like the AMEX:SPY or NASDAQ:QQQ paving the way for massive, life-changing wealth over the years and decades to come.
🚀 Think long-term as an investor, friends, and stay focused on the bigger picture!
