#QTUM/USDT — Descending Triangle at Demand Zone!#QTUM
The price is moving in a descending channel on the 1-hour timeframe. It has reached the lower boundary and is heading towards breaking above it, with a retest of the upper boundary expected.
We have a downtrend on the RSI indicator, which has reached near the lower boundary, and an upward rebound is expected.
There is a key support zone in green at 1.33. The price has bounced from this zone multiple times and is expected to bounce again.
We have a trend towards stability above the 100-period moving average, as we are moving close to it, which supports the upward movement.
Entry price: 1.38
First target: 1.40
Second target: 1.44
Third target: 1.48
Stop loss: Below the support zone in green.
Don't forget a simple thing: capital management.
For inquiries, please leave a comment.
Thank you.
Qtumlong

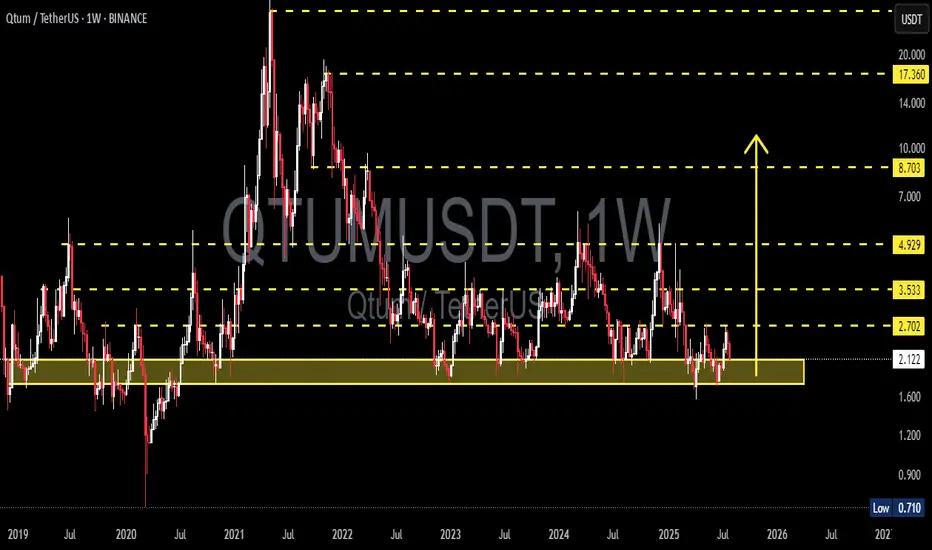
QTUMUSDT — Testing Historical Support, Accumulation or BreakdownQTUM/USDT is now sitting at one of the most crucial levels in its entire price history. The pair is once again retesting the $1.60 – $2.20 historical support zone, a level that has acted as a strong foundation multiple times since 2020. How price reacts here will determine whether QTUM enters a new accumulation phase with upside potential, or finally breaks down into fresh historical lows.
---
🔎 Technical Structure & Historical Context
Long-Term Trend:
Since the 2021 all-time high, QTUM has been in a persistent downtrend with a clear pattern of lower highs. Despite this, the $1.60 – $2.20 zone has held strong for over 5 years, acting as a major demand zone.
Key Support Zone:
$1.60 – $2.20 (yellow box). Every major retest since 2020 has resulted in a significant bounce, making this one of the most critical levels for QTUM.
Important Resistance Levels (Upside Targets):
$2.70 → nearest resistance, first bullish checkpoint.
$3.53 → major confirmation level; a breakout above could signal a structural reversal.
$4.93 → medium-term target and strong supply zone.
Higher-term resistances: $8.70 → $17.36 → $27.58 (only achievable in a macro bullish cycle).
Critical Downside Support:
If $1.60 fails, QTUM could revisit $1.00 and potentially its all-time low at $0.71.
---
📈 Bullish Scenario (Potential Accumulation & Reversal)
1. Price holds above $1.60 – $2.20 and prints a strong bullish weekly candle with rising volume.
2. Breakout above $2.70 would serve as the first reversal signal.
3. Stronger confirmation comes with a close above $3.53.
4. Upside targets: $2.70 → $3.53 → $4.93. If $4.93 is broken, momentum could carry QTUM to $8.70+.
Interpretation:
This would complete a multi-bottom accumulation pattern, often the foundation of a larger bullish cycle after prolonged sideways action.
---
📉 Bearish Scenario (Descending Triangle Breakdown)
1. Price fails to hold $1.60 – $2.20.
2. Weekly close below $1.60 confirms breakdown.
3. Downside targets: $1.00 → $0.71 (historical low).
4. The chart currently resembles a descending triangle, with a flat support and lower highs pressing down. A breakdown here could trigger heavy selling pressure.
Interpretation:
Losing this support would likely mark a continuation of the multi-year downtrend that began in 2021.
---
🧭 Conclusion & Trading Strategy
The $1.60 – $2.20 support zone is QTUM’s “life or death” level.
Bullish bias confirmed on a weekly close > $2.70, with stronger reversal above $3.53.
Bearish bias confirmed on a weekly close < $1.60, targeting $1.00 → $0.71.
Swing Trading Approach:
Consider scaling entries within $2.00 – $2.20.
Place stop-loss just below $1.55.
Take profit targets: $2.70 / $3.53 / $4.93.
If breakdown occurs → cut losses quickly or look for short setups after a retest.
Investor Perspective:
This zone could be an attractive accumulation area given its historical significance. However, risk management is critical: if $1.60 breaks, QTUM could revisit historical lows.
---
📊 Key Takeaways
Weekly close is far more important than intraday wicks.
Watch volume and momentum indicators (RSI, OBV) for confirmation of strength.
QTUM is at one of its most critical levels in the past 5 years: either a major accumulation base for a bullish cycle, or a breakdown into historical lows.
---
#QTUM #QTUMUSDT #Crypto #Altcoin #TechnicalAnalysis #SupportResistance #CryptoTrading #ChartAnalysis

QTUMUSDT Forming Falling WedgeQTUMUSDT is currently forming a falling wedge pattern, a highly recognized bullish reversal structure in technical analysis. This setup indicates that the prolonged selling pressure is weakening and buyers are gradually stepping in to regain control. As price tightens within the wedge, a breakout to the upside becomes increasingly likely, signaling the beginning of a fresh bullish phase.
Volume activity is showing healthy participation, which strengthens the case for a potential breakout. If momentum continues to build, QTUMUSDT could see a strong rally, with an expected upside gain of nearly 60% to 70%+. This projected move would place the pair in a favorable zone for both swing traders and long-term investors seeking strong technical setups.
Market participants are taking notice of QTUM’s current positioning, as the coin’s structure and momentum align with broader bullish patterns seen across the crypto market. Growing investor interest and strong accumulation at these levels provide an additional layer of confidence for a breakout scenario.
In summary, QTUMUSDT is at a crucial stage where the falling wedge breakout could fuel significant upward momentum. With strong volume support and rising investor confidence, this pair has the potential to deliver solid gains in the coming weeks.
✅ Show your support by hitting the like button and
✅ Leaving a comment below! (What is You opinion about this Coin)
Your feedback and engagement keep me inspired to share more insightful market analysis with you!

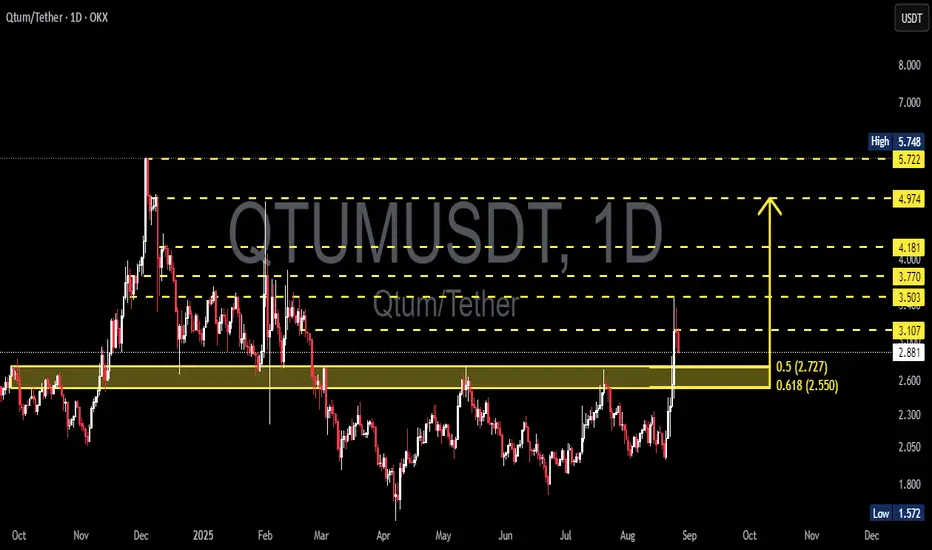
QTUM/USDT – Golden Pocket Retest as Key Decision Zone!Summary:
QTUM has just made a major breakout from its long-standing range and tapped into strong resistance around 3.10–3.50. Currently, the price is pulling back into the Golden Pocket confluence zone (Fibonacci 0.5–0.618 at 2.55–2.77), which previously acted as a strong resistance and is now being tested as support (SR-Flip). The reaction at this zone will be the key driver for the next big move.
---
🔍 Structure & Pattern
Range Breakout: QTUM escaped months of sideways consolidation.
Golden Pocket (2.55–2.77): former resistance, now tested as support.
Wick Rejection: the last candle rejected around 3.10, showing near-term supply pressure.
BOS (Break of Structure): new higher-high is formed; validation requires a higher-low above 2.55–2.77.
---
🚀 Bullish Scenario
1. Successful Retest at Golden Pocket (2.55–2.77)
Strong bounce confirms structure shift.
Targets: 3.107 → 3.503 → 3.770.
Extended targets if momentum sustains: 4.00–4.181 → 4.974 → 5.72–5.75 (previous high).
2. Reclaim of 3.10 Resistance
A daily close above 3.10 would strongly favor further bullish continuation.
---
🩸 Bearish Scenario
1. Failure to Hold Golden Pocket (daily close < 2.55)
Breakout becomes a false breakout, price falls back into the old range.
Downside targets: 2.30 → 2.05 → 1.80 → 1.57 (major low).
2. Lower High Formation at 3.10–3.50
Repeated rejection here forms a lower high, increasing breakdown risk back to 2.55–2.30.
---
⚖️ Conclusion
QTUM is now at a critical decision zone. The Golden Pocket (2.55–2.77) will act as the “last defense” for bulls. If it holds, the bullish structure remains intact with upside potential toward 3.50–4.00+. If it breaks down, sellers could take back control and drag the price back into the old range.
> Note: Always wait for daily close confirmation before making trading decisions. This is technical analysis only, not financial advice.
#QTUM #QTUMUSDT #Crypto #Altcoins #PriceAction #TechnicalAnalysis #Breakout #SupportResistance #Fibonacci #CryptoTrading
QTUM/USDT – Make or Break? Testing the Edge of Accumulation?🧠 Overview:
After going through a volatile multi-year cycle, QTUM is now back at one of the most critical historical support zones. This demand area has acted as a strong reversal point multiple times since 2020 and is once again being tested as price consolidates near the bottom of its macro range.
---
📉 Price Structure & Key Levels:
📍 Major Support Zone (1.70 – 2.10 USDT):
A proven accumulation zone based on multiple long wicks and price rejections in the past.
This is where smart money tends to accumulate during market uncertainty.
📍 Layered Resistance Levels (Bullish Targets):
2.70 USDT → Initial breakout validation
3.53 USDT → Mid-range resistance
4.93 USDT → Key structural level
8.70 USDT → Mid-term breakout target
17.36 USDT → Peak from previous macro cycle
---
🧩 Current Pattern: "Sideways Accumulation Range"
QTUM is clearly in a range-bound accumulation phase, with tight price action within a key support area. Historically, such patterns often precede large impulsive moves, especially when accompanied by volume surges and breakouts from structure.
> ⚠️ Important Note: Sideways movement at historical support, combined with increasing accumulation volume, often leads to a breakout into the markup phase.
---
📈 Bullish Scenario: Potential Upside Momentum
Trigger: A confirmed breakout and weekly candle close above 2.70 USDT.
Additional Confirmation: Strong bullish candle with increased volume.
Targets:
3.53 USDT (local resistance)
4.93 USDT (mid-range structural level)
8.70 USDT (swing target)
17.36 USDT (macro cycle high)
🎯 High reward-to-risk potential if entries are made near support with a stop-loss under 1.70 USDT.
---
📉 Bearish Scenario: Breakdown Risk
Trigger: Weekly candle closes below 1.70 USDT.
Implication: Breakdown from long-term demand zone.
Downside Targets:
1.20 USDT → Minor horizontal support
0.71 USDT → Historical all-time low
Warning Sign: High volume breakdown = likely sign of institutional selloff or panic exit.
---
📊 Strategic Summary:
> QTUM is at a pivotal crossroads.
The 1.70 – 2.10 USDT range is a decisive area.
A bullish breakout could spark a major recovery rally,
while a breakdown may lead to a deeper capitulation.
This is a “calm before the storm” situation. Traders should monitor closely as the next few weekly candles could define the trend for the rest of 2025.
#QTUMUSDT #QTUM #CryptoAnalysis #AltcoinSetup #TechnicalAnalysis #AccumulationPhase #SupportAndResistance #BreakoutPlay #CryptoBreakout
#QTUM/USDT#QTUM
The price is moving within a descending channel on the 1-hour frame and is expected to break and continue upward.
We have a trend to stabilize above the 100 moving average once again.
We have a downtrend on the RSI indicator that supports the upward move with a breakout.
We have a support area at the lower limit of the channel at 2.25, acting as strong support from which the price can rebound.
Entry price: 2.30
First target: 2.35
Second target: 2.41
Third target: 2.47

QTUMUSDT Approaches Rectangle Pattern ResistanceQTUMUSDT Technical analysis update
QTUMUSDT has been trading within a rectangle pattern for the last 150 days at the bottom yearly support. The price is now moving toward the rectangle resistance, and once a breakout occurs, a strong bullish move can be expected. The price is trading above the 100 and 200 EMAs, and there has been a noticeable rise in volume over the past few days.
Regards
Hexa

Bullish Breakout or Bearish Breakdown Ahead for #QTUMUSDT?Yello Paradisers! Are we on the verge of a bullish breakout or could a bearish breakdown be looming for #QTUMUSDT?
💎#QTUMUSDT has been trading within a tight consolidation range, hovering between a strong support at $2.040 and a key resistance at $2.789. This prolonged sideways movement reveals a market in equilibrium, with neither buyers nor sellers taking full control just yet. Typically, such consolidation phases set the stage for a significant price move once one side gains dominance.
💎Currently, all eyes should be on the $2.789 resistance level. If #QTUM breaks above this threshold with substantial trading volume, it could kick off a sharp upward move, with the next major target at $4.592. Throughout this consolidation, trading volume has remained relatively stable, but a surge could be the catalyst needed for a breakout. The RSI is showing neutral-to-bullish momentum, supporting the potential for an upward trend if resistance is broken.
💎However, if #QTUM fails to breach this resistance, we could see either a retest of the support level at $2.016 or continued sideways action. A strong rebound from this support would maintain the bullish outlook, while a breakdown below $2.016 could invalidate this setup and signal a shift towards bearish sentiment.
Stay disciplined, Paradisers. In moments like these, patience and timing are key. Don’t let market noise disrupt your strategy this could be a pivotal point, but only for those who play it smart and steady.
MyCryptoParadise
iFeel the success🌴

QTUM 25%QTUM is showing strengh, i am playing spot here. This should be easy 25% if BTC stays stable. Price action is very bullish, volume is there as well. Overall it is bullish now as market bullish as well.
NOT A FINANCIAL ADVICE
ALWAYS USE STOPLOSS AND MANAGE YOUR RISK

#QTUM/USDT#QTUM
The price is moving in a descending channel on the 12-hour frame and is sticking to it very well and is expected to break it upwards
We have a bounce from a major support area in green at 2.05
We have a downtrend on the RSI indicator that was broken upwards which supports the rise
We have a trend to stabilize above the 100 moving average which supports the rise
Entry price 2.28
First target 2.60
Second target 2.85
Third target 3.16

QTUM USDTQTUM Trade Setup.
After a confirmed breakout from the green zone, we could take entry at $2.718.
Remember stop loss is your friend. Everything is on the chart.
Entry $2.718
S.L $2.434
T.P 1 $2.998
T.P 2 $3.471
T.P 3 $4.085
T.P 4 $4.951

#QTUM/USDT#QTUM
The price is moving in a bearish channel on the 4-hour frame and sticking to it well
The price rebounded well from the lower border of the triangle at the green support level of 3.80
We have a tendency to stabilize above the Moving Average 100
We are oversold on the RSI indicator and we have a downtrend that is expected to break higher to support the rise
Entry price is 4.00
The first goal is 4.40
Second goal 4.68
The third goal is 5.00

#QTUMUSDT#QTUM
The price has been moving in a descending triangle since July 2023
The downtrend was breached
And the Moving Average 100 exceeded
Current price 3.70
First goal 4.395
Second goal 5.320

QTUMUSDT Good Potential!QTUMUSDT Technical Analysis Update
QTUMUSDT price breaks its major resistance line after 480 days of a ranging market.
This is a good bullish signal for QTUM.
Buy zone : Below $3.52
Stop loss : $2.85
Take Profit 1: $4.20
Take Profit 2: $5.40
Take Profit 3: $9.60
Regards
Hexa

QTUM/USDT upward momentum? 👀 🚀QTUM Today Analysis💎Paradisers, focus on the potential opportunity with #QTUMUSDT, as it's currently maintaining key support levels, suggesting a likely upward trajectory.
💎Historically, #QTUM has a pattern of following a descending trendline. Currently, with strong momentum above the support level of $2.889, there's a substantial chance for a bullish movement. If this upward trend continues, It is set to target resistance levels at $3.547, and might even push further to challenge the higher resistance at $4.325.
💎 While some newcomers may consider panic entries, the sage Paradisers know that timing is crucial in capitalizing on this scenario. Identifying the most favorable entry points during this expected rise is essential, along with being cautious about entering at the market's peak.
💎 Additionally, be ready for a possible bullish rebound from the bullish Order Block (OB) of $2.425. The presence of a Fair Value Gap (FVG) further reinforces the bullish scenario of #QTUM. However, a drop below this level could raise concerns about the sustainability of the bullish trend.
💎 In this fluid and ever-changing market, strategic foresight and intelligent decision-making are paramount. Crafting a comprehensive trading strategy that encompasses effective money management and a deep understanding of support and resistance levels is key to achieving successful trading outcomes. 🌴💰

QTUM formed bullish Gartley for upto 53.50% pumpHi dear friends, hope you are well and welcome to the new trade setup of QTUM coin with US Dollar pair.
Previously we caught 55% pump of QTUM as below:
Now on a daily time frame, QTUM has almost formed another bullish Gartley for the next price reversal.
Note: Above idea is for educational purpose only. It is advised to diversify and strictly follow the stop loss, and don't get stuck with trade

QTUMUSDT Price PredictionAs can be seen on weekly timeframe QTUM/USDT has failed to hold the lows below the shown support and has also retested and rejected it to the upside.
With this much bullish structure a test of high at 4.33 is ver likely.

QTUM formed bullish Gartley for upto 22.505 pumpHi dear friends, hope you are well and welcome to the new trade setup of QTUM coin with BTC pair.
Previously we caught a very powerful pump of QTUM, as below:
Now on a 4-hr time frame, QTUM has formed a bullish Gartley move for another price reversal.
Note: Above idea is for educational purpose only. It is advised to diversify and strictly follow the stop loss, and don't get stuck with trade

QTUM/USDT - LONG 12 TF----- Welcome, dear followers! -----
- Here is my trading methodology. I trade with a normal system and analysis of resistance and support, as well as price reversal patterns.
- For the record, I do not place a stop loss within my trades. So that I only risk 1.5% of my total capital in order to support the loss due to a price reversal against me.
- If a price reversed against my expectation and touched the drawn line r3, then I transferred targets to the entry point and waited for the price to close at it with a loss equal to almost zero.
- Today's deal is shown in the chart, and here are the entry and exit points below.
-- Support me with numbers and follow up on my account for other deals in the future. Thank you for coming to this part. --
-------------------------------------------------------
⚡️⚡️ #QTUM/USDT ⚡️⚡️
Client: My-Binance Futures
Trade Type: Breakout (Long)
Leverage: Cross (3X)
Entry Targets:
1) 3.046 - 100.0%
Take-Profit Targets:
1) 3.149 - 12.5%
2) 3.306 - 12.5%
3) 3.332 - 12.5%
4) 3.474 - 12.5%
5) 3.549 - 12.5%
6) 3.654 - 12.5%
7) 3.893 - 12.5%
8) 4.441 - 12.5%
Trailing Configuration:
Entry: Percentage (0.2%)
Take-Profit: Percentage (0.25%)
Stop: Breakeven -
Trigger: Target (2)

qtumusdthello everyone
bearish trendline has been broken and tested.
formed an adam&eve pattern,
cup and handle
entry: 7.6-8.5
targets: 9 , 9.6,10,10.5,11.5 ,12.2,13.26

QTUM/USDT BUYING SE TUPQTUM Breakout double bottom pattern and Valid retest make some Bullish pennant and also Break
Potential Continue upward Movement🚀
Target mentioned in the chart
Stoploss : $7.9
Risk :6%

QTUM Price Targets and Stop LossQTUM/USDT
Entry Range: $7.85 - 8.76
Price Target 1: $10.27
Price Target 2: $12.07
Price Target 3: $13.88
Stop Loss: $7.15

QTUM Price Targets and Stop LossQTUM
Entry Range: $5.4 - 6.3
Price Target 1: $7.1
Price Target 2: $9.8
Price Target 3: $12.4
Stop Loss: $4.9
