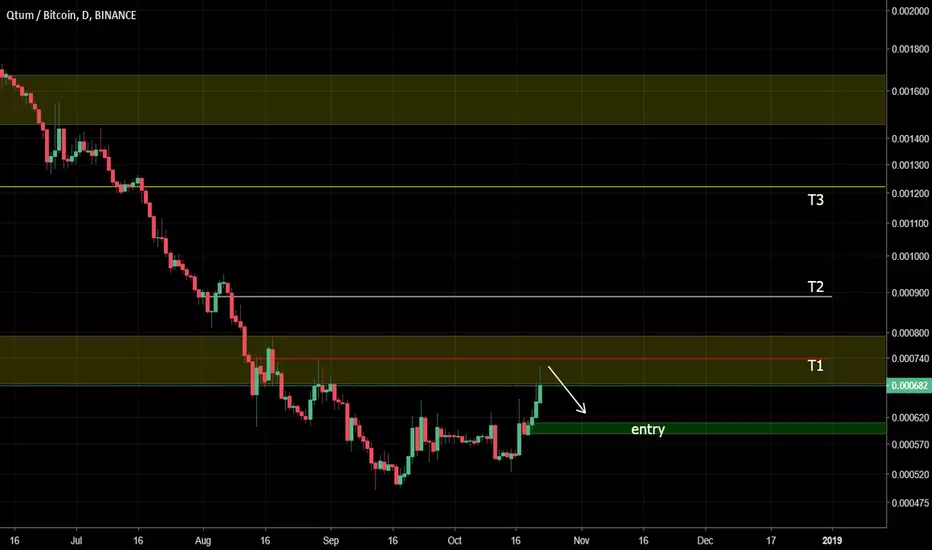
QTUM TO 1000 SATS !!**QTUM/BTC**
**ENTER** 620-630
**TARGETS** 700-800-1120
We are expecting a good break out from Qtum soon
Great risk/return on this trade
-Volume increase
-Bullish short-term trend
-bullish MA crossing(black arrow)
-25ma acting as support
Qtumlong

$QTUM #QTUMBTC Extensive Technical Analysis- Day Trader ExplainsHello Lads and Ladies,
Welcome back to TJs Daily TA session. Today, we will be looking at the trading pair of QTUM/BTC, requested by the Traders of School of Sparta. This trading pair has been making people a lot of money in the last year and it seems like that it will do it again very soon. I will tell you what I see, how I will make my own trade and explain how this might play out in a long term and in a short-term set up.
To start off we need to identify where we are in the market and what happened before, so we can understand where we are headed and what we might see in the future.
We are using the daily chart because only here we are able to correctly see and identify the trend. The reasoning behind this is that we do not want to trade against the trend and actually be able to get with the directional momentum of the chart.
Looking at QTUMBTC we can immediately see that we had a very strong and continuous downtrend form many months up until we came to a form of support and confirmed it after bounces, then broke the trend with a nice double bottom structure indicated in the yellow circle. Yet, as we know the crypto has not moved a lot in the last few months and is lacking of the correct volume and volatility. Therefore some coins and charts have a rather sideways going chart and action, here we see the same example again with QTUMBTC.
Sure, a sideway action could be short-lived and just "small stop" in the chart, yet it is holding itself for quite a long time there and keeping its support while everything else is going up, especially its oscillators and indicators.
Therefore we can say with a 80% certainty that it has bottomed out and is now in an accumulation of all of the coins that got sold over the huuuge downtrend. We have seen sudden pumps and continuations of the pumps, yet nothing really significant yet. Which leaves us with the most likely possibility that people are buying a lot of it, yet not pumping it high enough to gain attention and have a really big breakout due to FOMOers and unexperienced traders. Opportunities like these are not there very often and only traders with experience get to trade it and fill their pockets with a lot of BTC when the accumulation ends and the price starts moving upwards.
A view behind the scenes - "unfilled expanse"
When looking at a chart, the market structure and its movement creates an expanse on the chart of which you can actually calculate its surface. Now, the bigger the expanse is above the chart, the higher you have a "pull" of the chart, connected with a high buy pressure.
On the other hand, the bigger the expanse is below the chart, the higher is the pull down which is connected to a higher sell pressure.
Looking at these areas can help a lot while understanding the look behind the scenes. This works on small as on bigger timeframes and will be a topic in one of my next live-sessions.
From a rookie look, one could simply look how many possible targets above are there and how many possible targets are below.
With QTUMBTC we see that the targets above are many and wide spread, where we see here as we saw in NEOBTC as well, that there is only one target left below and breaking it would mean a complete breakdown of the market. THE THING IS, with each day and week moving sideways, we have higher and higher expanse which then at some point in time will have a TOO STRONG pull and the chart will break out and start moving upwards, while doing so gain momentum and maybe even enter an exponential phase.
As a small side note, after the last bigger push, we have now had a 61.8% retracement and are basically in the perfect position to see the next impulse move, which might or might not be the first move to break down the downtrending structure. Funnily enough this 61,8% retrace is at the exact price of 0.000618...
Based on all of the above I will make my trade like follows
QTUMBTC / Binance
BUY 618 - 575 - 550 - 520 - 500
Targets 800 - 950 - 1275 - 1400 - 1750 - 1850 - 2000 - 2200 - 2400 - 2700
Stop Loss Close Below 450
Like and Follow me and you will find this page interesting because I am a TA expert and professional day trader in crypto since 2012 that does daily updates and new posts about the hottest and most discussed coins.
This is as always a delayed post, if you are interested in first hand news, feel free to join our group.
Cheers, TJ

$QTUM - Found a bottom heading up-Nice PA
-large increase in buying at these levels
-looking for entry in green zone (daily OB) and take profits as you go.
-may see further consolidation before break of first yellow OB (daily)
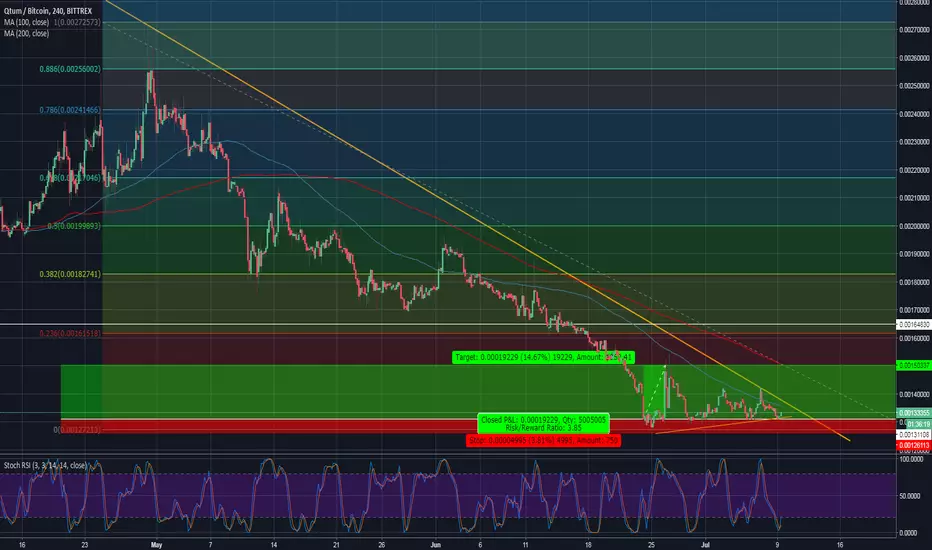
BullFilter showing bullish divergence & long opportunity on QTUMAnalysis:
Correction ended, and accumulation nearing final phase. Spikes in volume combined with bullish divergence are showing the fingerprints of a pre pump situation. Breakout from this channel expected near term.
Entry Point:
General Entry is this range is fine, just look for a local dip/low. Looking to go long in the range of 530 to 550. See detailed screenshot below, using Bottomfinder to find best local entry.
Take Profit:
The dashed red lines represent target take profit levels. We suggest cashing out 10% at T1, 35% T2, 50% T3, 5% T4 (or let it ride if it still looks bullish).
Stop Loss:
Stop Loss suggested at 480, which is below the liquidity pool likely located in the 500-525 range.
Upon completion of T1 move stop loss to entry point to secure a risk free trade. Additionally continue moving stop loss up by one target each time a new target it reached. i.e. when T2 is reached, move stoploss to T1 level.
This way you can ride out dips with no anxiety and automatically exit the trade in profit should you not be around to monitor!

Daily Bullish Signal $QTUM #QTUM $QTUMBTC (15-10)#QTUM (QTUM/BTC)
Buy : 550
Flash Sell : 565
Short Sell : 580
Long Sell : 600-620-640-660
Stop : 490
Follow me for more signals daily

QTUM soon up, QTUM/BTC gains!QTUM is looking good now looks like we can make some profits here. We had a big retracement through out the year and now it looks like we have found bottom like most of the crypto. QTUM, if we look at the green support area at 0.000564-566 we have bounced from there couple of times so we take it into account as support then with the wedge we have, it looks like a falling wedge reversal with the bullish divergence we have on EWO and STOCH RSI moving from oversold area and I see this wave taking us all the way up to 0.0007 area in the first wave and if we are starting another crypto rally then this might just be the start of the rally!
Good Luck, Traders! #moon #mooncommunity #turtlestyletrading ;)
Be a turtle my friend © Farhad Jafarov

Daily Bullish Signal #QTUM #QTUMBTC (26-09)#QTUM (QTUM/BTC)
Buy : 550
Flash Sell : 575
Short Sell : 600
Long Sell : 620-640-660-680-700
Stop : 490
Follow me for more signals daily
Inbox me if you need help or learn to trade

QTUM/BTC - Another Favorite, Great Long Setup!QTUM/BTC, Lost a lot of value in continuous downtrend so I think once price trends up more aggressive buying will happen, small descending bottom wedge in the buy zone, KDJ also turning bullish on 2D, MACD already bullish and still heavily oversold, RSI best confirmation above purple line.
Entry: 0.00051-0.00055, Targets: TP1 0.00060, TP2 0.000711, TP3 0.000886-0.0009431
Feel free to comment, like and don't forget to check out my signature for all my social links!

Daily Bullish Signal #QTUM #QTUMBTC (19-09)#QTUM (QTUM/BTC)
Buy : 510-520
Flash Sell : 530
Short Sell : 550
Long Sell : 580-620-660
Stop : 490
Follow me for more signals daily
Inbox me if you need help or learn to trade


Technical Analytic for #QTUM (28/08) - CryptoStation#QTUM (QTUM/BTC)
Buy : 655-665
Flash Sell : 670-680-690-700
Short Sell : 710-720-730-740-750
Stop : 650
Follow me for more signals
Inbox me for more and more signals

QTUM just needs a Bump in Volume to see 40%+ in PROFIT!QTUM just needs a Bump in Volume to see 40%+ in PROFIT! Likes & Comments are Appreciated!


QTUM - looking for an upside move ?#QTUM is still trending below the key bull/bear trend line. The trend line connects a multi-year high of the coin with two other swing highs but has now pushed the coin almost to the wall as constant bearishness overwhelms the bulls. #QTUM has been supported by a minor upward trend line that connects lower highs from the recent days. At one point in time, the pair will have to break the big trend line and clear all stops that sit just above it. In order for this to happen, a more significant non-technical i.e. fundamental catalyst will have to take place to provide a major boost for the bulls. The more time the coin spends below the trend line, the more stops get accumulated above it = the stronger the break out move is. Furthermore, the RSI is trending near the lows on the daily time frame, which also points to the potential bounce.
Idea LONG
Entry: First close above the trend line on the minimum H4 chart. The trend line currently sits at 0.0013700.
Stop: 0.0012600
Target 1: 0.0014300 (swing highs)
Target 2: 0.0015000 (200MA on H4)
Target 3 : 0.0016150 (23.6% retracement)


QTUM: TargetsWell, this is the continuation of the original publication about QTUM so i will not write to much here.
After studying the chart again, an AltShark can be identified inside the Cypher called yesterday.
So for this next QTM move Targets are specified in the Green Boxes.
If you like my ideas, please leave your comment, hit like and share it, i will be very appreciated.
Have a wonderful day!
GoodTrade!
-CJ-

QUTUM.Qutum is an amazing project cause for how it is focused.. They are pointing specifically to certain range of 'customers' so in someway they are building some future basis for crypto revolution and tech evolution.. They have achieve the total compatibility between bitcoin core and ether protocols.. they are making one of the most stables platform for developers who are thinking to make their projects in the blockchain giving them the possibilitie even of create their own tokens or inner chains.
Beside that, nice things are coming for QTUM.. and one of them is the CYPHER completation OR eventually a SHARK.
If this goes like we hope.. QTUM IS READY and profits are over 50%
This is a personal view of the project and Im totaly bullish here... that's why you shouldn't take this as a trading advice or something related.. just is my opinion.. before you take any decition, make your own research and decide in your own wisdom.. I hope you, me and all of us can do that with the clearest mind possible ... cause we all seek to thrive.
All feedbacks, teachings or any constructive comment are welcome.
GoodTrade
-CJ-

QTUM! PARABOLIC SELL OFF **UPDATE**RSI is oversold, so there is the potential to play the bounce, however it is too risky in my opinion, unless you have to motivation to do so. So as listed in my other QTUM chart, except now "updated" to fix the chart text TYPO...I have been expecting a bullish reaction here at the 61.8% Golden Zone, where YES, we can see we have found nice support...for the time being, but obviously the correlation with Bitcoin is strong, as it is with every other coin.
CURRENT STRATEGY.
I'm going to wait and see. We can see previously, we basically double bottomed, and are on our way back down, so I would ABSOLUTELY NOT enter a long position until I see what happens, if and when we reach the lower fib targets.
If we punch through the Golden Zone, then watch the reactions at 78.6% and the 88.7%. But I'm watching from the sideline until we see confirmation of a reversal.
Thanks
**NOT FINANCIAL ADVICE, JUST SHARING WHAT I SEE.**


QTUM/BTC ready to go!?It is approaching a critical resistance/support fibonacci line, namely the 0.0020 price. This is evident as it has been sitting at this location for some time now accumulating volume. We have a definitive uptrend as indicated by the black trend line. The MACD is ready to go and the cloud is thin, indicating the potential for a breakout. Wait for a move past 0.0021 For more analysis check out
t.me

QTUM Daily TrendQTUM Daily Chart from the 3-31 CointheCrypto youtube video!
coinmarketcap.com
qtum.org
notes on QTUM
Build Decentralized Applications that Simply Work
Executable on mobile devices, compatible with major existing blockchain ecosystems
Build decentralized applications you can trust
Smart Contracts that Mean Business
Go Mobile
Account Abstraction Layer
Cross Platform and Backward Compatibility

#QTUM looking for correction for buying opportunity.#QTUM has been going very smoothly, if you bought off my old QTUM signal it went 5.25x initial investment.
We are looking for QTUM to correct and gain support at the 618 on the fib. When it does, and support is confirmed it will be a good buying opportunity.
