QTUMUSDT — Testing Historical Support, Accumulation or BreakdownQTUM/USDT is now sitting at one of the most crucial levels in its entire price history. The pair is once again retesting the $1.60 – $2.20 historical support zone, a level that has acted as a strong foundation multiple times since 2020. How price reacts here will determine whether QTUM enters a new accumulation phase with upside potential, or finally breaks down into fresh historical lows.
---
🔎 Technical Structure & Historical Context
Long-Term Trend:
Since the 2021 all-time high, QTUM has been in a persistent downtrend with a clear pattern of lower highs. Despite this, the $1.60 – $2.20 zone has held strong for over 5 years, acting as a major demand zone.
Key Support Zone:
$1.60 – $2.20 (yellow box). Every major retest since 2020 has resulted in a significant bounce, making this one of the most critical levels for QTUM.
Important Resistance Levels (Upside Targets):
$2.70 → nearest resistance, first bullish checkpoint.
$3.53 → major confirmation level; a breakout above could signal a structural reversal.
$4.93 → medium-term target and strong supply zone.
Higher-term resistances: $8.70 → $17.36 → $27.58 (only achievable in a macro bullish cycle).
Critical Downside Support:
If $1.60 fails, QTUM could revisit $1.00 and potentially its all-time low at $0.71.
---
📈 Bullish Scenario (Potential Accumulation & Reversal)
1. Price holds above $1.60 – $2.20 and prints a strong bullish weekly candle with rising volume.
2. Breakout above $2.70 would serve as the first reversal signal.
3. Stronger confirmation comes with a close above $3.53.
4. Upside targets: $2.70 → $3.53 → $4.93. If $4.93 is broken, momentum could carry QTUM to $8.70+.
Interpretation:
This would complete a multi-bottom accumulation pattern, often the foundation of a larger bullish cycle after prolonged sideways action.
---
📉 Bearish Scenario (Descending Triangle Breakdown)
1. Price fails to hold $1.60 – $2.20.
2. Weekly close below $1.60 confirms breakdown.
3. Downside targets: $1.00 → $0.71 (historical low).
4. The chart currently resembles a descending triangle, with a flat support and lower highs pressing down. A breakdown here could trigger heavy selling pressure.
Interpretation:
Losing this support would likely mark a continuation of the multi-year downtrend that began in 2021.
---
🧭 Conclusion & Trading Strategy
The $1.60 – $2.20 support zone is QTUM’s “life or death” level.
Bullish bias confirmed on a weekly close > $2.70, with stronger reversal above $3.53.
Bearish bias confirmed on a weekly close < $1.60, targeting $1.00 → $0.71.
Swing Trading Approach:
Consider scaling entries within $2.00 – $2.20.
Place stop-loss just below $1.55.
Take profit targets: $2.70 / $3.53 / $4.93.
If breakdown occurs → cut losses quickly or look for short setups after a retest.
Investor Perspective:
This zone could be an attractive accumulation area given its historical significance. However, risk management is critical: if $1.60 breaks, QTUM could revisit historical lows.
---
📊 Key Takeaways
Weekly close is far more important than intraday wicks.
Watch volume and momentum indicators (RSI, OBV) for confirmation of strength.
QTUM is at one of its most critical levels in the past 5 years: either a major accumulation base for a bullish cycle, or a breakdown into historical lows.
---
#QTUM #QTUMUSDT #Crypto #Altcoin #TechnicalAnalysis #SupportResistance #CryptoTrading #ChartAnalysis
QTUMUSDC

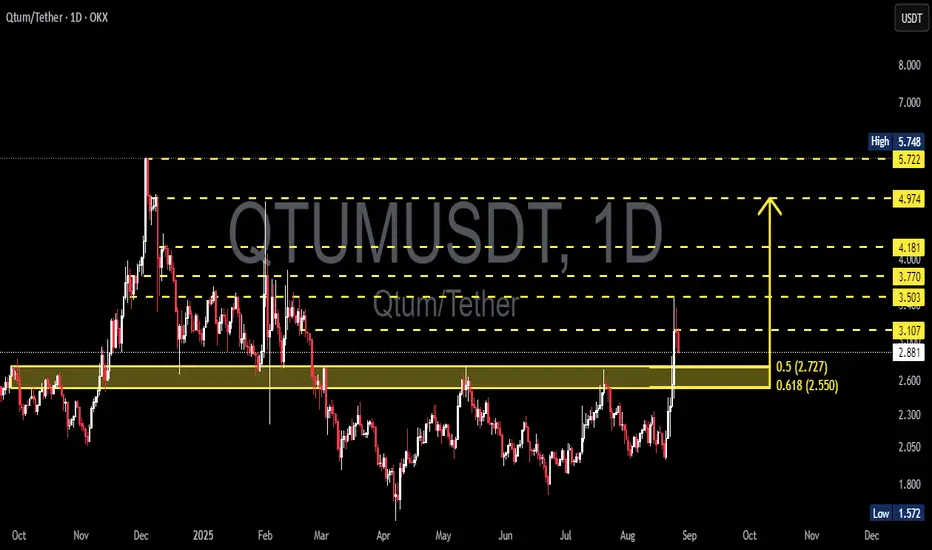
QTUM/USDT – Golden Pocket Retest as Key Decision Zone!Summary:
QTUM has just made a major breakout from its long-standing range and tapped into strong resistance around 3.10–3.50. Currently, the price is pulling back into the Golden Pocket confluence zone (Fibonacci 0.5–0.618 at 2.55–2.77), which previously acted as a strong resistance and is now being tested as support (SR-Flip). The reaction at this zone will be the key driver for the next big move.
---
🔍 Structure & Pattern
Range Breakout: QTUM escaped months of sideways consolidation.
Golden Pocket (2.55–2.77): former resistance, now tested as support.
Wick Rejection: the last candle rejected around 3.10, showing near-term supply pressure.
BOS (Break of Structure): new higher-high is formed; validation requires a higher-low above 2.55–2.77.
---
🚀 Bullish Scenario
1. Successful Retest at Golden Pocket (2.55–2.77)
Strong bounce confirms structure shift.
Targets: 3.107 → 3.503 → 3.770.
Extended targets if momentum sustains: 4.00–4.181 → 4.974 → 5.72–5.75 (previous high).
2. Reclaim of 3.10 Resistance
A daily close above 3.10 would strongly favor further bullish continuation.
---
🩸 Bearish Scenario
1. Failure to Hold Golden Pocket (daily close < 2.55)
Breakout becomes a false breakout, price falls back into the old range.
Downside targets: 2.30 → 2.05 → 1.80 → 1.57 (major low).
2. Lower High Formation at 3.10–3.50
Repeated rejection here forms a lower high, increasing breakdown risk back to 2.55–2.30.
---
⚖️ Conclusion
QTUM is now at a critical decision zone. The Golden Pocket (2.55–2.77) will act as the “last defense” for bulls. If it holds, the bullish structure remains intact with upside potential toward 3.50–4.00+. If it breaks down, sellers could take back control and drag the price back into the old range.
> Note: Always wait for daily close confirmation before making trading decisions. This is technical analysis only, not financial advice.
#QTUM #QTUMUSDT #Crypto #Altcoins #PriceAction #TechnicalAnalysis #Breakout #SupportResistance #Fibonacci #CryptoTrading
QTUM SET FOR BULLISH RALLYQTUM is currently trading in downtrend due to rise in BTC Dominance and is currently going towards demand zone. Breakout from a descending channel can be signal towards bullish rally and resistance zone.

BUYING QTUM HERE FOR POTENTIAL 600%+ GAINSGood day fellow traders. Today we will be looking at the Trading pair QTUM/USDT picking up from were we left off.
In our last/original QTUM idea, We identified potetial buy zones and support areas to cop some tokens for long-term gains
Price has met our Mega buy zone area and we could have seen the end of the wave 2 correction.
Also in line with the Ascending trendline we formed on the start of the smaller degree wave 1(white), its a good area to add to your qtum bag.
You can set some orders below on any of the white horizontal supports and try your luck.
Target for wave 3 is previous ATH as the first target
Global target for wave 5 is $51-$60 as the 2nd target.
As always feedback is appreciated.
Original idea linked below.
