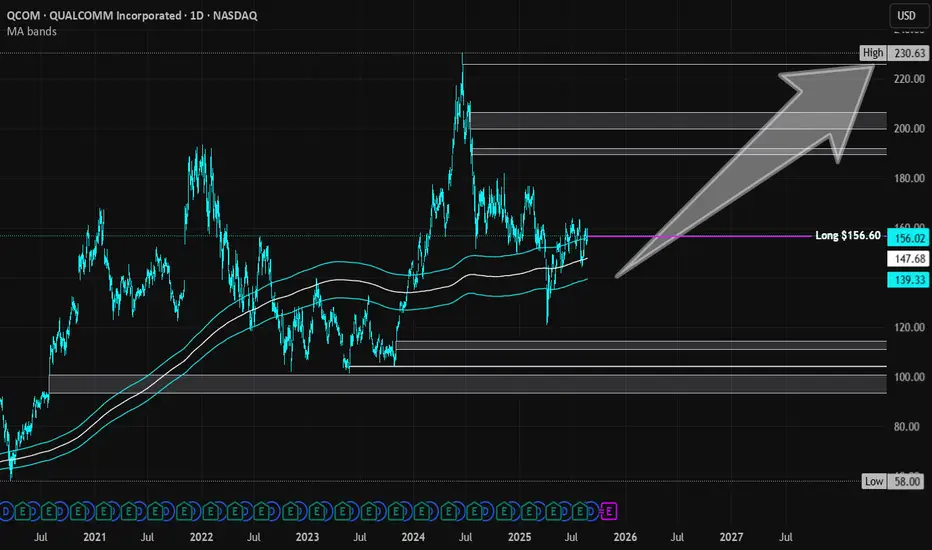
Qualcomm Incorporated ($QCOM) Surges on Record Q4 EarningsQualcomm Incorporated (Nasdaq: NASDAQ:QCOM ) delivered a strong fiscal Q4 2025, posting record results that surpassed Wall Street expectations and reinforced its leadership across mobile, automotive, and IoT markets. The stock, currently trading near $172, remains in a long-term uptrend supported by a clear ascending trendline, with technicals hinting at a potential continuation rally toward the $230 region.
For the quarter, Qualcomm reported $11.3 billion in revenue, exceeding its guidance range, and a non-GAAP EPS of $3, also above the high end of expectations. Its QCT (chipmaking) division led the charge, generating $9.8 billion, up 9% sequentially, while the automotive business posted a record $1 billion in quarterly revenue — a 36% year-over-year surge. The IoT segment also expanded by 22%, highlighting diversification beyond smartphones.
On a full-year basis, Qualcomm’s fiscal 2025 non-GAAP revenue climbed 13% year-over-year to $44 billion, with QCT contributing $38.4 billion, up 16%. The company achieved a 29% EBT margin, hitting the upper end of guidance, and reported a record $12.8 billion in free cash flow, underscoring operational strength and disciplined capital management.
Looking ahead, Qualcomm expects Q1 fiscal 2026 revenue between $11.8 billion and $12.6 billion, with EPS projected at $3.30 to $3.50. QCT revenue is guided between $10.3 billion and $10.9 billion, while licensing (QTL) is expected to deliver $1.4–$1.6 billion.
Technically, the chart suggests a bullish retest scenario near $170–$165 before a possible rebound toward $230, aligning with the company’s strong growth outlook. With momentum building in automotive and AI-powered chip demand, Qualcomm is well-positioned for further upside as 2026 begins.
Qualcom

Qualcomm Inc | QCOM | Long at $156.60Qualcomm NASDAQ:QCOM is a global leader in wireless technology, focusing on 5G chipsets, AI-capable Snapdragon processors, and connectivity solutions for smartphones, IoT, and automotive. Revenue through 3 quarters of 2025 is ~$40B. Revenue growth is anticipated to be 10-12%, year over year (2026: ~$45B; 2027: ~$50B; 2028: ~$56B). 5G adoption, AI chip demand, and automotive needs should continue to drive the stock price. Earnings per share are projected to grow 12-14%, year over year (2026: ~$11.20; 2027: ~$12.80; 2028: ~$14.70). Thus, the future looks quite bright for NASDAQ:QCOM .
Regarding price, it is currently trading at a PE of 15x and has a 2.25% dividend. The price is resting just above my historical simple moving average channel. I do anticipate it to drop into the channel (down in the high $130's-$140's) in the near-term due to typical September selloffs. However, I plan on adding more in the zone. A major bear case would be a major drop into the $90's to fill the price gaps on the daily chart before moving higher. I do not think this will happen unless a major catalyst in the market emerges - but always be prepared. Regardless, it is a strong company providing products and services that are in high demand. Currently fairly valued, I believe it become undervalued as the demand for 5G and new phone chips with AI capabilities emerges.
Thus, at $156.60, NASDAQ:QCOM is in a personal buy zone with a likely near-term drop into the $130's and $140's.
Targets into 2028:
$191.00 (+22.0%)
$225.00 (+43.7%)
QUALCOMM Short Trade Hits TP1 – More Bearish Targets PossibleTechnical Analysis: QUALCOMM – 15-Minute Timeframe (Short Trade)
QUALCOMM has reached TP1 (171.92) in the short trade, with the remaining targets still in play. The initial downtrend is confirmed, and we are closely watching for the next targets to be hit.
Key Levels
Entry: 173.07 – The short position was initiated following clear bearish signals.
Stop-Loss (SL): 173.99 – Risk management placed above the entry point to limit potential losses.
Take Profit 1 (TP1): 171.92 – First target hit, confirming the downtrend's strength.
Take Profit 2 (TP2): 170.08 – The next target is set as momentum continues downward.
Take Profit 3 (TP3): 168.23 – Further price movement could test this level soon.
Take Profit 4 (TP4): 167.09 – The final target for this short trade.
Trend Analysis
The price has broken below the Risological Dotted trendline, showing sustained bearish momentum. The price action confirms the downtrend, with TP1 already achieved, and lower targets still within reach.
QUALCOMM has started its downward movement by hitting TP1. We are now observing further bearish pressure to meet the next targets. Risk management remains crucial with the stop-loss in place.


8/17/22 QCOMQUALCOMM Incorporated ( NASDAQ:QCOM )
Sector: Electric Technology (Telecommunications Equipment)
Market Capitalization: $166.799B
Current Price: $148.53
Breakout price trigger: $151.35
Buy Zone (Top/Bottom Range): $146.80-$141.25
Price Target: $164.20-$165.30
Estimated Duration to Target: 32-35d
Contract of Interest: $QCOM 9/16/22 150c
Trade price as of publish date: $4.75/contract

QCOM Trade Idea Hi Traders,
Here's a long opportunity on QCOM, entry with stop buy order, everything is mentioned in the chart.
NFA, DYOR.
Good luck.

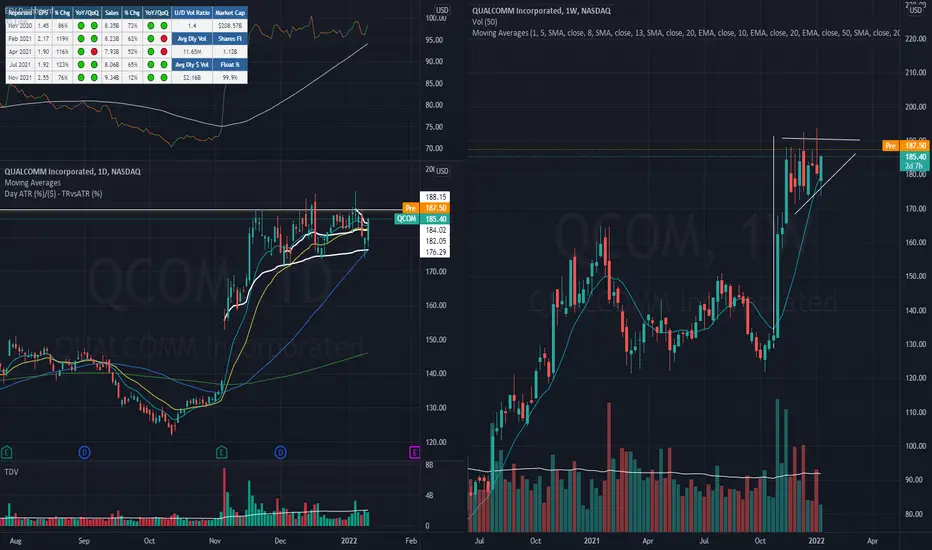
US Stock In Play: $QCOM$QCOM upon its Q3 earnings gap up, it remains relatively resilient to market weaknesses since december. also flagging in weekly chart.
yesterday's closed have $QCOM trading beyond all significant VWAP, above 10/10/50 MA.
$188.15 is the ideal level for a tight entry to size up
QCOM Similar pointsOn this chart I have used Gann and a Parallel channel to display two similar points in the evolution of QCOMS value
Where the green Gann fan and Parallel channel meet through the uptrend can be considered similar both because of there place on the chart, and price action
Using this I have plotted a white Bars pattern, where I expect price to move to
Using the MavilimW indicator, it can be seen within both wedges , the indicator becomes very unstable, swinging between up and down
Perhaps an intrinsic property of the Wedge pattern
This is the weekly chart for QCOM

Not all stocks will die in this wave down (QUAL) Many tech stocks are overvalued but Qualcomm and intel are both still undervalued
