11/28/21 QCOMQUALCOMM Incorporated ( NASDAQ:QCOM )
Sector: Electric Technology (Telecommunications Equipment)
Current Price: $175.74
Breakout price trigger: $181.00
Buy Zone (Top/Bottom Range): $172.00-$165.00
Price Target: $196.00-$200.00
Estimated Duration to Target: 61-69d
Contract of Interest: $QCOM 2/18/22 200c
Trade price as of publish date: $5.40/contract
Qualcomm

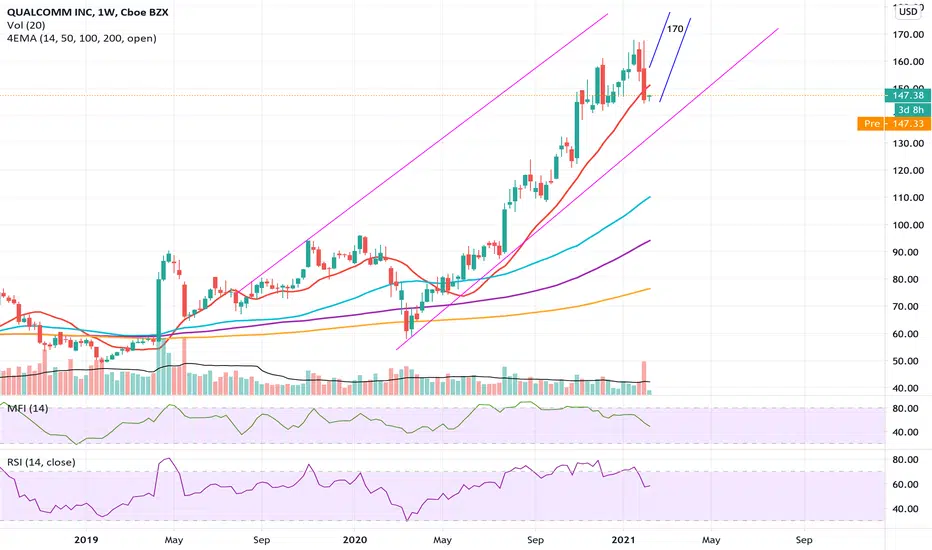
QCOM Similar pointsOn this chart I have used Gann and a Parallel channel to display two similar points in the evolution of QCOMS value
Where the green Gann fan and Parallel channel meet through the uptrend can be considered similar both because of there place on the chart, and price action
Using this I have plotted a white Bars pattern, where I expect price to move to
Using the MavilimW indicator, it can be seen within both wedges , the indicator becomes very unstable, swinging between up and down
Perhaps an intrinsic property of the Wedge pattern
This is the weekly chart for QCOM

$QCOM | UPDATEAll targets HIT and gap nearly filled after a monster move from earnings! Idea was shared when QCOM was trading at just $130 resulting in over 20% move in equity.
Congrats if anyone played this one!!

$QCOM | WEEKLY WATCHLIST 11/1 Didn't have time to do a full Elliot Wave Theory analysis on this one, I apologize for that. However, very clear supply/demand zones labeled, while trading within a wedge. Extremely attractive bullish inverse head & shoulders shown on the chart, looking to potentially confirm and breakout early in the week.
The only thing holding me back from this is the fact that Qualcomm reports earnings on November 3rd. Setup is extremely good on this one, so I may make an exception and possibly day trade this one before earnings. Not looking to swing until after earnings is reported.

QualcommW bottom forming on the daily. Mac D is on the support side. Company is solid. Tech is booming like it or not. I want to see if price can retrace its previous high between 38 -61%. I honestly don't have any recent catalyst for this. This is purely TA for me although I know this company is legit. It's expensive to me to be honest but I feel confident in this retracement.

$QCOM | WEEKLY WATCHLIST 10/18Nice bounce off the bottom of the wedge here. Looking for continuation upwards to targets above at $135, $139, $141 and $145 as long as the low holds. Take note of the Daily MACD curling positive as well as the Daily RSI breaking out of downtrend!
I am already positioned in a long swing from last week on this.

QCOM | In a major support zone | Possible paths to expectToday, we will take a look at QCOM
The price is currently against a major support zone that has been working effectively since October 2020. Let see what we can expect in case of bearish or bullish resolutions.
This analysis is meant for people that develop short-term setups. Why am I saying this? because, at the moment, we can't think about new trends like the one from March 2020 until January 2021. To start thinking about something like that, I want to see a breakout of the current structure, at least. Alright, with all that said, let's start.
BULLISH scenario: If the price effectively bounced on the support zone, a propper invalidation zone for it would be 120 (there, we will start thinking that the level was absolutely broken)The target we will use for this idea is the white descending trend 142.00. There we will be open to rejections.
BEARISH scenario: If the price is able to break the support zone reaching a price of 117.00, we will expect a pullback towards the broken support level. IF that happens, a new low on that pullback would confirm the bearish movements with a target on 100
Thanks for reading!

QCOM longEntry price: 124-128$
Target price: 139-141$
Keltner Channels: The price is oscillating close to the lower boundary.
RSI: under 30 level, thus the asset is oversold.
Fib Retracement: The price is approaching 0 Fibonacci level.
Fib Time Zone: The price movement is supposed to occur around 14th of October.
Conclusions: RSI, Keltner Channels and Fib Time Zone suggest the trend reversal in the near future. Therefore, the long position is recommended between 0 and 0.236 Fibonacci levels. Moreover, the price is likely to achieve the target around 0.786 Fib level as there is very strong resistance zone.
No financial advice.

QCOM / Flag pattern on a great technical context Today we will speak about QCOM on a range situation that we like the context.
What can we see here?
- The price is inside a range since January 2021
- Currently, the price is supported on an ascending trendline + relevant support/resistance zone level.
- Another important aspect of the chart is that we can see a fully formed ABC flag pattern with great proportions.
- If we consider the current ascending channel (which is like an expanding one), we can see the price in the lower range of it. That means that if the bullish movement appears as we expect, we can think of targets on the next resistance level or in the other extreme of the expanding channel.
- We have defined an activation level above "B." In general, terms that are the safer place to execute setups (we avoid A LOT of fakeouts)
- If the price reaches the activation level and then everything goes as Sh@&t. It's important to know where we will say, "hey is time to leave this idea." That place is below "C."
- If the price never reaches the activation level and keeps falling, we will cancel our view if we see a new low
- The expected time of resolution for this idea if everything goes as expected is between 30 and 45 days.
- What about the risk?: ALWAYS BETWEEN 1% TO 2% (Why are you shouting...?) Because this is the most relevant aspect of trading. You MUST protect your capital, and the only way of doing that is having great risk management because bad times will come, always come, and you need to be ready to absorb those stops like a champion.
Thanks for reading, guys! We wish you a great trading week.

QCOM in Ascending Triangle $180 PT If you are looking for a 5G play QCOM is a stock you should consider.This fairly valued company trading at just under 20 PE and a 2% dividend is set to grow its business exponentially due to the roll out of 5G. QCOM is well positioned for the roll out of 5G as they manufacture the leading 5G chip called the snapdragon. Also, the infrastructure bill is a looming catalyst as it would allocate over 7b to the roll out of 5G. Given QCOM is trading in an ascending triangle I believe we will break to the upside as 72% of the time in this pattern there is a break to the upside. My price target is $180 for QCOM.

QCOM gap fill playQCOM gapped up from recent earnings and then had an inside day setting up for a big move either up or down. There is an enormous gap above from 152-162 as well as a smaller gap below from 146.50-143.
Considering the volume on the earnings breakout from the ascending triangle, QCOM is leaning more bullish but can be played either direction.
Calls above 152
Puts below 146.50

QCOM - $165 PRICE TARGET QCOM - Current Price $130.48 Price Target $165
Qualcomm is set to benefit greatly not just from the chip shortage but the unexpected drop in supply of chips used for cellphones and handsets.Qualcomm’s Snapdragon 888, its new high-end chip with a 5G modem for Android phones. The newer chip which came out in Dec 2020 supports many types of 5G networks, the chip improved graphics rendering and improved artificial intelligence capabilities for things like facial and image recognition. Their 5G chip couldn’t come at a better time as tensions between the rest of the world and china continue, companies outside of China have started to avoid buying from Huawei. Back in 2019 Trump banned Huawei products in the US, and in July of 2020 the UK banned Huawei and their 5G chips and even said the companies existing equipment in the country will be removed by 2027. This is the perfect time to buy a trusted US chip maker that has a unique ability to steal significant market share in the 5G chip market. Great Value @ under 20x PE, 1.9% dividend!

$QCOM$QCOM and the other semi names have taken a dip from their ATH but held up relatively well vs $QQQ recently. If the semis get a pop, they can see a continued move back to ATH. We like $QCOM here at the 200DMA support and previous resistance level of $130 for a long.

Qualcomm (QCOM)Qualcomm Inc.
For those unfamiliar with Qualcomm: leading company in the production of chipsets for the best Android smartphones in circulation. Also active in the development of 5G, artificial intelligence, modems, and wifi antennas.
I entered long on this company with undoubted growth potential, after the rather violent pullback in February, where the price has discounted well 25.89%!
Technical Analysis: With Thursday's close above the 137.27 level, QCOM nearly closed its November GAP. Very important strength index.
The uptrend is accompanied by good volumes, considering that the stock is unlikely to trade more than 20 million shares per day.
Also considering the volumetric analysis, here are my targets:
1st target: 147 $
2nd target: 152 $
3rd target: 160 $
Lazy Bull

QUALCOMM (QCOM) Buy Signals on D1.QUALCOMM (QCOM),D1: Mirror level + Bollinger bands + Harami/Inside bar + Oversold + Discount

QCOM - Daily oversold - PT: $240RSI indicator showing that Qualcomm is oversold. A reversal to max $220 - $240 is very likely.
For educational purposes only.

Great Qualcomm play on the retest of the long-term uptrendThe uptrend line from March lows will need to be retested at some point in the medium-term future.


NIO- Partnership with NVIDIA and QualcommShort-term catalysts may be in the play for NIO.
On January 9, NIO unveiled its long-awaited first sedan, the NIO ET7 which uses Nvidia's DRIVE Orin system-on-a-chip and Qualcomm's chips for 5G capability. Together, NIO and NVIDIA aim to accelerate the development of autonomous driving on smart vehicles.
According to CNEVPOST, on Saturday, Qualcomm said that it would work with NIO to bring the latest next-generation digital cockpit technology to the ET7, which would use the third-generation Qualcomm Snapdragon Automotive Digital Cockpit Platform and the Qualcomm Snapdragon Automotive 5G Platform.
Follow me and smash that like button
DYOR, not the investment advice.

5G unitWOW wall street is on this like a Dog with a bone nice Day nice strong finish with volume. Hoping for a continuation tomorrow hello 20 in a week?

Forecasting Plan Qualcomm Wednesday, 23 December 2020
8:32 AM (WIB)
Technology and Artificial Intelligence with 5G will be a more powerful dynamic in every aspect of life with Qualcomm.
investor.qualcomm.com
Best regards,
RyodaBrainless
"Live to Ride and Ride to Live"
