QNT = stable before a big move. Quant is sitting at a major point of interest after a long compression. Price is pressing into a well-defined demand zone that’s been defended multiple times.
Downside momentum is fading, with each push lower showing less follow-through. That often signals seller exhaustion, not expansion.
Above price sits a clear volume and resistance stack. A reclaim of the mid-range could open a cleaner path higher, while a loss of this floor is the line in the sand.
This is a decision zone. Patience and confirmation matter here.
What’s your bias on QNT?
Quant

Mutanabby_AI | ONEUSDT_MR1Simple question:
As a quant trader, do you think this strategy will survive in live trading?
Yes or No? And why?

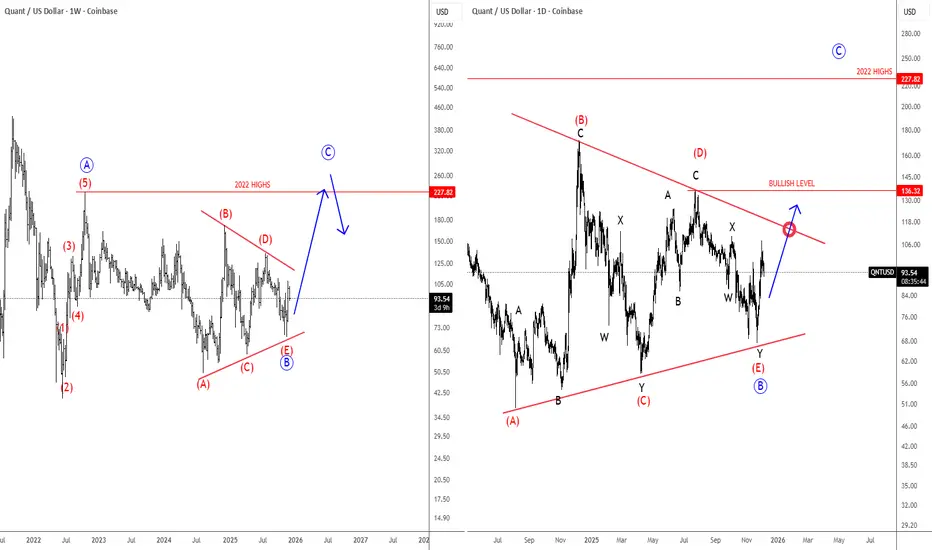
Quant Is Finishing A Bullish Triangle FormationQuant Network is a blockchain interoperability project that lets different blockchains communicate with each other. Its operating system, Overledger, allows developers and businesses to build apps that can run across multiple blockchains at the same time.
The token QNT is used to access and pay for Overledger services.
Quant with ticker QNTUSD is still holding up well above the lower triangle line, so bulls are still here. On the weekly basis, we can now see it finishing a bullish triangle pattern in wave B before we may see another rally for wave C. On a daily chart, it may actually have a completed complex W-X-Y decline within final wave (E) of B, but bullish confirmation for wave C is only above the upper triangle line and 136 level.
QNT: Moonvember Updates#QNT is one of the alt-coins that performed strongly during the 2020 run. With the recent growing interest in older projects, it looks promising for the near future, showing potential to target new ATHs.
#Quant

AI in Trading: Hype, Hope, and Hard Truths# TradingView Post: AI in Trading (TradingView Formatting)
"I just made a ChatGPT trading bot that's up 300% in backtests!"
I see this exact post at least 5 times a week. And every time, I know exactly how it ends—blown account, confused trader, and another person convinced that "AI doesn't work in trading."
Here's the uncomfortable truth: AI absolutely works in trading. Just not the way most people think.
The problem isn't the technology—it's that everyone's obsessed with the sexiest part (predicting the next candle) while ignoring the parts that actually make money.
After building dozens of systematic strategies for clients across crypto, forex, and equities, I've learned this: the hard part of trading isn't generating signals. It's managing risk, optimizing execution, and knowing when your edge has disappeared.
Let me show you where AI actually creates alpha—and why your "predictive model" probably won't.
━━━━━━━━━━━━━━━━━━━━━━
The Real Problem With AI Signal Generation
Before we get to what works, let's talk about why most AI trading bots fail:
The Data Problem:
Markets are non-stationary (the game changes constantly)
You need 10,000+ samples for reliable ML models
But market regimes shift every 200-500 bars
You're essentially training on data from a different game
The Overfitting Trap:
Your LSTM "learned" patterns that existed once and may never repeat
95% backtest accuracy? That's usually a red flag, not a green light
Walk-forward testing reveals most models have zero predictive power out-of-sample
The Competition Reality:
Renaissance Technologies has PhDs, decades of data, and billions in infrastructure
Your GPU and 2 years of OHLCV data isn't competing with that
By the time a pattern is obvious enough for simple ML to find, it's arbitraged away
Can pure signal generation work? Yes—but it's the hardest application of AI in trading, not the easiest.
━━━━━━━━━━━━━━━━━━━━━━
Where AI Actually Adds Value (The Unsexy Truth)
Here's what nobody tells you: institutional quant funds use AI heavily, just not for predicting price direction. They use it for the operational advantages that compound over thousands of trades.
1. Position Sizing & Risk Management
Traditional fixed-percentage position sizing (risk 2% per trade) ignores market reality. Sometimes 2% is too aggressive, sometimes it's leaving money on the table.
I've tested reinforcement learning models that dynamically adjust position sizes based on:
Current market volatility regime (VIX, ATR percentiles)
Correlation breakdown between portfolio assets
Recent strategy performance and drawdown depth
Portfolio heat distribution across sectors
Real result from a client system: 23% reduction in maximum drawdown vs. fixed sizing, with nearly identical total returns. The AI wasn't predicting price—it was predicting when the edge was strongest and sizing accordingly.
2. Execution Optimization
This is where prop shops and hedge funds actually deploy ML. Not for signals—for getting better fills.
What ML handles:
Predicting optimal order slicing (VWAP vs. TWAP vs. aggressive IOC)
Detecting liquidity windows in crypto markets (when to place limit orders vs. market orders)
Minimizing slippage on larger positions
Predicting short-term volatility spikes that would hurt execution
Practical example: A simple gradient boosting model analyzing order book depth, bid-ask spread, and recent volume patterns can save 5-15 basis points per trade. On a $100K position, that's $50-150 saved per execution. Over 1,000 trades per year? That's $50K-150K in improved performance.
3. Regime Detection & Strategy Allocation
Stop trying to predict the next candle. Instead, predict the type of market environment you're in.
Use unsupervised learning (K-means clustering, Hidden Markov Models, Gaussian Mixture Models) to identify:
High volatility vs. low volatility regimes
Trending vs. mean-reverting environments
Risk-on vs. risk-off sentiment periods
Correlation expansion/contraction across assets
Why this matters: A moving average crossover that prints money in trending markets will destroy your account in choppy, range-bound conditions. A mean reversion strategy that works beautifully in low volatility will get steamrolled during breakouts.
Implementation: Train an ensemble model on market features (volatility, correlation, volume patterns, momentum indicators). When it detects Regime A, allocate to Strategy Set 1. When it detects Regime B, switch to Strategy Set 2. When confidence is low, reduce exposure across the board.
4. Feature Engineering & Dynamic Signal Weighting
You have 50 technical indicators on your chart. Which ones actually matter right now ?
This changes constantly:
RSI works until the market trends hard, then it's a disaster
Volume patterns matter way more in crypto than traditional equities
Correlation indicators are useless until suddenly they're everything (crisis periods)
Different lookback periods perform differently across volatility regimes
ML solution: Use ensemble methods (Random Forests, XGBoost) to dynamically weight and combine signals based on recent regime and performance.
Instead of: "Buy when RSI < 30"
You get: "Buy when the ensemble model says momentum + volume + volatility features align, weighted by recent regime performance"
Client example: Combined 12 traditional strategies (each with proven edge) with an ML meta-strategy that allocated capital between them. The ML didn't find new edges—it figured out which existing edges to use when. Result: Sharpe ratio improved from 1.1 to 1.7 over 3 years live.
━━━━━━━━━━━━━━━━━━━━━━
The Hybrid Approach That Actually Works
After building systems that survive real markets (not just backtests), here's the architecture that works:
Layer 1 - Core Signals (Traditional Quant):
Mean reversion strategies based on statistical patterns
Momentum breakout systems with volume confirmation
Arbitrage opportunities and structural edges
These are your "alpha generators" with proven statistical edge
Layer 2 - AI Risk Management:
Reinforcement learning for dynamic position sizing
ML models for stop-loss placement and profit-taking
Volatility prediction for exposure adjustment
Layer 3 - AI Strategy Allocation:
Regime detection to switch between strategy sets
Performance-based weighting of different approaches
Correlation analysis for portfolio construction
Layer 4 - AI Execution:
Order optimization based on current liquidity
Slippage prediction and mitigation
Timing of trade execution within the day
Real system I deployed for a crypto client:
Core: 8 different mean reversion + momentum strategies (all traditionally backtested)
AI Layer: Reinforcement learning for position sizing based on volatility regime
ML Layer: Random forest classifier for regime detection (trending vs. ranging vs. high volatility)
Execution: Gradient boosting model for order placement timing
Result: Sharpe ratio improved from 1.2 to 1.8 over 3 years of live trading, max drawdown reduced by 31%
The AI didn't find magic price prediction patterns. It made better decisions about when to trade , how much to risk , and how to execute .
━━━━━━━━━━━━━━━━━━━━━━
What You Should Actually Build
If you're serious about AI in trading, here's my recommendation:
Start here (High ROI, Lower Difficulty):
Build a regime detection system first
Create position sizing rules that adapt to volatility
Optimize your execution (especially in crypto)
Test strategy allocation across different market conditions
Only then consider (High Difficulty, Questionable ROI):
Pure price prediction models
Red flags to avoid:
Any model with >90% backtest accuracy (probably overfit)
Systems that don't account for transaction costs and slippage
Strategies that haven't been walk-forward tested
Anything that can't explain why it should work
━━━━━━━━━━━━━━━━━━━━━━
The Bottom Line
If someone's selling you an AI system that "predicts market direction with 95% accuracy," run away. That's either overfitted garbage or a scam.
If someone's using AI to dynamically manage risk, optimize execution, detect regime changes, and intelligently allocate between proven strategies? That's actually how professionals use it.
The unsexy truth: The best use of AI in trading isn't prediction—it's decision-making around the edges that already exist.
Stop chasing the signal generation hype. Start thinking about the full trading pipeline. That's where the real alpha is hiding.
━━━━━━━━━━━━━━━━━━━━━━
💬 Question for the community: Are you using AI for signal generation or operational optimization? What's been your experience?
🔔 Follow for more quant reality checks—no hype, just data and systems that work in production
📩 Building systematic strategies that need to survive real markets? I specialize in risk-aware ML systems, hybrid quant approaches, and turning backtests into production-ready code. DM me to discuss your project.
━━━━━━━━━━━━━━━━━━━━━━

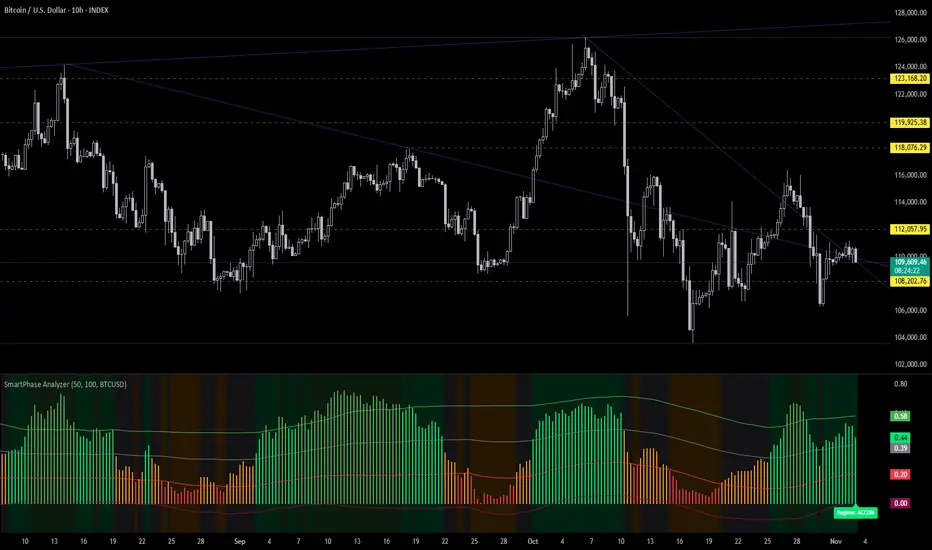
Temporal Drift Alpha | Rotating Volatility | Hidden Rhythm🧠 Deep Dive: Hidden Alpha in Odd Intraday Charts
Been experimenting lately with non-standard intraday timeframes on TradingView — specifically the 10-hour chart — and it’s producing some really interesting results.
My 1D strategies only needed minor calibration to fit intraday conditions (mainly risk and signal sensitivity tweaks), but once adjusted, they started performing significantly better on 10H than on standard 4H / 12H / 1D setups.
Here’s why I think it’s happening 👇
⚙️ 1. Uneven time alignment = session drift
10H doesn’t divide evenly into 24H, so candle start times rotate across the global trading cycle (Asia → London → NY).
That means each bar is pulling from a different combination of regional liquidity and volatility windows — you’re not seeing the same “slice” of the day over and over.
- 06:00 → overlaps Asia close + London open
- 16:00 → overlaps US open
- 20:00 → catches late NY + early Asia handoff
This rotation keeps repeating every couple of days, giving you asynchronous snapshots of how the market behaves between sessions — and that’s where inefficiencies tend to hide.
📊 2. Structural alpha exposure
By breaking away from the standard 8H / 12H / 1D alignment, you end up:
- Capturing transition volatility (session overlaps)
- Avoiding compressed daily smoothing
- Getting more responsive structure shifts for trend/momentum setups
It’s basically giving you a rotating volatility lens. You’re still seeing the full picture, but through different angles each cycle.
🧩 3. Strategy behavior differences
On the 10H:
- Momentum filters trigger cleaner — fewer false breaks
- Mean reversion signals reset faster after exhaustion
- BB, RSI, EMA-type systems react smoother, since the noise from hard session resets (like 00:00 UTC) is reduced
I’m seeing way fewer “dead zones” between signals — and overall smoother PnL curves, even with identical logic.
📈 4. Practical takeaway
Odd-hour timeframes like 10H act like a “rotating frame sampler” for the market.
They shift through liquidity regimes automatically — giving you a natural form of temporal diversification.
If your 1D systems are solid but a bit laggy or overly smoothed, try re-anchoring them on 10H, 14H, or 22H and recalibrating your risk and confirmation filters slightly.
There’s legit structural alpha buried in how these bars cut across the global cycle.
🧠 TL;DR
10H charts = not random noise.
They’re asynchronous time slices that expose unbalanced session transitions — something most backtests miss.
I’ll be running deeper tests on return bias and volatility clustering per candle start hour (06:00, 16:00, 20:00, etc.), but early signs point to repeatable behavior .
This could be one of those tiny structural edges that compounds over time.
Sometimes alpha isn’t in new indicators — it’s in how we slice time. ⏳⚡️
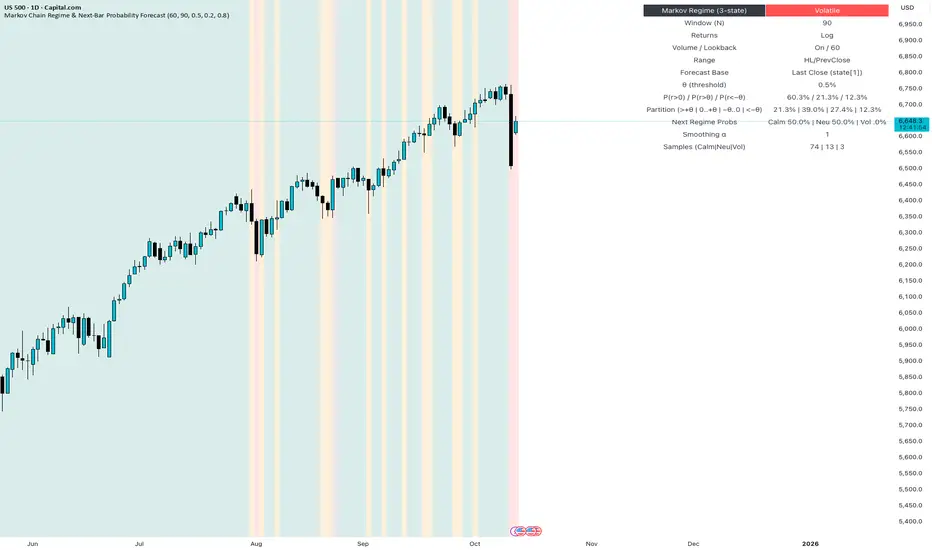
HOW-TO: Forecast Next-Bar Odds with Markov ProbCast🎯 Goal
In 5 minutes, you’ll add Markov ProbCast to a chart, calibrate the “big-move” threshold θ for your instrument/timeframe, and learn how to read the next-bar probabilities and regime signals
(🟩 Calm | 🟧 Neutral | 🟥 Volatile).
🧩 Add & basic setup
Open any chart and timeframe you trade.
Add Markov ProbCast — P(next-bar) Forecast Panel from the Public Library (search “Markov ProbCast”).
Inputs (recommended starting point):
• Returns: Log
• Include Volume (z-score): On (Lookback = 60)
• Include Range (HL/PrevClose): On
• Rolling window N (transitions): 90
• θ as percent: start at 0.5% (we’ll calibrate next)
• Freeze forecast at last close: On (stable readings)
• Display: leave plots/partition/samples On
📏 Calibrate θ (2-minute method)
Pick θ so the “>+θ” bucket truly flags meaningful bars for your market & timeframe. Try:
• If intraday majors / large caps: θ ≈ 0.2%–0.6% on 1–5m; 0.3%–0.8% on 15–60m.
• If high-vol crypto / small caps: θ ≈ 0.5%–1.5% on 1–5m; 0.8%–2.0% on 15–60m.
Then watch the Partition row for a day: if the “>+θ” bucket is almost never triggered, lower θ a bit; if it’s firing constantly, raise θ. Aim so “>+θ” captures move sizes you actually care about.
📖 Read the panel (what the numbers mean)
• P(next r > 0) : Directional tilt for the very next candle.
• P(next r > +θ) : Odds of a “big” upside move beyond your θ.
• P(next r < −θ) : Odds of a “big” downside move.
• Partition (>+θ | 0..+θ | −θ..0 | <−θ): Four buckets that ≈ sum to 100%.
• Next Regime Probs : Chance the market flips to 🟩 Calm / 🟧 Neutral / 🟥 Volatile next bar.
• Samples : How many historical next-bar examples fed each next-state estimate (confidence cue).
Note: Heavy calculations update on confirmed bars; with “Freeze” on, values won’t flicker intrabar.
📚 Two practical playbooks
Breakout prep
• Watch P(next r > +θ) trending up and staying elevated (e.g., > 25–35%).
• A rising Next Regime: Volatile probability supports expansion context.
• Combine with your trigger (structure break, session open, liquidity sweep).
Mean-reversion defense
• If already long and P(next r < −θ) lifts while Volatile odds rise, consider trimming size, widening stops, or waiting for a better setup.
• Mirror the logic for shorts when P(next r > +θ) lifts.
⚙️ Tuning & tips
• N=90 balances adaptivity and stability. For very fast regimes, try 60; for slower instruments, 120.
• Keep Freeze at close on for cleaner alerts/decisions.
• If Samples are small and values look jumpy, give it time (more bars) or increase N slightly.
🧠 Why this works (the math, briefly)
We learn a 3-state regime and its transition matrix A (A = P(Sₜ₊₁=j | Sₜ=i)), estimate next-bar event odds conditioned on the next state (e.g., q_gt(j)=P(rₜ₊₁>+θ | Sₜ₊₁=j)), then forecast by mixing:
P(event) = Σⱼ A · q(event | next=j).
Laplace/Beta smoothing, per-state sample gating, and unconditional fallbacks keep estimates robust.
❓FAQ
• Why do probabilities change across instruments/timeframes? Different volatility structure → different transitions and conditional odds.
• Why do I sometimes see “…” or NA? Not enough recent samples for a next-state; the tool falls back until data accumulate.
• Can I use it standalone? It’s a context/forecast panel—pair it with your entry/exit rules and risk management.
📣 Want more?
If you’d like an edition with alerts , σ-based θ, quantile regime cutoffs, and a compact ribbon—or a full strategy that uses these probabilities for entries, filters, and sizing—please Like this post and comment “Pro” or “Strategy”. Your feedback decides what we release next.
Stop Guessing Risk — Start Measuring It Like a QuantStop deciding risk based on emotion or setup. Do what quants do. Measure volatility and let it define your risk.
Most traders size positions emotionally:
• "This setup looks strong, I’ll double size."
• "I’m not sure, so I’ll go small."
→ Both are inconsistent and lead to unstable performance.
Professionals and systematic traders use a simple principle:
Risk is not a feeling, it’s a function of volatility.
⚙️ The concept
Markets breathe in volatility cycles. When volatility expands, risk should contract.
When volatility contracts, risk can expand.
Your position size should adapt automatically to those cycles.
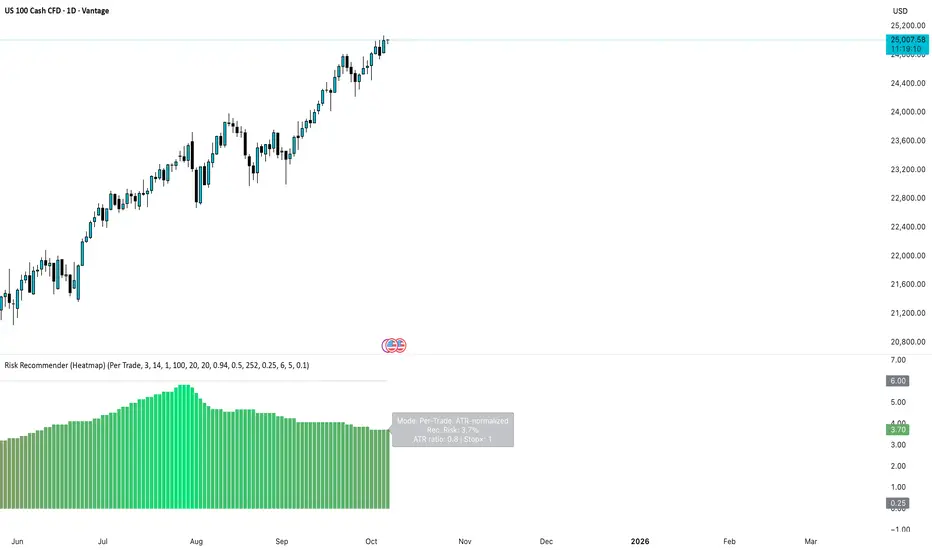
This Idea demonstrates the logic behind the new 📊 Risk Recommender — (Heatmap) indicator, a tool that quantifies how much of your equity to risk at any time.
🧮 How it works
The indicator offers two complementary modes:
1️⃣ Per-Trade (ATR-based)
• Compares current volatility (ATR) to a long-term baseline.
• When market noise increases, it suggests smaller risk per trade.
• When conditions are quiet, it recommends scaling up—within your own floor and ceiling limits.
2️⃣ Annualized (Volatility Targeting)
• Computes realized and forecast volatility (EWMA-style).
• Adjusts your base risk so your overall exposure stays near a target annualized volatility (e.g., 20%).
• The same math used in institutional risk models and CTA frameworks.
🎨 Visual interpretation
The heatmap column acts as a “risk thermometer”:
• 🟥 Red = High volatility → scale down
• 🟩 Green = Low volatility → scale up
• Smoothed and bounded between your chosen floor and ceiling risk levels.
• The label shows current mode, recommended risk %, and volatility context.
💡 Why this matters
Risk should *never* depend on how confident you feel about a trade.
It should depend on how loud or quiet the market is.
Volatility is the market’s volume knob and this indicator helps you tune your exposure to the same frequency.
📈 Example use case
• NASDAQ volatility spikes → recommended risk drops from 3.0% → 1.2%
• SPX volatility compresses → risk rises gradually → 4.5%
You stay consistent while others overreact.
🚀 Automating it
My invite-only strategy applies this logic automatically to manage exposure in real time.
Combine it with the Risk Recommender indicator for full transparency and adaptive position sizing.
🎯 Summary
✅ Stop guessing risk size.
✅ Let volatility guide you.
✅ Keep risk constant, results consistent.
That’s how quants survive. That’s how traders evolve.
#RiskManagement #Volatility #ATR #PositionSizing #Quant #TradingStrategy #AlgorithmicTrading #SystematicTrading #Portfolio #EWMA #RiskControl
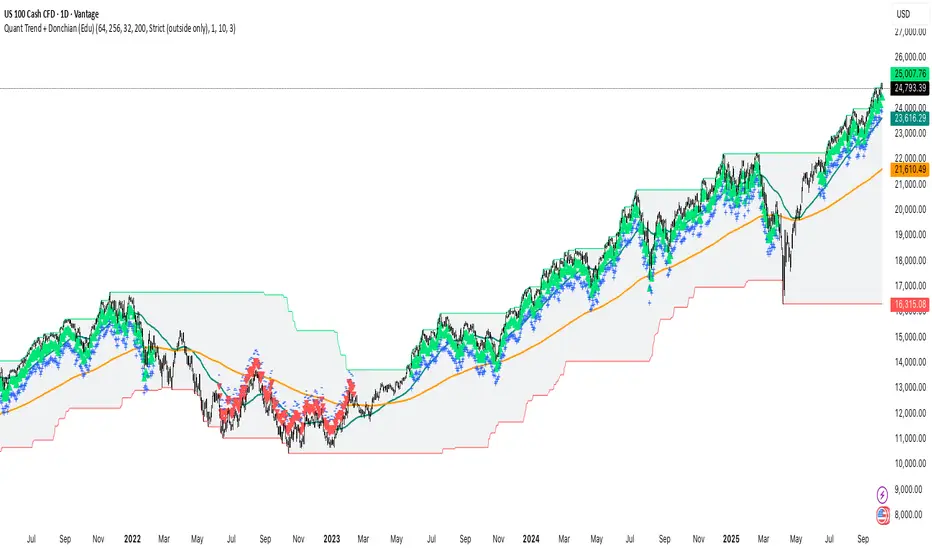
Trend-Following + Donchian Breakout (Regime Visualizer)Most traders chase trends too late or exit too early.
Quant systems don’t predict — they measure and adapt.
This educational chart uses the public Quant Trend + Donchian indicator to visualize how trend-following and breakout logic can define market regimes in NASDAQ 100 & S&P 500.
⚙️ Core Logic
• Trend — EMA(64 vs 256): approximates EWMAC trend state.
• Breakout — Donchian (200): identifies volatility-based range breaks.
• Volatility awareness — internally normalized to adjust behavior across markets.
📊 How to read it
• EMA fast > EMA slow and price near Donchian high → bullish trend regime.
• EMA fast < EMA slow and price near Donchian low → bearish regime.
• Inside channel with EMAs tangled → range or noise.
💡 Key insight
Regime definition + volatility scaling > entry cleverness.
Systems survive not by prediction, but by risk-controlled persistence .
This public view illustrates the foundations used in my more advanced risk-scaled quant strategies for NASDAQ and S&P indices.
#Quant #TrendFollowing #Breakout #Donchian #EMA #NASDAQ #SP500 #SystematicTrading #AlgorithmicTrading #Volatility
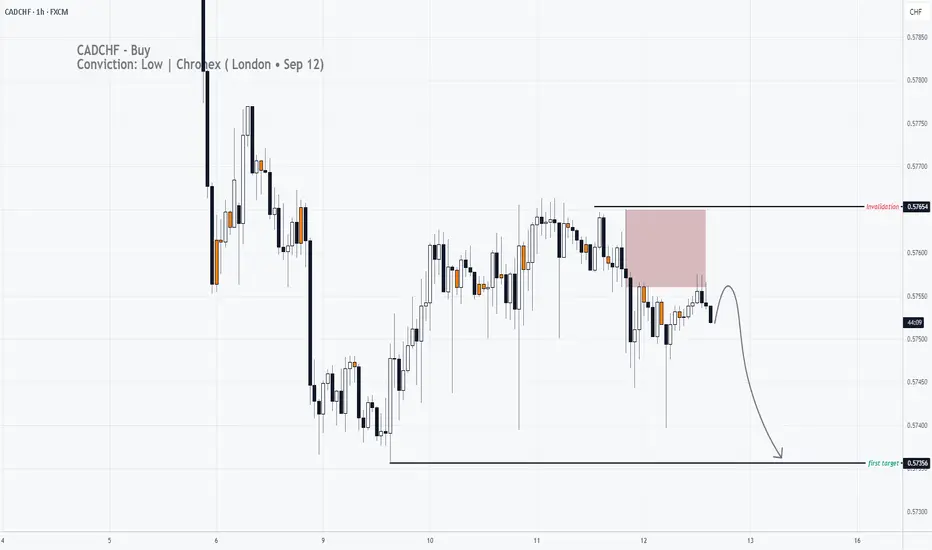
CADCHF - Short - Conviction: Low | Chronex (London • Sep 12)Hello Guys! Overall trend from all timeframe is Downtrend, sellers are in control. We are now on pretty good supply zone
Risks
1. Do we have economic high impact news release? No
2. Any higher-timeframe counter-trend zones? No
3. Has better zone above/below? None
USDCAD - LONG - Conviction: Medium | Chronex ( London • Sep 10 )Hello Guys!
🎯 90 % mechanical | Just your entry model
No trend-line art, no gut calls. Just a repeatable institutional process delivered every day at London Open
Context:
🧠 What Chronex does (bird’s-eye view)
- Scans all 28 major FX pairs every session.
- Ranks each currency’s relative strength / weakness from multi-TF data.
- Pairs strongest vs. weakest to create a tight outlook list.
- Adds built-in risk filters → posts one clean table: *Direction · Conviction · Entry zone · SL*.
📍 Today’s Playbook:
Risks
1. Do we have economic high impact news release?
2. Any higher-timeframe counter-trend zones?
3. Has better zone above/below?
Verdict:
💬 Drop questions, challenge the outlook, or share your own setups below!

EUR/CAD: Quant-Verified ReversalThe fundamental catalyst has been triggered. The anticipated strong Canadian CPI data was released as expected, confirming the primary driver for this trade thesis. Now, the focus shifts to the technical structure, where price is showing clear exhaustion at a generational resistance wall. 🧱
Our core thesis is that the confirmed fundamental strength of the CAD will now fuel the technically-indicated bearish reversal from this critical price ceiling.
The Data-Driven Case 📊
This trade is supported by a confluence of technical, fundamental, and quantitative data points.
Primary Technical Structure: The pair is being aggressively rejected from a multi-year resistance zone (1.6000 - 1.6100). This price action is supported by a clear bearish divergence on the 4H chart's Relative Strength Index (RSI), a classic signal that indicates buying momentum is fading despite higher prices.
Internal Momentum Models: Our internal trend and momentum models have flagged a definitive bearish shift. Specifically, the MACD indicator has crossed below its signal line into negative territory, confirming that short-term momentum is now bearish. This is layered with a crossover in our moving average module, where the short-term SMA has fallen below the long-term SMA, indicating the prevailing trend structure is now downward.
Quantitative Probability & Volatility Analysis: To quantify the potential outcome of this setup, we ran a Monte Carlo simulation projecting several thousand potential price paths. The simulation returned a 79.13% probability of the trade reaching our Take Profit target before hitting the Stop Loss. Furthermore, our GARCH volatility model forecasts that the expected price fluctuations are well-contained within our defined risk parameters, reinforcing the asymmetric risk-reward profile of this trade.
The Execution Plan ✅
Based on the synthesis of all data, here is the actionable trade plan:
📉 Trade: Sell (Short) EUR/CAD
👉 Entry: 1.6030
⛔️ Stop Loss: 1.6125
🎯 Take Profit: 1.5850
The data has spoken, and the setup is active. Trade with discipline.

QNT FOR THE WIN!Looking at QNT if youve been following me on another platform under the same name. Youll see we have timed these perfectly. we entered QNT at around $75 sold at $123 the flase breakout/ war and had the rejection right back down to the .618 fib retracement. Once we held beautiful support at the downward trendline, around $90 we had an immediete push up. We wait to see what bitcoin does. If it consolidates or pushed upward we could see QNT push back up to $123 and beyond (currently at the .618 fib retracement).
If bitcoin gets rejected, we may see a small pullback but i cant imagine back down past $90 again. NOT FINANCIAL ADVICE.
Goodluck and have fun with it.

#QNTUSDT #4h (Bitget Futures) Bull flag near breakoutQuant regained 50MA support after breaking out of the falling wedge, bullish continuation seems likely.
⚡️⚡️ #QNT/USDT ⚡️⚡️
Exchanges: Bitget Futures
Signal Type: Regular (Long)
Leverage: Isolated (6.0X)
Amount: 4.6%
Current Price:
100.30
Entry Zone:
99.22 - 96.92
Take-Profit Targets:
1) 106.59
2) 112.99
3) 120.11
Stop Targets:
1) 90.95
Published By: @Zblaba
GETTEX:QNT BITGET:QNTUSDT.P #4h #Quant #RWA quant.network
Risk/Reward= 1:1.2 | 1:2.1 | 1:3.1
Expected Profit= +52.1% | +91.3% | +134.8%
Possible Loss= -43.6%
Estimated Gaintime= 1-2 weeks

USDJPY is ready to go down to 143.834USDJPY is ready to follow my strategy and is already going down to 143.834

QNT BreakoutTraders,
As you can see from the BINANCE:QNTBTC pairing, that QNT looks to be ready to breakout.
As well as on the CRYPTO:QNTUSD Chart on the right hand side, we are about to see a breakout of this trend pattern which looks to be a Symmetrical Triangle. We have many other indications that this market is soon to start moving on some of these top alt coins.
This is a simple chart posted to show areas of interest when QNT moves forward toward price discovery. It is very possible to see the final target depicted on the chart on the right by the end of this alt coin season that we firmly believe started last month. Meaning we saw the bottom of the markets for the alt coins that are looking ready to start moving within the next 6-8 weeks.
Stay profitable folks,
Savvy

TradeCityPro | QNT: Range Top Test in RWA Uptrend Structure👋 Welcome to TradeCity Pro!
In this analysis, I’m going to review the QNT coin — one of the RWA projects currently ranked 71 on CoinMarketCap with a market cap of $1.19 billion.
⏳ 4-Hour Timeframe
As you can see, there’s a clear uptrend along with a trendline that has pushed the price up to the 100.7 level.
💥 At the moment, the price has formed a range box between 93.1 and 100.7, with multiple touches on both ends. Currently, the price is testing the top of this range at 100.7 once again.
🔍 If the 100.7 resistance is broken, we can consider entering a long position. This trigger is valid for a long, and if confirmed, the price could potentially move toward the next target at 121.8.
✨ For a short position, we first need to see the trendline break and the 93.1 level get triggered. That would serve as our first confirmation of a possible trend reversal.
📉 A breakdown below the 50 level on the RSI would be the first momentum-based sign of this reversal. If selling volume also increases at the same time, we’ll have confirmation of a volume divergence.
⚡️ On the other hand, a break of the trendline itself might act as an early trigger, but I personally wouldn’t open a position on that alone — it’s too risky. As long as the price holds above 93.1, the overall uptrend remains intact.
📝 Final Thoughts
This analysis reflects our opinions and is not financial advice.
Share your thoughts in the comments, and don’t forget to share this analysis with your friends! ❤️

QNT - The Bulls are Leading!Hello TradingView Family / Fellow Traders. This is Richard, also known as theSignalyst.
📈After breaking above the last major high marked in red, QNT has been overall bullish trading within the rising wedge pattern marked in blue.
Moreover, the green zone is a strong demand and structure.
🏹 Thus, the highlighted blue circle is a strong area to look for buy setups as it is the intersection of structure and lower blue trendline acting non-horizontal support.
📚 As per my trading style:
As #QNT retests the blue circle zone, I will be looking for bullish reversal setups (like a double bottom pattern, trendline break , and so on...)
📚 Always follow your trading plan regarding entry, risk management, and trade management.
Good luck!
All Strategies Are Good; If Managed Properly!
~Rich

Quant's 2025 All-Time High Potential Revealed In This AnalysisQuant has been producing higher lows since June 2022, a solid base.
QNTUSDT is about to close its fourth week green and this week is a full green candle. A strong advance/bullish breakout and months of bearish action recovered to now trade within the bullish zone.
What is happening here is the same dynamic that will be happening across all the Altcoins. After a major low on 7-April we get growth, growth, growth. Allow for small swings because the market never moves straight down nor straight up, it fluctuates creating waves.
Down-waves, up-waves but something is certain, higher highs and higher lows long-term. We are now within a strong bullish phase.
The high in December 2024 produced the highest prices since October 2022 and was corrected to a long-term higher low. A higher high will happen next comes next and this is the beginning of this higher high. The easy target being $211 and this is a higher high but for this higher high to be technically relevant it has to go even higher so we are aiming for $230 or higher, $310.
Will Quant go beyond $310? It is possible and do-able, also highly probable. The $410 target is a strong target but can be done. Can I be honest with you? It is possible that Quant moves even higher producing a new All-Time High by the time the 2025 bull market runs its course.
Find more details on the chart.
Namaste.

NVDIA Death Cross Quant Perspectives (Light Case Study)NASDAQ: Nvidia (NVDA ) has recently experienced an uptrend after a death cross formed consisting of the 65 and 200 EMAs on the 1 Day chart.
If we analyze back on Nvidia starting in 1999 , we can count a total of 10 death crosses that have occurred, and 9 have been immediately followed by downtrends. Although a single death cross did not have an immediate downtrend, shortly after this event (approx. 282 days) another death cross formed and price then fell roughly twice as it historically has , almost appearing to make up for the missed signal.
From a quantitative perspective:
If we calculate the raw historical success rate using:
Raw Success Rate = 9/10 = 90
With this calculation the observed success of 65/200 EMA death crosses correlating to an immediate downtrend is 90%
In order to avoid overconfidence we can apply Laplace smoothing using:
Smoothed Probability = 9+1/10+2 = 10/12 or 0.8333
With this calculation the observed success of 65/200 EMA death crosses correlating to an immediate downtrend is 83%
Given the results of the data I personally feel that there is a Very High (83%) chance this death cross that recently formed on the 1 Day chart (around 04/16/2025) will immediately lead to a downtrend. And a Low (17%) chance it does not. Furthermore these results support a technical analysis hypothesis that I formed prior.
Many different systemic factors can contribute to the market movement, but mathematics sometimes leave subtle clues. Will the market become bearish? Or will Nvidia gain renewed bullish interest?
Disclaimer: Not Financial Advice.

QNT is breaking out of the descending wedge upper trend line.QNT is now starting to trade outside the upper trendline of the descending wedge and is likely to make an attempt to move toward the equilibrium zone—or close to it.
This will be interesting to watch.
Good luck, and always use a stop-loss!

The Bullish Case of QNT#Quant had a massive bull run in 2020–2021, followed by a 3-year correction likely forming a major wave (4) triangle.
If the pattern holds, a bullish continuation could target the MIL:1K level
Breaking $55 is the stop-loss; passing $170 confirms The Bullish Case of #QNT.

Behind the Buy&Sell Strategy: What It Is and How It WorksWhat is a Buy&Sell Strategy?
A Buy&Sell trading strategy involves buying and selling financial instruments with the goal of profiting from short- or medium-term price fluctuations. Traders who adopt this strategy typically take long positions, aiming for upward profit opportunities. This strategy involves opening only one trade at a time, unlike more complex strategies that may use multiple orders, hedging, or simultaneous long and short positions. Its management is simple, making it suitable for less experienced traders or those who prefer a more controlled approach.
Typical Structure of a Buy&Sell Strategy
A Buy&Sell strategy consists of two key elements:
1) Entry Condition
Entry conditions can be single or multiple, involving the use of one or more technical indicators such as RSI, SMA, EMA, Stochastic, Supertrend, etc.
Classic examples include:
Moving average crossover
Resistance breakout
Entry on RSI oversold conditions
Bullish MACD crossover
Retracement to the 50% or 61.8% Fibonacci levels
Candlestick pattern signals
2) Exit Condition
The most common exit management methods for a long trade in a Buy&Sell strategy fall into three categories:
Take Profit & Stop Loss
Exit based on opposite entry conditions
Percentage on equity
Practical Example of a Buy&Sell Strategy
Entry Condition: Bearish RSI crossover below the 30 level (RSI oversold entry).
Exit Conditions: Take profit, stop loss, or percentage-based exit on the opening price.
