How Market Fluctuations Shape the Global Economy1. Understanding Fluctuations in the Global Economy
Fluctuations refer to periodic or unpredictable changes in economic indicators such as GDP growth, employment levels, inflation, or market prices. These shifts can be short-term (cyclical), medium-term (structural), or long-term (systemic).
Types of Fluctuations:
Business Cycle Fluctuations:
These are natural phases of expansion, peak, contraction, and recovery in an economy. Every country experiences these cycles, though their duration and intensity vary.
Financial Market Fluctuations:
Driven by investor sentiment, interest rates, and corporate performance, these include stock market rallies and crashes that influence global wealth and investment.
Currency and Exchange Rate Fluctuations:
Changes in the value of one currency against another affect trade competitiveness, inflation, and cross-border investments.
Commodity Price Fluctuations:
Volatile prices of oil, gold, natural gas, and agricultural goods can create inflationary or deflationary pressures worldwide.
Geopolitical and Policy Fluctuations:
Political instability, trade wars, and monetary policy changes often disrupt global supply chains and financial flows.
These fluctuations are not random; they emerge from a complex interaction of economic fundamentals, investor behavior, and policy interventions.
2. Causes Behind Global Economic Fluctuations
Understanding why fluctuations occur is crucial to managing their impact. Several interrelated factors trigger these shifts:
Monetary and Fiscal Policy Changes:
Central banks influence liquidity through interest rates and quantitative easing. When interest rates are low, borrowing increases, spurring growth. However, tightening measures to control inflation can slow down the economy, causing cyclical fluctuations.
Global Supply and Demand Imbalances:
A mismatch between production and consumption—such as oversupply in commodities or chip shortages in technology—creates price volatility.
Technological Innovations:
Innovations can disrupt existing industries. For instance, the rise of renewable energy affects oil prices, while AI and automation reshape job markets.
Investor Psychology and Speculation:
Markets are heavily influenced by collective emotion—fear and greed. A surge in optimism can inflate asset bubbles, while panic can trigger sharp corrections.
Geopolitical Tensions and Conflicts:
Wars, sanctions, and trade barriers affect global trade routes and resource availability, leading to supply shocks and inflationary spikes.
Natural Disasters and Pandemics:
Events like COVID-19 illustrate how quickly global production, logistics, and consumption patterns can be disrupted, leading to large-scale fluctuations.
3. The Domino Effect: How Fluctuations Spread Globally
In today’s globalized economy, no country operates in isolation. Fluctuations in one economy can cascade through several channels:
Trade Linkages:
When demand drops in one major economy, exporters in others suffer. For instance, a slowdown in China can hurt commodity exporters like Brazil or Australia.
Financial Markets:
Global investors move capital rapidly between countries. A crisis in one market can trigger sell-offs across others, as seen during the 2008 financial crisis.
Currency Transmission:
Exchange rate volatility affects import-export competitiveness. A weakening yen, for example, can pressure South Korea’s exports.
Commodity Channels:
Oil price swings influence transportation costs, inflation rates, and household spending worldwide.
Sentiment and Confidence:
Even without direct exposure, economies can feel the psychological effects of global uncertainty, reducing investment and spending.
4. Impact on Different Sectors of the Global Economy
A. Trade and Manufacturing
Trade volumes fluctuate with changing demand and currency valuations. A strong dollar may make U.S. exports expensive, while a weaker rupee might boost India’s export competitiveness. Manufacturing sectors dependent on global supply chains—such as electronics or automobiles—are especially sensitive to such shifts.
B. Energy and Commodities
Oil and natural gas prices are key determinants of inflation and transportation costs. A sudden oil price surge can trigger global inflation, while a drop can hurt energy-exporting nations like Saudi Arabia or Russia.
C. Financial Markets
Stock indices mirror investor confidence. Bull markets encourage investment and innovation, while bear markets reduce liquidity and consumer spending. Fluctuations here affect everything from pension funds to venture capital.
D. Employment and Wages
During downturns, companies cut costs, leading to layoffs and wage stagnation. Conversely, economic expansions raise demand for labor, increasing incomes but sometimes fueling inflation.
E. Developing Economies
Emerging markets often bear the brunt of global volatility. Their currencies weaken faster, capital outflows rise, and inflation accelerates due to dependence on imported goods.
5. The Psychological and Social Ripple Effects
Economic fluctuations don’t just affect balance sheets—they shape social behavior and confidence. When stock markets fall, households feel poorer, spending less and saving more. Consumer pessimism can then deepen recessions.
Similarly, rising prices or unemployment can lead to political instability, protests, and shifts in leadership. Governments facing such pressures often turn to populist or protectionist measures, altering global policy landscapes.
The social cost of economic instability is immense—ranging from increased inequality to reduced access to education and healthcare in developing regions.
6. Case Studies: Major Global Fluctuations
A. The 2008 Financial Crisis
Triggered by the U.S. housing bubble, this crisis spread globally through financial markets. Banks collapsed, trade volumes shrank, and unemployment surged worldwide. It illustrated how interconnected the global economy had become and led to reforms in banking regulations and monetary policy coordination.
B. The COVID-19 Pandemic (2020–2021)
The sudden halt in production, transportation, and consumption caused one of the sharpest global recessions in history. Yet, it also accelerated digital transformation and remote work adoption—showing how fluctuations can drive structural change.
C. The Russia-Ukraine Conflict (2022–Present)
This geopolitical event caused major energy and food supply disruptions. The resulting surge in oil and grain prices led to inflationary pressures in both developed and developing nations.
D. Global Inflation Wave (2023–2024)
As economies recovered post-pandemic, demand outpaced supply. Central banks raised interest rates aggressively, leading to sharp corrections in equity and bond markets. This episode reminded policymakers of the delicate balance between growth and stability.
7. Policy and Institutional Responses
Governments and central banks play critical roles in mitigating the impact of fluctuations. Their responses can stabilize markets or, if misjudged, worsen volatility.
Monetary Policies:
Central banks use interest rate adjustments, bond purchases, and liquidity injections to influence credit availability and inflation.
Fiscal Policies:
Governments can increase public spending or reduce taxes to stimulate demand during downturns, or tighten budgets to cool overheated economies.
Regulatory Reforms:
Post-crisis regulations like Basel III enhanced global banking stability by improving liquidity and capital requirements.
International Cooperation:
Institutions like the IMF and World Bank provide financial aid and policy coordination to manage crises across borders.
Market Transparency and Digitalization:
Technologies like blockchain and AI now enhance real-time monitoring of global economic trends, reducing reaction delays.
8. Long-Term Effects: Evolution Through Fluctuation
Though painful in the short term, fluctuations often lead to long-term growth and innovation. Crises expose weaknesses in economic systems, prompting reforms and resilience-building.
For instance:
The 2008 crisis accelerated the move toward digital banking.
COVID-19 expanded e-commerce and remote working ecosystems.
Energy market disruptions are fueling investment in renewables.
Thus, fluctuations, while disruptive, serve as catalysts for modernization and adaptation.
9. Strategies to Navigate Global Fluctuations
For nations, corporations, and investors, adaptability is key.
Some strategic measures include:
Diversification:
Spreading investments across sectors and regions reduces exposure to single-market shocks.
Sustainable Development:
Economies focusing on renewable energy, digital infrastructure, and innovation withstand shocks better.
Prudent Monetary Management:
Maintaining healthy foreign reserves and debt levels allows flexibility during crises.
Data-Driven Decision-Making:
Using predictive analytics helps governments and businesses anticipate market turns.
Global Collaboration:
Shared crisis management mechanisms—like coordinated rate cuts or trade agreements—strengthen collective resilience.
Conclusion: Embracing the Waves of Change
Economic fluctuations are neither entirely avoidable nor entirely harmful. They are intrinsic to the global economic system—signaling transitions, correcting excesses, and driving innovation. The key lies in how the world responds to them.
Policymakers must balance growth with stability, corporations must plan for volatility, and investors must understand that uncertainty is the price of opportunity. The global economy, much like the ocean, will always have tides of expansion and contraction. Learning to navigate these waves—rather than resisting them—is the essence of sustainable progress.
In essence, fluctuations are not the enemies of the global economy—they are its rhythm, its pulse, and its path toward evolution.
RADUSDT

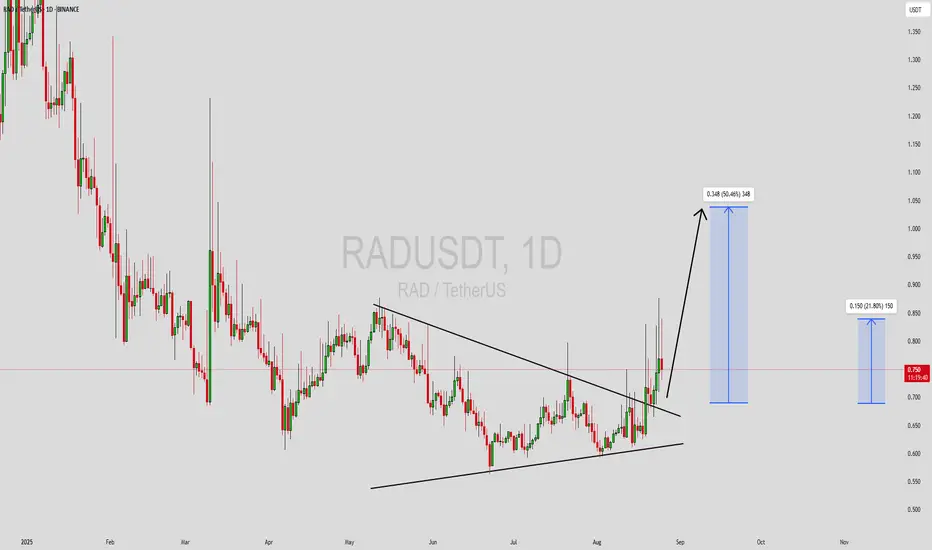
RADUSDT Forming Bullish ReversalRADUSDT is currently forming a strong technical setup that suggests a potential bullish move ahead. The chart reflects a narrowing price action that is setting the stage for a breakout. With good trading volume supporting the structure, this setup is gaining momentum and drawing increased attention from traders and investors. If confirmed, this move could deliver an upside potential of around 40% to 50% in the coming sessions.
The consolidation phase has allowed RADUSDT to build a strong base, which often precedes explosive moves. A breakout from this level could trigger fresh buying interest, as market participants look to capitalize on the upcoming trend shift. The volume pattern is in alignment with this bullish outlook, highlighting growing interest and participation.
Investor sentiment around this project has also been strengthening, which aligns with the technical indicators pointing toward a potential bullish reversal. With patience and careful entry timing, traders could position themselves for strong gains as RADUSDT gears up for a possible breakout rally.
✅ Show your support by hitting the like button and
✅ Leaving a comment below! (What is You opinion about this Coin)
Your feedback and engagement keep me inspired to share more insightful market analysis with you!

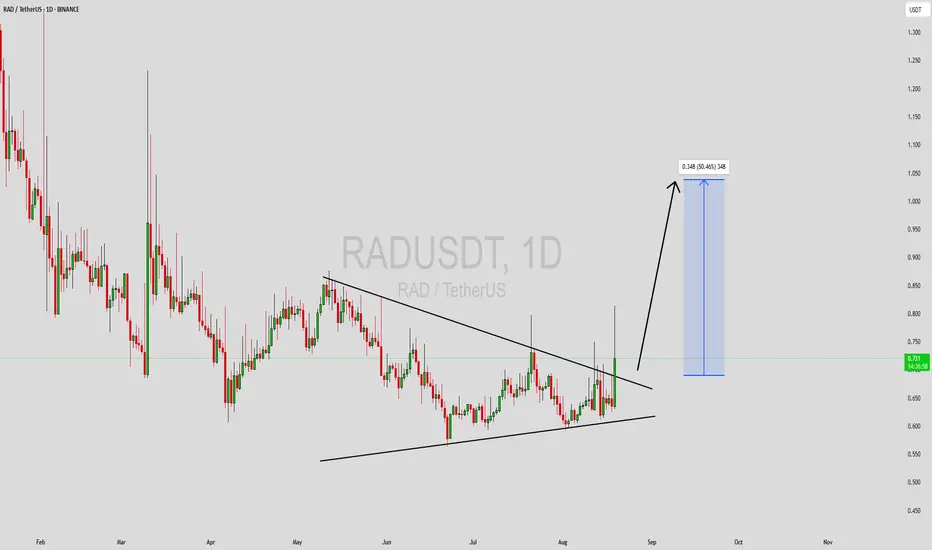
RADUSDT Forming Descending WedgeRADUSDT is currently forming a classic descending wedge pattern, a structure often recognized for its bullish reversal potential. This pattern indicates that while prices have been trending downward, the rate of decline has been slowing — often a sign that sellers are losing momentum and buyers are preparing to take control. A breakout above the upper trendline of the wedge could spark a strong upside move, especially with the supportive volume seen in recent trading sessions.
Volume levels are holding steady, suggesting accumulation within this compression zone. When paired with a descending wedge setup, this usually strengthens the case for an imminent breakout. Traders and investors closely watching this pair will likely treat a clean breakout as a signal to enter long positions, aiming for potential gains in the range of 40% to 50% based on the measured move technique from the wedge’s widest part.
The RAD project itself has been gaining visibility, which adds further strength to the technical breakout potential. With broader market recovery sentiment and increasing community support, RADUSDT could be setting up for a high-momentum rally. The confluence of price structure, volume, and investor interest makes this pair a standout candidate for bullish breakout setups on traders’ watchlists.
✅ Show your support by hitting the like button and
✅ Leaving a comment below! (What is You opinion about this Coin)
Your feedback and engagement keep me inspired to share more insightful market analysis with you!
Trading opportunity for RADUSDTBased on technical factors there is a Buy position in :
📊 RADUSDT
🔵 Buy Now
🪫Stop loss 1.260
🔋Target 1.490
📏 R/R 1.6
💸RISK : 1%
We hope it is profitable for you ❤️
Please support our activity with your likes👍 and comments📝

RADUSDT: %220 Daily Volume Spike – The Smartest Entry Revealed!RADUSDT is seeing a massive %220 daily volume spike , signaling an intense surge of activity. For those looking to capitalize on this momentum, the blue box zone represents the most rational and carefully chosen entry point.
Why This Matters:
The Blue Box Advantage: This zone has been meticulously selected using advanced tools like volume footprint, volume profile, cumulative delta volume (CDV), and liquidity heatmaps . It’s designed to pinpoint where buyers are likely to step in.
Confirmation Is Key: I will validate trades in the blue box using CDV, liquidity heatmaps, volume profiles, volume footprints (ensuring buyer presence), and upward market structure breaks in lower time frames .
Risk Management: While the opportunity is huge, the market still demands caution. Always maintain strict risk management rules.
Why Boost and Comment?
Your engagement motivates me to keep sharing such precise and actionable insights. If you find this analysis helpful, please don’t forget to boost and comment ! Let’s win together.
Want to Learn the Process?
I’m happy to teach anyone for free! DM me to learn how I use CDV, liquidity heatmaps, volume profiles, and volume footprints to find these high-probability zones.
If you think this analysis helps you, please don't forget to boost and comment on this. These motivate me to share more insights with you!
I keep my charts clean and simple because I believe clarity leads to better decisions.
My approach is built on years of experience and a solid track record. I don’t claim to know it all, but I’m confident in my ability to spot high-probability setups.
If you would like to learn how to use the heatmap, cumulative volume delta and volume footprint techniques that I use below to determine very accurate demand regions, you can send me a private message. I help anyone who wants it completely free of charge.
My Previous Analysis (the list is long but I think it's kinda good : )
🎯 ZENUSDT.P: Patience & Profitability | %230 Reaction from the Sniper Entry
🐶 DOGEUSDT.P: Next Move
🎨 RENDERUSDT.P: Opportunity of the Month
💎 ETHUSDT.P: Where to Retrace
🟢 BNBUSDT.P: Potential Surge
📊 BTC Dominance: Reaction Zone
🌊 WAVESUSDT.P: Demand Zone Potential
🟣 UNIUSDT.P: Long-Term Trade
🔵 XRPUSDT.P: Entry Zones
🔗 LINKUSDT.P: Follow The River
📈 BTCUSDT.P: Two Key Demand Zones
🟩 POLUSDT: Bullish Momentum
🌟 PENDLEUSDT.P: Where Opportunity Meets Precision
🔥 BTCUSDT.P: Liquidation of Highly Leveraged Longs
🌊 SOLUSDT.P: SOL's Dip - Your Opportunity
🐸 1000PEPEUSDT.P: Prime Bounce Zone Unlocked
🚀 ETHUSDT.P: Set to Explode - Don't Miss This Game Changer
🤖 IQUSDT: Smart Plan
⚡️ PONDUSDT: A Trade Not Taken Is Better Than a Losing One
💼 STMXUSDT: 2 Buying Areas
🐢 TURBOUSDT: Buy Zones and Buyer Presence
🌍 ICPUSDT.P: Massive Upside Potential | Check the Trade Update For Seeing Results
🟠 IDEXUSDT: Spot Buy Area | %26 Profit if You Trade with MSB
📌 USUALUSDT: Buyers Are Active + %70 Profit in Total
🌟 FORTHUSDT: Sniper Entry +%26 Reaction
🐳 QKCUSDT: Sniper Entry +%57 Reaction
📊 BTC.D: Retest of Key Area Highly Likely
I stopped adding to the list because it's kinda tiring to add 5-10 charts in every move but you can check my profile and see that it goes on..

RAD Pump to 2.4XX $ is about to happen after break 1.8XX $ Area Radicle (RAD) has recently experienced a significant price surge, but it's important to be cautious about its future direction.
Key Technical Analysis:
* Fakeout: to 2.4XX is more likely to happen
* Potential Correction: A deeper correction towards the $1.6 or $1.5 support levels is possible.
Remember:
* Do Your Own Research: Always conduct thorough research before making any investment decisions.
* Risk Management: Use stop-loss orders to protect your investments from potential losses.
* Diversification: Spread your investments across different assets to reduce risk.
Stay tuned for more updates on Radicle and other cryptocurrencies!
Disclaimer: This is not financial advice. Please do your own research before making any investment decisions.
TRY TO HAVE AN ADVENTAGE FROM FAKEOUT PUMPS AND TRADE THE RANGE UNTIL IT BREAKS

RAD to FLIP 1.3 to Support Will open Doors to 1.8Radicle (RAD) has recently experienced a significant price surge, but it's important to be cautious about its future direction.
Key Technical Analysis:
* Fakeout: The recent pump above the $1.53 level could be considered a fakeout, as the price has since retraced to the $1.3 support level.
* Potential Correction: A deeper correction towards the $1.20 or $1.00 support levels is possible.
Remember:
* Do Your Own Research: Always conduct thorough research before making any investment decisions.
* Risk Management: Use stop-loss orders to protect your investments from potential losses.
* Diversification: Spread your investments across different assets to reduce risk.
Stay tuned for more updates on Radicle and other cryptocurrencies!
Disclaimer: This is not financial advice. Please do your own research before making any investment decisions.
TRY TO HAVE AN ADVENTAGE FROM FAKEOUT PUMPS AND TRADE THE RANGE UNTIL IT BREAKS

RAD/USDT: Eyeing a Potential Breakout Above Trendline Resistance RAD/USDT: Eyeing a Potential Breakout Above Trendline Resistance
RAD/USDT is showing strong potential for a breakout 🚀 as it approaches a key trendline resistance on the chart 📉➡️📈. The price action is consolidating within a narrowing range, hinting at a potential explosive move 💥. If a breakout occurs, it could trigger a solid bullish run 📊. Traders should watch closely 👀 for confirmation signals before making any decisions.
Key observations:
1. Trendline resistance: RAD/USDT is testing a well-defined downward trendline. Multiple rejections at this level make it a critical zone to monitor.
2. Volume dynamics: A spike in trading volume during a breakout would confirm strong buyer interest 📈.
3. Bullish momentum: Indicators such as RSI and MACD are currently signaling improving momentum ⚡, which aligns with the potential breakout narrative.
Tips for confirming a breakout:
- Candle close above resistance: Wait for a 4H or daily candle to close convincingly above the trendline resistance 🔑.
- Increased volume: A significant rise in volume during the breakout indicates strong participation by buyers 📊.
- Retest of broken resistance: A retest of the trendline as support post-breakout strengthens the validity of the move 🔄.
- Avoid false breakouts: Monitor for wicks or quick reversals above the resistance, which may indicate a trap ⚠️.
Potential targets (if breakout is successful):
- Immediate resistance:
- Next resistance:
Risk management:
- Always use stop-loss orders to protect your capital 🛡️.
- Position sizing should align with your risk tolerance 🎯.
This analysis is for informational purposes only. It is not financial advice. Always do your own research (DYOR) 🔍 before making any investment decisions.

RAD fake out Pump above 1.6 and then flip 1.4 to support RAD fake out Pump above 1.6 and then flip 1.4 to support its time now to have some liquidity

#RAD (SPOT) entry range ( 1.000- 1.110)T.(2.470) SL(0.990)BINANCE:RADUSDT
entry range ( 1.000- 1.110)
Target (2.470)
1 Extra Targets(optional) in chart, if you like to continue in the trade with making stoploss very high.
SL .1D close below (0.990)
Golden Advices.
**********************
* collect the coin slowly in the entry range.
* Please calculate your losses before the entry.
* Do not enter any trade you find it not suitable for you.
* No FOMO - No Rush , it is a long journey.
Useful Tags.
**********************
My total posts
( www.tradingview.com )
1Million Journey
( www.tradingview.com )
( www.tradingview.com )
********************************************************************************************************************** #Manta ,#OMNI, #DYM, #AI, #IO, #XAI , #ACE #NFP #RAD #WLD #ORDI #BLUR #SUI #Voxel #AEVO #VITE #APE #RDNT #FLUX #NMR #VANRY #TRB #HBAR #DGB #XEC #ERN #ALT #IO #ACA #HIVE #ASTR #ARDR #PIXEL #LTO #AERGO #SCRT #ATA #HOOK #FLOW #KSM #HFT #MINA #DATA #SC #JOE #RDNT #IQ #CFX #BICO #CTSI #KMD #FXS #DEGO #FORTH # AST #PORTAL #CYBER #RIF #ENJ #ZIL #APT #GALA #STEEM #ONE #LINK #NTRN #COTI #RENDER #ICX #IMX #ALICE #PYR #PORTAL #GRT #GMT # IDEX #NEAR #ICP #ETH #QTUM #VET #QNT #API3 #BURGER .

#RAD $RAD#RAD still have 100% profit before it goes anywhere
Check the trade with stop loss
BINANCE:RADUSDT

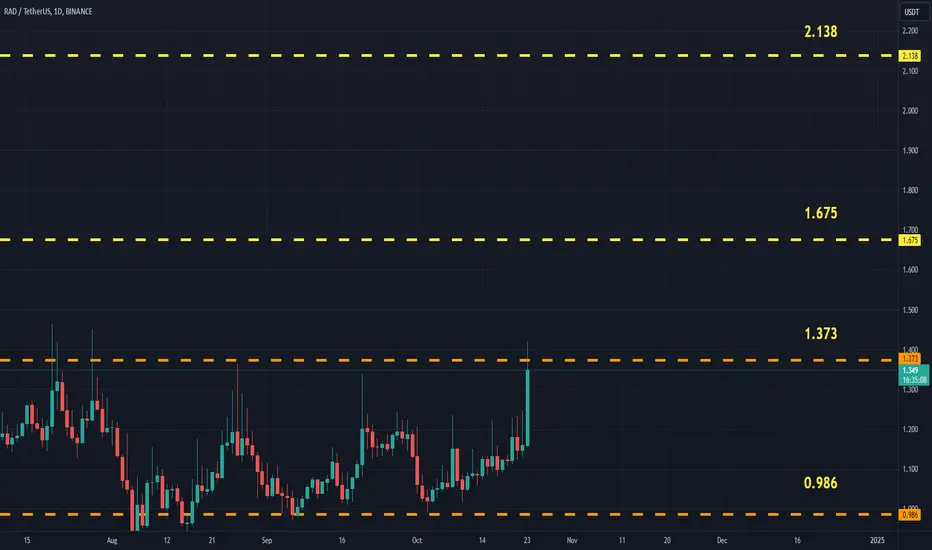
RADUSDT (Radworks) Updated till 23-10-24RADUSDT (Radworks) Daily timeframe range. another alt been in its local low level for a long time now. trying to break through 1.373 a clean close over it can push it further. local support at 0.986.
RADUSDT - UniverseMetta - Analysis#RADUSDT - UniverseMetta - Analysis
Update of the previous forecast..
On D1, the price consolidated above the upper border of the narrowing channel, which may be a signal for long-term purchases, with targets for updating 3.58. It is clear that the price tried to return to the channel, but found support there at 0.97. Further, consolidation is visible at these values and the formation of a triangular formation with a breakout of the trend line. Now a potential retest of this level may be realized, which may lead to a continued increase in volumes for purchase.
Target: 1.34 - 3.58

RADUSDT - UniverseMetta - Analysis#RADUSDT - UniverseMetta - Analysis
On D1, the price consolidated above the upper border of the narrowing channel, which may be a signal for long-term purchases, with targets for updating 3.58. It is worth being careful if an ABC or 3-wave structure is formed in the opposite direction, the price may make a false breakout and once again update the minimum or return to the channel and continue to decline.
Target: 1.45 - 3.58

#RAD/USDT#RAD
The price is moving in a descending channel on the 12-hour frame and is sticking to it very well and is expected to break it upwards
We have a bounce from a major support area in green at .9400
We have an uptrend on the RSI indicator that was broken upwards which supports the rise
We have a trend to stabilize above the 100 moving average which supports the rise
Entry price 1.18
First target 1.40
Second target 1.70
Third target 1.95

#RAD/USDT#RAD
We have a bearish channel pattern on a 4-hour frame, the price moves within it, adheres to its limits well, and is expected to break it upwards in a strong manner.
We have a support area at the lower border of the channel at $1.60 from which the price rebounded
We have a tendency to stabilize above moving average 100
We have an uptrend on the RSI indicator that is about to break higher, supporting the price higher
Entry price is 1.80
First goal 2.12
The second goal is 2.29
The third goal is 2.51

Rad/Usdt Plan The price of RAD/USDT is on the verge of a breakout, with expectations of a 30-60% bullish move upon a successful breakout. The current trend indicates a high probability of a bullish breakout. Please note that this information is not financial advice; do your research before making any financial decisions.

#RADIn the D1 time, there is a correction in the specified resistance, which can retest the previous ceiling by maintaining the Fibo 50% of the $1.56 area, and in case of failure, continue the growth to the next area, which is the important weekly supply area. If it penetrates below 1.56, it will have a short-term daily downward trend.

RAD Temp Pullback Due to BTC.D Due to ETF Hype the BTC D taking all liquidity in the market , after the approval Hype toke place the Money will flow back to ALTS
RAD was having 4H Downtrend in short term which has been broken today , DCA from here
Liquidity grab above 2 $ Area is a most now and then RAD will decide which position will take

RAD healthy Pullback to 1.7$ range & gearing up for 3$ area testamazing and expected behavior from RAD last couple of weeks
it keeps smashing and testing level with healthy pullback always to demand zones
RADworks have niece potential and gearing up for massive pump
take SPOT position now without SL and DCA from here ,
catch you later on 3 $ area


Radusdt and umausdt #Radost #Umausdt These two charts are placed on top of each other and have similar movements according to radusdt He can reach umausdt
