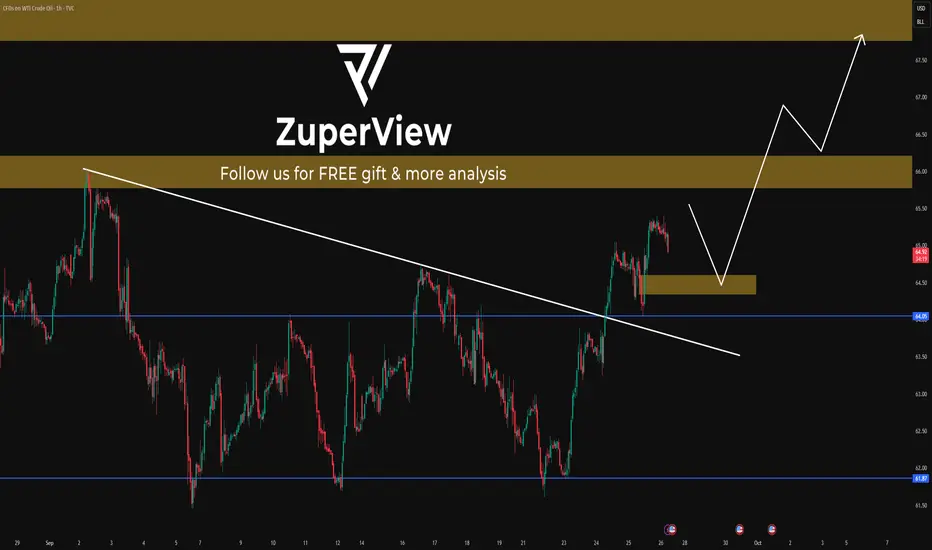
USOIL: Sideways-to-lower in a tight bandThis is my previous analysis — feel free to take a look for reference.
1. Institutional Forecast Updates
IEA (Sep 15, 2025):
WTI targets $64.2/bbl for 2025 and $47.8/bb l for 2026
Brent targets $68/bbl for 2025 and $51/bb l for 2026
Goldman Sach (Jul 14, 2025):
WTI targets $63/bbl for H2 2025 and $52/bbl for 2026
Brent targets $64/bbl for H2 2025 and $56/bbl for 2026
J.P. Morgan (May 16, 2025):
Brent targets $64/bbl for H2 2025 and $56/bbl for 2026
www.rigzone.com
www.reuters.com www.jpmorgan.com
2. Key Drivers & Risks
📉 Supply
OPEC+ unwinding cuts of 2.2 mb/d (2024–2025), plus +137 kb/d starting October 2025.
Global supply reached 106.9 mb/d in Aug 2025; projected to rise by +2.7 mb/d to 105.8 mb/d in 2025.
U.S. output hit a record 13.2–13.4 mb/d (2024–2025)
Brazil, Guyana, and Canada are key contributors to non-OPEC+ growth.
U.S. shale breakeven costs: ~$62–68/bbl.
New offshore projects breakeven at ~$47/bbl.
OECD inventories in July 2025: 2,848 million barrels; 58.1 days of forward cover.
✳️ Demand
Global oil demand in 2024: ~103 mb/d (~193 EJ)
2025 demand growth of only +0.7 mb/d (weakest since 2009, excluding 2020).
OPEC projects demand growth of +1.3 mb/d in 2025 and +1.4 mb/d in 2026.
Consumption structure: transport accounts for ~two-thirds of oil demand; >90% of transport energy comes from oil.
Petrochemicals (naphtha, LPG) remain a key driver of incremental demand.
🛑 Politics & Geopolitics
Escalating Middle East tensions: growing risks in the Strait of Hormuz and Red Sea.
Kurdistan–Turkey pipeline (~0.23 mb/d) subject to recurring disruptions.
Venezuela: Chevron faces restrictions on U.S. exports.
OPEC+ often produces ~0.5 mb/d below quota due to capacity limits.
Long-term trend: EV adoption and emission policies structurally weaken demand growth.
✅ Overall View:
Overall, governments both want to bring oil prices down to support their economies and also tend to protect oil companies, since prices are currently low relative to many firms’ breakeven levels.
Prices are likely to edge gradually lower within a narrow range of $70–$50, and it is important to closely monitor factors that could trigger supply–demand shocks.
3. Technical Analysis
* Trend: assessed using at least three trend indicators, with market structure as the primary guide.
** Weak or Reversal Signals: Assessed based on one of our criteria for trend reversal signals.
*** Support/Resistance: Selected from multiple factors – static (Swing High, Swing Low, etc.), dynamic (EMA, MA, etc.), psychological (Fibonacci, RSI, etc.) – and determined based on the trader’s discretion.
**** Our advice takes into account all factors, including both fundamental and technical analysis. It is not intended as a profit target. We hope it can serve as a reference to help you trade more effectively. This advice is for informational purposes only and we assume no responsibility for any trading results based on it.
Please like and comment below to support our traders. Your reactions will motivate us to do more analysis in the future 🙏✨
Range

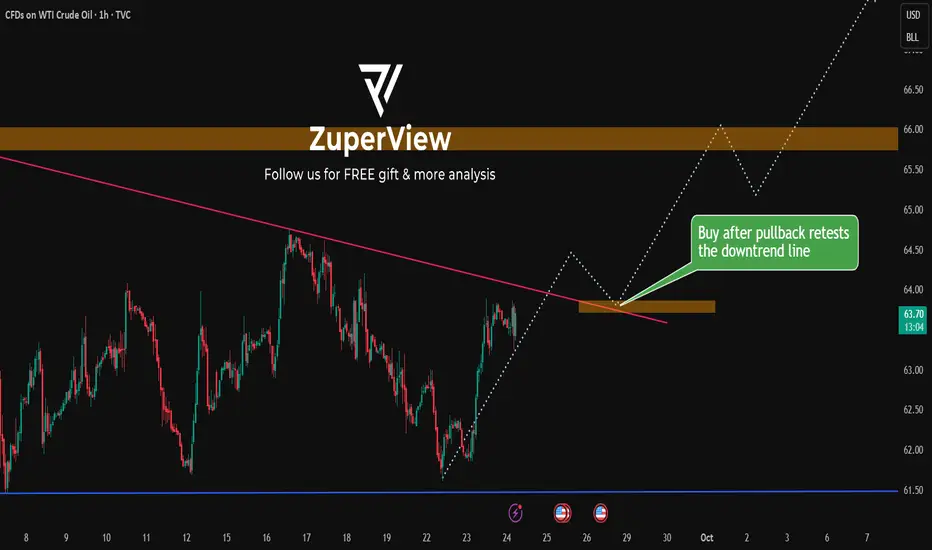
USOIL: Waiting for resistance rejection & buying at support zonePlease refer to my previous higher-timeframe analyses to better follow my current outlook on USOIL.
* Trend: assessed using at least three trend indicators, with market structure as the primary guide.
** Weak or Reversal Signals: Assessed based on one of our criteria for trend reversal signals.
*** Support/Resistance: Selected from multiple factors – static (Swing High, Swing Low, etc.), dynamic (EMA, MA, etc.), psychological (Fibonacci, RSI, etc.) – and determined based on the trader’s discretion.
**** Our advice takes into account all factors, including both fundamental and technical analysis. It is not intended as a profit target. We hope it can serve as a reference to help you trade more effectively. This advice is for informational purposes only and we assume no responsibility for any trading results based on it.
Please like and comment below to support our traders. Your reactions will motivate us to do more analysis in the future 🙏✨
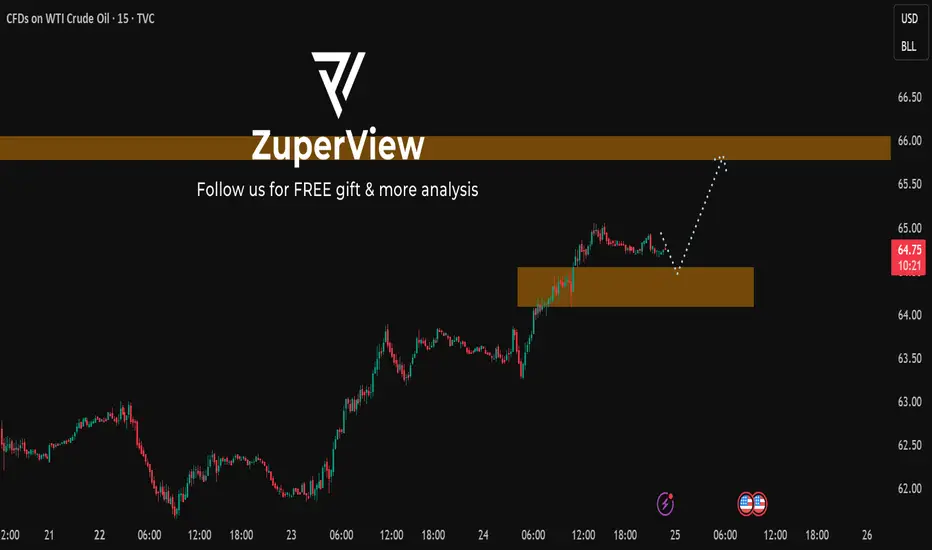
USOIL: Breaks $64.75 — Is a retest of $66 and higher level?This is my previous analysis — feel free to take a look for reference.
* Trend: assessed using at least three trend indicators, with market structure as the primary guide.
** Weak or Reversal Signals: Assessed based on one of our criteria for trend reversal signals.
*** Support/Resistance: Selected from multiple factors – static (Swing High, Swing Low, etc.), dynamic (EMA, MA, etc.), psychological (Fibonacci, RSI, etc.) – and determined based on the trader’s discretion.
**** Our advice takes into account all factors, including both fundamental and technical analysis. It is not intended as a profit target. We hope it can serve as a reference to help you trade more effectively. This advice is for informational purposes only and we assume no responsibility for any trading results based on it.
Please like and comment below to support our traders. Your reactions will motivate us to do more analysis in the future 🙏✨
USOIL: Range-bound setup with upside test before downside risk
* Trend: assessed using at least three trend indicators, with market structure as the primary guide.
** Weak or Reversal Signals: Assessed based on one of our criteria for trend reversal signals.
*** Support/Resistance: Selected from multiple factors – static (Swing High, Swing Low, etc.), dynamic (EMA, MA, etc.), psychological (Fibonacci, RSI, etc.) – and determined based on the trader’s discretion.
**** Our advice takes into account all factors, including both fundamental and technical analysis. It is not intended as a profit target. We hope it can serve as a reference to help you trade more effectively. This advice is for informational purposes only and we assume no responsibility for any trading results based on it.
Please like and comment below to support our traders. Your reactions will motivate us to do more analysis in the future 🙏✨
XAUUSD Long: Bullish Momentum ContinuesHello, traders! The prior price auction for XAUUSD was dominated by a wide consolidation range, from which the price broke out with significant bullish momentum. This breakout from the demand zone 2 established the current uptrend, which has since taken the form of a well-defined ascending channel, confirming that the market initiative is with the buyers.
Currently, the price action continues to be guided by this ascending channel. After a successful breakout above the demand level, the price has reached the upper portion of the channel and is now in a corrective phase. This pullback is a normal part of a healthy uptrend and is bringing the price back towards an area of potential support.
My scenario for the development of events is a continuation of the uptrend after this correction. I believe the price will find support, possibly after a brief dip, and then resume its rally within the channel. In my opinion, the underlying bullish momentum is strong enough to push for a new structural high. The take-profit is therefore set at 3785, targeting the upper resistance area of the channel. Manage your risk.

XAUUSD: Rally will Continue after CorrectionHello everyone, here is my breakdown of the current Gold setup.
Market Analysis
The prior Upward Channel has been broken, and the price is now trading below a major Trend Line, indicating that the strong bullish momentum has paused and the market has entered a corrective phase.
Currently, this corrective phase has taken the form of a horizontal Range or consolidation above the Support 2 level. The price has been oscillating between local support and resistance, and is now making another move down towards the bottom of this Range for what I see as a critical test.
My Scenario & Strategy
I'm looking for the price to complete its correction down into Support zone. A confirmed bounce from this area would be the first signal that the pullback is over. The next key step would be a breakout from the top of the current Range.
Therefore, the strategy is to watch for this bounce. A successful breakout from the Range would validate the long scenario. The primary target for the subsequent rally is 3825, which aims for a retest of the major broken Trend Line from below.
That's the setup I'm tracking. Thank you for your attention, and always manage your risk.

$BTC beautiful range to play i will looking for short!lower time frame rejection call lead us for more downside ! keep eye on it..

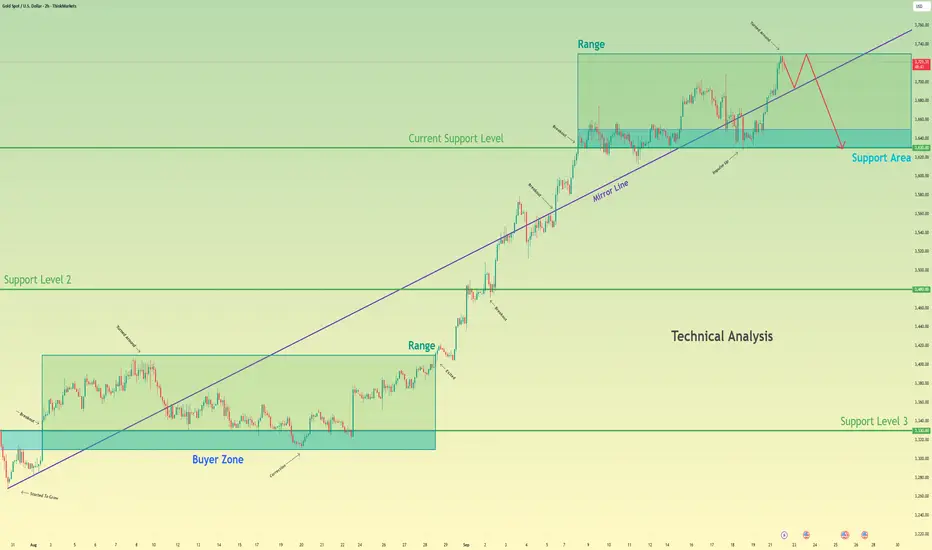
Gold can Complete its Topping Pattern and FallHello traders, I want share with you my opinion about Gold. The market has been developing a complex consolidation structure after its initial uptrend failed to sustain momentum. After breaking out of a first range, the bullish impulse failed, leading to a breakdown below the major ascending mirror line and establishing the current, higher second range. The price action for XAU has since been contained within this new consolidation, repeatedly testing the upper resistance and lower support boundaries. Currently, the asset is again testing the upper boundary of this range, an area that has consistently attracted sellers. In my mind, this price action is forming a complex topping pattern. I expect that the price will be rejected from the top of the current range, perhaps after a brief interaction with the nearby mirror line, and then fail at the highs one more time. I think this final failure will trigger a significant decline with enough momentum to break the mirror line support decisively. Therefore, I have placed my TP at the 3630 current support level, targeting the bottom of this second range. Please share this idea with your friends and click Boost 🚀
Disclaimer: As part of ThinkMarkets’ Influencer Program, I am sponsored to share and publish their charts in my analysis.
EURUSD Long: Rally Continues in Ascending ChannelHello, traders! The prior price auction for EURUSD was dominated by a wide consolidation range, bounded by the demand zone 2. Within this range, a new bullish structure began to form as an ascending channel, which eventually gathered enough momentum to break out and confirm a new uptrend, shifting market control to the buyers.
Currently, the price action continues to be guided by this ascending channel. Following a recent test of the upper price levels, the market has entered a corrective phase. The auction is now pulling back towards a significant confluence of support, located near the 1.1740 DEMAND level, which also aligns with the channel's dynamic support line.
My scenario for the development of events is a continuation of the uptrend after this correction completes. I expect the price to find strong support at the confluence of the channel's demand line and the 1.1740 - 1.1760 DEMAND ZONE. In my opinion, a confirmed bounce from this area will signal the end of the pullback and trigger the next impulsive move higher. The take-profit is therefore set at 1.1865, an intermediate target within the channel's structure. Manage your risk!

Gold can continue its bullish trend after small correctionHello traders, I want share with you my opinion about Gold. The market context for Gold has been firmly bullish since the price broke out of its prior consolidation range, a move that originated from the deep 3270 - 3290 buyer zone. This breakout shifted the market structure, initiating a new impulsive phase that has since been guided by a major ascending mirror line. The price action for XAU has been respecting this dynamic support, creating a clear sequence of higher highs and higher lows. Currently, after reaching a new local high, the asset is undergoing a healthy corrective phase. This pullback is guiding the price back towards a critical confluence of support, defined by the 3622 - 3598 support zone and the ascending mirror line itself. The primary working hypothesis is a long, trend-continuation scenario, which anticipates that buyers will step in to defend this key support cluster. A confirmed bounce from this area would signal the conclusion of the corrective move and the resumption of the dominant upward trend. This would likely initiate the next impulsive wave higher. Therefore, the TP is logically placed at 3720, representing a new potential structural high. Please share this idea with your friends and click Boost 🚀
Disclaimer: As part of ThinkMarkets’ Influencer Program, I am sponsored to share and publish their charts in my analysis.

XAUUSD: Bounce from 3615 Support LevelHello everyone, here is my breakdown of the current Gold setup.
Market Analysis
From a broader perspective, after a strong run-up within a prior Upward Channel, the price action for Gold has transitioned into a horizontal consolidation Range. This shift from a trending to a ranging market indicates a period of balance as buyers and sellers digest the previous impulsive move.
Currently, the price is in a corrective phase within this Range. After recently failing to break above the Resistance Zone, sellers have pushed the price down, and it is now approaching the major horizontal support at the bottom of the consolidation, near the Support 1 level.
My Scenario & Strategy
I think that this Range structure will continue to hold for now. The lower boundary, which aligns with Support 1 at 3615, is a significant area of historical support. This Support zone represents a high-probability area for buyers to step in and defend, just as they have in the past.
My scenario is that Gold will complete its drop to the lower part of the consolidation, testing the Support 1 level. Therefore, I expect that a successful defense of this support will lead to a rally back across the Range. My target for this move is 3700, which is placed within the major Resistance Zone at the top of the consolidation.
That's the setup I'm tracking. Thank you for your attention, and always manage your risk.

BTCUSD: Price Exit from Triangle and Reach Resistance LevelHello everyone, here is my breakdown of the current Bitcoin setup.
Market Analysis
From a broader perspective, the price of Bitcoin has been consolidating within a wide Range, oscillating between the major Support zone around the 109500 level and the Resistance Zone up to 121200. This lengthy period of balance has now tightened into a more defined triangle pattern, suggesting energy is building.
Currently, the price is coiling within the final stages of this triangle, a classic sign of volatility compression. After a recent test of the upper resistance line, the price is in a corrective pullback, heading towards the ascending support line for what I see as a key test of buyer strength.
My Scenario & Strategy
I'm looking for the price to complete its corrective move and find strong support on the ascending Triangle Support Line. A confirmed bounce from this dynamic support would be the key signal that the next impulsive move up is about to begin, with the goal being a breakout from the top of the triangle.
Therefore, the strategy is to watch for this bounce. A successful rebound that leads to a breakout above the Resistance Zone would validate the long scenario. The primary target for this breakout move is the 120000 Resistance level.
That's the setup I'm tracking. Thank you for your attention, and always manage your risk.

NFP "Goldilocks" playbook? EURUSD triggers revealed!Markets are optimistic and consolidating ahead of the Non-Farm Payrolls (NFP) report, with EUR/USD poised for a breakout, plus a quick technical overview of gold, GBP/USD, and USD/JPY.
Mood : Buoyant—risk assets and equities are near weekly highs, bond yields are easing.
Consensus : A "Goldilocks" NFP (not too hot, not too cold) is expected, supporting a 25bp Fed rate cut this month and possibly another by year-end.
Catalysts : Recent softer labour data and dovish Fed commentary have fueled bets on a more accommodative policy stance.
EUR/USD Conditional Scenarios
Key Levels: Support at 1.1524, 1.1580, 1.1600, 1.1625; Resistance at 1.1700, 1.1735, 1.1760, 1.1830
Scenarios :
Strong NFP : Sell 1.1650–1.1670, targets 1.1600/1.1580/1.1524, stop 1.1700
Goldilocks NFP : Range trade 1.1625–1.1700, buy/sell at edges, stops 1.1580/1.1720
Weak NFP : Buy 1.1630–1.1650, targets 1.1735/1.1760/1.1830, stop 1.1600
Risk : 1–2% per trade, always use stops, watch for ECB-driven reversals
This content is not directed to residents of the EU or UK. Any opinions, news, research, analyses, prices or other information contained on this website is provided as general market commentary and does not constitute investment advice. ThinkMarkets will not accept liability for any loss or damage including, without limitation, to any loss of profit which may arise directly or indirectly from use of or reliance on such information.

XAUUSD Short: Correction After the All-Time HighHello, traders! The prior market structure for XAUUSD was a prolonged consolidation range, from which the price broke out with significant bullish momentum. This breakout initiated a powerful upward trend, with the price auction pushing through multiple resistance levels to establish a new all-time high. This marked the climax of the recent buying initiative.
Currently, following the peak at the ATH, the market has entered a corrective phase. Sellers have taken control in the short term, and the price is now declining from the highs. The auction is presently challenging the first major demand zone located between 3585 and 3570, but the bearish momentum appears strong.
The primary scenario anticipates a continuation of this corrective move. The expectation is that the current 3570 demand level will fail to hold against the selling pressure. A confirmed breakdown below this demand zone would validate the short thesis and open the path for a deeper correction towards the main ascending trend line. The take-profit is therefore set at 3565, targeting the area immediately following this breakdown. Manage your risk!

EUR_CAD WAIT FOR BREAKOUT|LONG|
✅EUR_CAD is trading in a
Strong uptrend and the pair
Has formed a range pattern
So IF we see a bullish breakout
We will be expecting a further
Bullish move up next week
LONG🚀
✅Like and subscribe to never miss a new idea!✅

BTCUSD: Consolidation will ContinueHello everyone, here is my breakdown of the current Bitcoin setup.
Market Analysis
From a broader perspective, the market for Bitcoin has shifted from a trending phase into a wide consolidation Range. This occurred after the price broke down from a prior Upward Wedge, signaling a pause in the bullish momentum and establishing the current boundaries between the 107700 Support and the 119000 Resistance.
Currently, the price has completed a full rotation from the bottom of this Range and is now approaching the major horizontal Resistance at the 119000 level. This is a historically significant area that has repeatedly capped rallies and acted as a strong barrier for buyers.
My Scenario & Strategy
I'm anticipating that the price will make a final push into the 119800 - 119000 Resistance Zone. The key signal I'm watching for is a clear rejection from this area, confirming that sellers are still in control at these prices and that another rotation downwards is likely.
Therefore, the strategy is to watch for this rejection at the top of the Range. A confirmed reversal would validate the short scenario. The primary target for this downward rotation is 111000 points, an intermediate level within the Range where a price reaction could be expected.
That's the setup I'm tracking. Thank you for your attention, and always manage your risk.

Gold may move up a little and then start to declineHello traders, I want share with you my opinion about Gold. The market for Gold has transitioned from a prolonged balancing phase into a strong directional trend, following a decisive breakout from its prior multi-week big range. This breakout, originating from the support area near the 3445 level, shifted market control firmly to buyers and initiated a new impulsive phase. The price action for XAU since then has been characterized by a steep, high-momentum rally, which is being guided by an ascending mirror line. Currently, the asset is at a new high, continuing to push upwards along this aggressive trendline. However, such accelerated trends are often unsustainable and can signal that the market is becoming overextended and due for a correction. I expect that after a potential final push higher, the price will stage a sharp reversal, with enough selling pressure to cause a breakdown below the steep mirror line. A break of this dynamic support would be the first confirmation that a corrective phase has begun. Therefore, the TP for this corrective scenario is logically placed at 3520 points. Please share this idea with your friends and click Boost 🚀

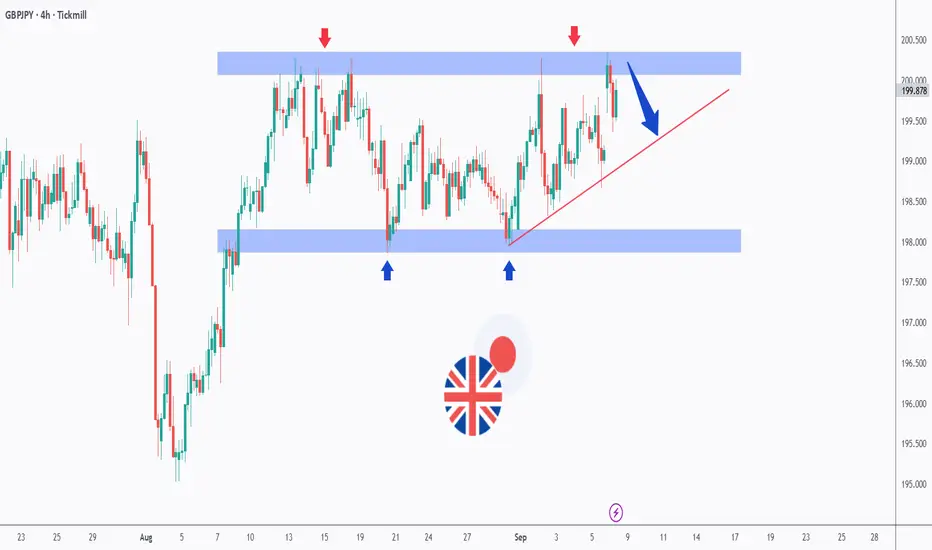
GBPJPY – Testing the Range Once AgainGBPJPY has been stuck in a wide range between 198.00 (support) and 200.50 (resistance) for several weeks now.
🔻 Sellers continue to defend the upper boundary (red arrows).
🔹 Buyers are stepping in around the 198.00 demand zone (blue arrows).
📈 Price is currently rejecting the resistance area once more while also sitting above the rising trendline (red).
If the resistance holds, we could see a rejection toward the lower bound of the range. On the other hand, a clean breakout above 200.50 would be needed for bulls to take full control. 🚀
This setup makes GBPJPY one of the key pairs to watch in the coming days.
Disclaimer:
This analysis is for educational purposes only and does not constitute financial advice. Always do your own research and follow your trading plan before making any investment decisions.
📚 Stick to your trading plan regarding entries, risk management, and trade execution.
Good luck!
All Strategies Are Good; If Managed Properly!
~Richard Nasr
DXY Analysis – Are Bad News Already Priced In?Since Trump entered the White House, the U.S. Dollar has taken a hard hit against its major counterparts, losing more than 10% overall.
But looking closer at the chart, we see a different story: since the April low around 97.80, the DXY has been stuck in a range-bound pattern, with the exception of July’s dip that was quickly reversed.
Lately, the USD has faced strong headwinds:
• Two weak NFP reports in a row.
• The Fed hinting at rate cuts.
• A constant flow of bearish headlines.
And yet, the Dollar did not collapse to fresh lows — instead, it simply revisited the same levels as before. This is a classic market signal that bad news may already be priced in.
From a technical standpoint, August was nothing but an annoying tight range:
• Support around 97.50.
• Resistance near 98.50.
Now, although the index looks like it’s breaking lower, I suspect this is another false breakdown, one that could be reversed quickly. If that plays out, the stage is set for a push higher — potentially to the 100 zone, a clean 3% rise from current levels.
Such a move would naturally translate into pressure on the majors:
• EUR/USD could slide back toward 1.14.
• GBP/USD could retreat near 1.35.
For now, I’m watching closely for reversal signals. The market has punished the USD for months, but if sellers are exhausted, the Dollar may surprise to the upside. 🚀

Follow-Up: Non-Farm Moves from FridayHi All,
Following up on the range (size of the move) after non-farm on Friday to see how close our range expectation estimates were (see the earlier video post linked here for that).
The actual number came in pretty poor and worse than expected at 22k (vs 75k expected).
The move on the Non-farm release itself was actually quite muted with roughly a 20pt move on both sides of our VWAP starting point. But the real move came around 30 minutes into the US open where we saw a quick decline down to our lower boundary (50pts lower at 6470) and then briefly over-ran to 6450. But we settled and that 6470 became support for most of the session before reverting back to that declining VWAP to finish the day around 6490.
So, what's the lesson here: a bit of time pre-framing the possibilities for moves in either direction using a combination of stats (ATR, standard deviation of range), other technical analysis tools (support/resistance, VWAP, vol profile) along with experience can help frame the day and the important levels. Use this to start to decide what tools to pull out of the toolbox (trading strategies) and where to initiate trades.
If you find this helpful and would like to see more please let me know.
Happy Trading!

Gold will continue to grow inside upward channelHello traders, I want share with you my opinion about Gold. The market context for Gold has been firmly bullish since the price broke out of its prior consolidation range, a move that originated from the deep buyer zone. This breakout shifted the market structure, initiating a new impulsive phase that has since been neatly contained within a well-defined upward channel. The price action for XAU has been respecting the boundaries of this channel, creating a clear sequence of higher highs and higher lows. Currently, after being rejected from the channel's upper resistance line, the asset is undergoing a healthy correction movement. This pull-back is guiding the price back towards a significant confluence of support, where the ascending support line of the channel converges with the horizontal support zone near the 3485 current support level. The primary working hypothesis is a long scenario, based on the expectation that buyers will defend this area and maintain the integrity of the uptrend. A confirmed bounce from this dynamic support would signal the end of the correction and the resumption of the primary bullish trend. Therefore, the TP is logically placed at 3610 points, representing a new structural high and a measured objective for the next impulsive wave. Please share this idea with your friends and click Boost 🚀

NZDCAD – Range Resistance in Play!📌 NZDCAD has been moving within a clear range structure between support and resistance zones on the 1H timeframe.
Price is now approaching the upper resistance area, where sellers have consistently stepped in to cap bullish momentum.
If this level holds, we could see a bearish reversal, driving price back toward the support zone near the lower boundary of the range.
This setup offers a classic opportunity to trade the swing from resistance back into support.
⚠️ Always remember: patience pays. Let the market come to you.
📚 Always follow your trading plan regarding entry, risk management, and trade management.
Good luck!
All Strategies Are Good; If Managed Properly!
~Richard Nasr

Its Non-Farm: How much will ES Move?Hi all - Happy Non-Farm Friday!
I haven't done this in a while and thought it might be helpful to share my process for estimating the size of the move that we may get on ES after the Non-Farm Payrolls data is released.
I'm not trying to make a prediction on direction here - but more understand where the boundaries could be so I can determine how to trade this (what trading tool I can pull out of my box) once the announcement comes out.
Hope it helps and please let me know if you find it useful and I'll create more posts .
Cheers,
Jeff
