AUDCAD - Stuck in a Range… Bears Eye the Upper Boundary!📦AUDCAD has been moving inside a clear horizontal range , with price repeatedly rejecting the upper resistance zone highlighted in red. Each time price tapped this area, sellers regained control and pushed it downward.
⚔️Price is now approaching that same resistance once again. As long as this zone holds, we will be looking for sell setups, expecting AUDCAD to reverse back toward the lower bound of the range.
📉The bias remains bearish within this structure unless buyers manage to break and close above the resistance with strength.
Do you think AUDCAD will respect the range again? Share your thoughts below 👇
⚠️ Disclaimer: This is not financial advice. Always do your own research and manage risk properly.
📚 Stick to your trading plan regarding entries, risk, and management.
Good luck! 🍀
All Strategies Are Good; If Managed Properly!
~Richard Nasr
Range

How to Identify a Ranging Market Before It Traps You.Price is moving. But not every move is an opportunity.
This 1H Bitcoin chart is a textbook example of why traders get chopped up — even when structure and levels look "clear."
━━━━━━━━━━━━━━━━━━━━━━━━━━━━━━━━━━━━━━━━━━━━━━━━━━━━
WHAT THIS CHART SHOWS
━━━━━━━━━━━━━━━━━━━━━━━━━━━━━━━━━━━━━━━━━━━━━━━━━━━━
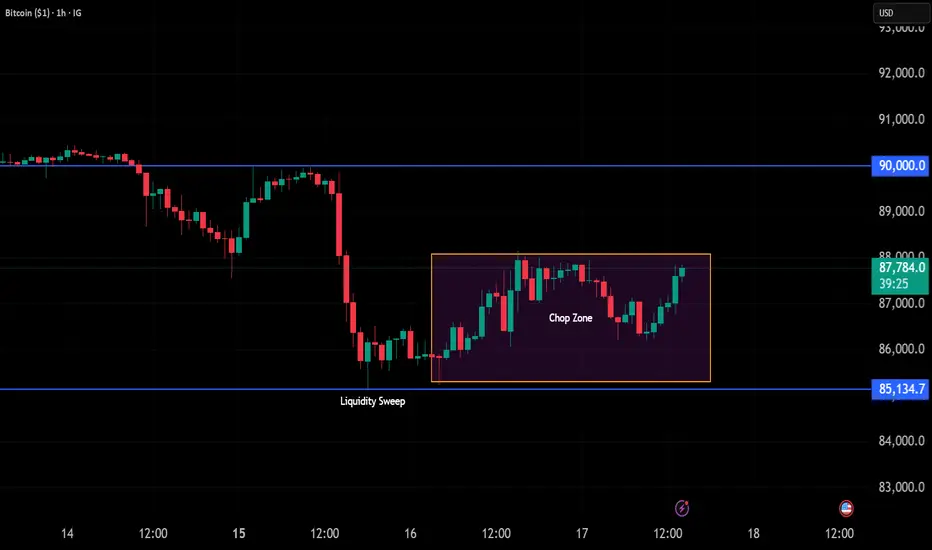
Look at the price action from Dec 14–18:
- Dec 14–15: Sideways grind near 90K resistance
- Dec 15: Sharp drop from 90K → 85K (liquidity sweep)
- Dec 16–18: Price trapped in the Chop Zone (85K–88K)
Every push fades. Every breakout attempt stalls. Classic ranging behavior.
━━━━━━━━━━━━━━━━━━━━━━━━━━━━━━━━━━━━━━━━━━━━━━━━━━━━
HOW TO SPOT A RANGE
━━━━━━━━━━━━━━━━━━━━━━━━━━━━━━━━━━━━━━━━━━━━━━━━━━━━
Ask yourself:
1. Is price making higher highs AND higher lows? → If NO, likely ranging
2. Do breakouts hold? → If they fade quickly, it's a range
3. Is volatility expanding or contracting? → Contracting = range
4. Are there multiple failed attempts at the same level? → Range behavior
On this chart: ❌ No trend structure ❌ Breakouts fade ❌ Volatility flat
Verdict: RANGE — not a trending environment.
━━━━━━━━━━━━━━━━━━━━━━━━━━━━━━━━━━━━━━━━━━━━━━━━━━━━
WHY THIS MATTERS
━━━━━━━━━━━━━━━━━━━━━━━━━━━━━━━━━━━━━━━━━━━━━━━━━━━━
In ranging conditions:
- Breakouts are more likely to fail
- Continuations lack momentum
- Liquidity sweeps dominate
- Mean-reversion > trend-following
The problem isn't your entry. It's the regime mismatch.
━━━━━━━━━━━━━━━━━━━━━━━━━━━━━━━━━━━━━━━━━━━━━━━━━━━━
WHAT TO DO IN THIS ENVIRONMENT
━━━━━━━━━━━━━━━━━━━━━━━━━━━━━━━━━━━━━━━━━━━━━━━━━━━━
✓ Reduce position size
✓ Reduce trade frequency
✓ Avoid chasing breakouts
✓ Expect rotation, not extension
✓ Wait for regime shift before trending plays
Waiting is a valid trading decision.
━━━━━━━━━━━━━━━━━━━━━━━━━━━━━━━━━━━━━━━━━━━━━━━━━━━━
KEY TAKEAWAY
━━━━━━━━━━━━━━━━━━━━━━━━━━━━━━━━━━━━━━━━━━━━━━━━━━━━
Most losses happen when traders force trend logic into a market that isn't trending.
Context first. Execution second.
━━━━━━━━━━━━━━━━━━━━━━━━━━━━━━━━━━━━━━━━━━━━━━━━━━━━
This is NOT a trade call. This is NOT a buy/sell signal.
This is an educational breakdown of market behavior.
BTCUSDT Long: Demand Support Fuels Push Toward $92,500Hello, traders! BTCUSDT previously traded within a well-defined Descending Channel, confirming strong bearish pressure and controlled sell-side momentum. Price consistently respected the channel boundaries, producing lower highs and lower lows until a decisive breakdown occurred near the lower channel edge. After this breakdown, Bitcoin reached a clear Pivot Point, where sellers began to lose control and buyers stepped in aggressively. This reaction marked the end of the bearish impulse and initiated a structural shift. From this pivot low, price started forming higher lows, signaling the emergence of demand and the beginning of a recovery phase.
Currently, BTC broke above local resistance and entered a Range phase, where price consolidated between the 88,000 Demand Zone and the 92,500 Supply Zone. Multiple breakout attempts occurred inside this range, confirming active participation from both buyers and sellers. However, each dip toward the demand area was quickly absorbed, showing strong buyer interest and defense of the lower boundary. A rising Demand Line formed beneath price, reinforcing bullish pressure and supporting higher lows within the range. This structure indicates accumulation rather than distribution, suggesting preparation for a directional move.
My primary scenario is bullish as long as BTCUSDT holds above the 88,000 Demand Zone and continues respecting the ascending demand line. The recent pullback into demand appears corrective rather than impulsive, favoring continuation to the upside. I expect price to push back toward the 92,500 Resistance, which represents the upper boundary of the range and a key decision level. A clean breakout and acceptance above 92,500 would confirm bullish continuation and open the path for further upside expansion. Manage your risk!

EURUSD: Rejection at Key Resistance - Support Zone at 1.1720Hello everyone, here is my breakdown of the current EURUSD setup.
Market Analysis
EURUSD is trading within a broader bullish structure, but the current price action points to a short-term corrective phase. After establishing an upward channel, price successfully broke above the previous consolidation range, confirming bullish momentum. This breakout pushed the pair higher toward the 1.1770 Resistance Zone, which has historically acted as a strong supply area.
Currently, at this resistance, price has shown hesitation and rejection, indicating that sellers are starting to defend this level. As a result, EURUSD is now pulling back from the highs, moving toward the 1.1720 Support Zone, which aligns with the previous breakout area and the lower boundary of the upward channel. This support zone is critical, as it represents the key demand area sustaining the bullish structure.
My Scenario & Strategy
My scenario is short-term bearish as long as EURUSD remains capped below the 1.1770 Resistance Zone. I expect a controlled pullback toward the 1.1720 Support, where buyers are likely to step in and attempt to defend the trend. A clean breakdown below this support would confirm a deeper correction within the channel.
However, if price holds above the support zone and shows a strong bullish reaction, the broader uptrend remains intact, and another attempt toward the resistance highs may follow. For now, the focus is on the corrective move, with 1.1720 as the key level to watch.
That's the setup I'm tracking. Thank you for your attention, and always manage your risk.

SOLUSDT — Range Accumulation After Demand ReactionSOLUSDT reacted strongly from the demand zone area, where price formed a head and shoulders structure that supported a move from lower levels to the upside. After the recovery, the market entered a consolidation range, showing balance between buyers and sellers.
Price is now holding above demand and building pressure below the buyer zone. A clean breakout from this level would confirm bullish continuation, opening the path toward the marked target area.
As long as demand holds, the structure favors upside continuation, while failure to break out may keep the market ranging before the next directional move.

EURUSD — Strong Supply Rejection After Buyer-Zone Breakout EURUSD completed a full Wyckoff-style distribution, starting with UTA and DTA phases, followed by range formation and a clear rounded top near the strong supply zone. The breakout above the buyer zone was a false move, trapping late buyers and confirming smart money selling pressure.
Price was aggressively rejected from supply and is now trading back below the buyer zone, indicating bearish control. If the marked support is broken, continuation toward the first target is likely, with extended downside potential into the major demand zone area.
Overall structure favors shorts while price remains below the supply zone, with targets aligned toward lower liquidity and demand.

EURGBP — Trendline Breakdown & Seller Zone Entry Toward TargetEURGBP maintained a structured bullish move within ascending channels (UTA/DTA), but price failed to hold above the key trendline and buyer zone. After multiple range distributions, the market broke the trendline decisively, signaling a shift in control from buyers to sellers.
The breakdown triggered a clean pullback into the seller zone, where price showed rejection and continuation pressure. As long as price stays below the broken trendline, bearish momentum remains valid, with the downside target aligned at the lower demand zone. This move reflects a classic trendline break → retest → continuation setup.

EURUSD Short: Bears Defend Resistance - Next Stop 1.1700Hello, traders! EURUSD is trading within a broader bearish structure, with price action clearly respecting a descending trend line from the higher timeframe. Earlier, the pair reacted from a Pivot Point near the trend line and moved into a consolidation Range, showing indecision before the next directional move. During this phase, price attempted a breakout above the mid-range level, but this move turned into a Fake Breakout, confirming that buyers lacked strength at higher prices. Shortly after, EURUSD formed a clear Head and Shoulders pattern, with a well-defined left shoulder, head, and right shoulder, signaling a potential bearish reversal within the larger downtrend. Following the completion of the right shoulder, price pushed higher and briefly broke above the 1.1700 Demand Zone, but this breakout was quickly rejected. The market then reached the major Supply Zone around 1.1760, where sellers stepped in aggressively, causing a sharp rejection and confirming this area as a strong resistance.
Currently, EURUSD is pulling back from the Supply Zone and moving back toward the 1.1700 Demand Zone, which aligns with previous breakout levels and acts as a key decision area.
My scenario remains bearish as long as EURUSD stays below the descending trend line and the 1.1760 Supply Zone. I expect price to continue pulling back toward the 1.1700 Demand Zone, where the next reaction will define short-term direction. A clean breakdown and acceptance below the 1.1700 level would confirm bearish continuation and open the path toward lower support levels. If price temporarily reacts from demand, a short-term bounce is possible, but the overall bearish bias remains valid while price is capped below the Supply Zone and trend line. For now, sellers remain in control, with the main focus on a move back into the Demand Zone around 1.1700. Manage your risk!

XAUUSD: Rejection at Resistance - Support Zone at 4,270 in FocusHello everyone, here is my breakdown of the current XAUUSD setup.
Market Analysis
Gold (XAUUSD) is trading within a broader bullish structure, but the current price action suggests a short-term corrective move. After breaking above the descending Triangle Resistance Line, price entered a consolidation Range, where accumulation formed before a bullish Breakout. This breakout pushed XAUUSD higher toward the key 4,350 Resistance, which has acted as a strong reaction zone in the past.
Currently, at this resistance level, price showed clear hesitation and rejection, signaling that sellers are becoming active again. The market is now pulling back from the highs, moving toward the 4,270 Support Zone, which aligns with the previous breakout area and the rising Triangle Support Line. This zone is critical, as it represents the main demand area keeping the structure bullish.
My Scenario & Strategy
My scenario is short-term bearish as long as XAUUSD remains capped below the 4,350 Resistance. I expect a controlled pullback toward the 4,270 Support, where buyers may attempt to defend the trend.A clean breakdown below the support zone would confirm a deeper correction toward the Triangle Support Line.
However, if price holds above 4,270 and shows strong bullish reaction, the broader uptrend remains intact and another attempt toward the highs may follow. For now, the focus is on the pullback phase, with 4,270 as the key level to watch.
That's the setup I'm tracking. Thank you for your attention, and always manage your risk.

BTCUSD: Buyers in Control - Resistance Retest AheadHello everyone, here is my breakdown of the current BTCUSDT setup.
Market Analysis
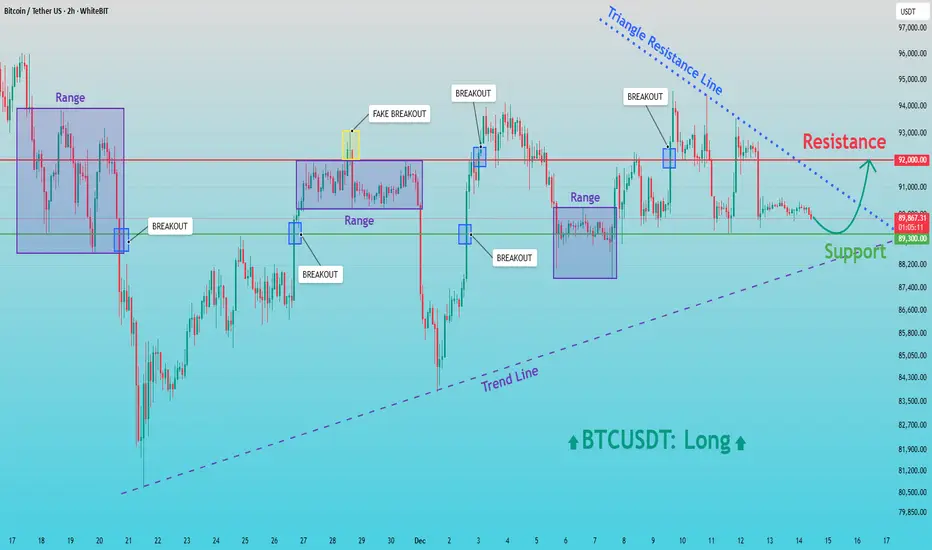
BTCUSDT is currently trading within a broadly bullish structure, supported by a rising trend line that has been respected after the major sell-off and subsequent recovery. Following the strong decline, price formed a base near the lower levels and initiated a reversal, creating higher lows and shifting market control back to buyers. After the initial rebound, Bitcoin entered multiple Range phases, where price consolidated and built liquidity. Each range was followed by a breakout, confirming sustained buying interest. Some of these moves included fake breakouts, which briefly trapped participants before price continued to respect the broader bullish structure.
Currently, BTCUSDT is holding above the key Support Zone around 89,300, which has repeatedly acted as a demand area. Price is also compressing under a descending Triangle Resistance Line, while the rising trend line continues to support the market from below. This creates a tightening structure, suggesting that a decisive move is approaching. The 92,000 Resistance level remains the main barrier overhead, where sellers have previously stepped in and rejected higher prices.
My Scenario & Strategy
My scenario remains bullish as long as BTCUSDT holds above the 89,300 Support Zone and continues to respect the ascending trend line. I expect buyers to defend this area and gradually build pressure toward the upper resistance. A clean breakout above the 92,000 Resistance, especially with strong momentum, would confirm bullish continuation and open the path for a move toward higher levels, aligned with the broader trend.
However, if price fails to break the triangle resistance and loses the 89,300 Support, a deeper pullback toward the trend line could occur before buyers attempt another recovery. Until such a breakdown happens, the structure favors buyers. For now, the market remains constructive, with support holding and resistance at 92,000 as the key level to watch.
That’s the setup I’m tracking. Thank you for your attention, and always manage your risk.
XAUUSD Defends Support – Upside Move Toward 4,380 ExpectedHello traders! Here’s my technical outlook on XAUUSD based on the current market structure. Gold continues to trade within a well-established bullish trend, supported by a clear ascending Trend Line that has been respected after multiple pullbacks. After an earlier rejection from the upper Resistance Level, price experienced a corrective decline but successfully turned around near the trend line, confirming strong buyer interest at lower levels. Following this reaction, XAUUSD broke above the descending Resistance Line, signaling a shift in momentum back in favor of buyers. The market then entered a Range phase, where price consolidated between the Support Level around 4,260 and the Buyer Zone near 4,300, indicating accumulation and balance before the next impulse move. A confirmed breakout from the range occurred to the upside, with buyers aggressively pushing price above the Buyer Zone. Currently, gold is trading firmly above 4,300, showing sustained bullish strength and acceptance above previous resistance. The next key area of interest is the upper Seller Zone / Resistance Level around 4,380, which has acted as a strong reaction zone in the past. As long as price holds above the 4,260 Support Level and continues to respect the ascending trend line, the bullish scenario remains valid. My primary scenario is a continuation toward the 4,380 resistance, where a reaction or short-term rejection may occur. A clean breakout above this Seller Zone could open the door for further upside expansion, while rejection may lead to a healthy pullback toward the Buyer Zone or trend line support. For now, the structure clearly favors buyers, with 4,380 as the main upside target. Please share this idea with your friends and don’t forget to manage your risk 🚀

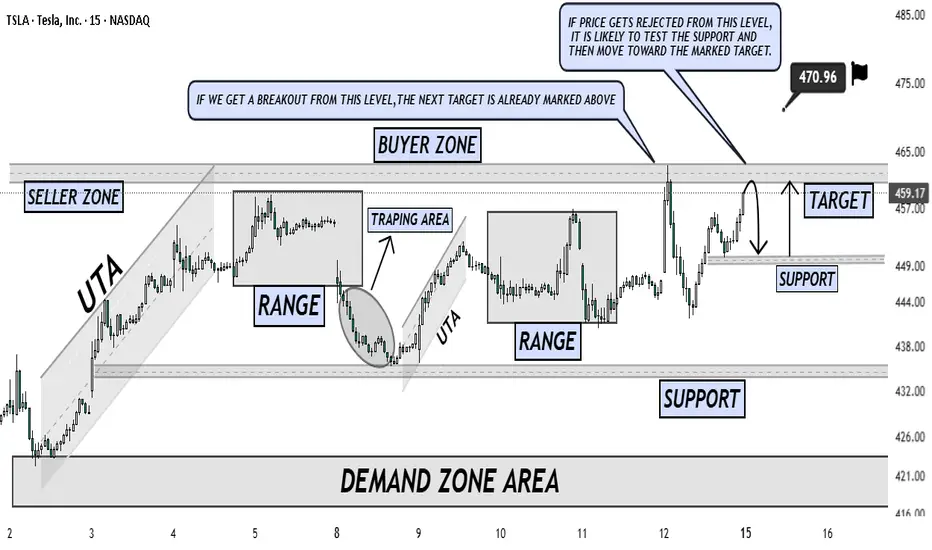
TSLA — Range Structure, Rejection Risk & Breakout Continuation TSLA is currently trading inside a well-defined range after a strong upside move from the demand zone, showing clear market structure with buyer and seller zones in play. Price has already reacted from the upper resistance area, where rejection is possible, indicating that sellers are defending this level aggressively.
If price fails to sustain above the buyer zone and shows rejection, a pullback toward the marked support level is likely, where liquidity and demand could step in before continuation toward the target. However, a clean breakout and acceptance above the resistance zone would invalidate the rejection scenario and open the path toward the next upside target already marked on the chart.
This setup highlights both scenarios clearly: rejection leading to a support retest, or breakout confirming bullish continuation. Patience and confirmation around key levels remain critical for execution.
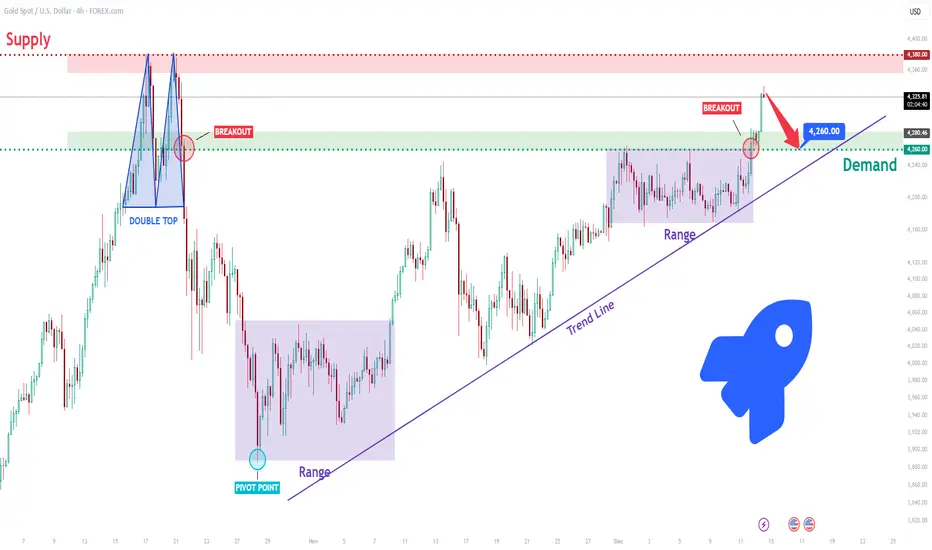
XAUUSD Short: Bears Aim for Pullback Into $4,260 Demand ZoneHello, traders! The current XAUUSD price action is showing early signs of bearish pressure after failing to sustain momentum above the upper resistance zones. Earlier, the market formed a strong Double Top inside the major Supply Zone, which triggered a sharp downside reversal and highlighted the presence of active sellers at the top of the structure. This rejection pushed gold back toward the mid-range levels, signaling a shift in market sentiment. After that decline, XAUUSD entered a prolonged Range phase, where price consolidated and accumulated liquidity for the next move. Although buyers attempted to regain control, the Trend Line breakout attempts showed weakening bullish strength, as each move higher was met with increased selling interest. The second consolidation Range formed near the upper supply boundary, confirming that the market was losing upward momentum.
Currently, gold broke out above the Range high but quickly faced resistance near $4,330, where sellers stepped in aggressively. Price is now pulling back and showing signs of returning toward the $4,260 level — a key decision zone that aligns with previous structure and where demand has recently weakened. As long as XAUUSD remains below the $4,330 resistance and fails to reclaim the local high, the bearish scenario becomes the primary outlook. A sustained move back into the Range and a breakdown below $4,260 would confirm stronger seller dominance and open the path toward deeper corrective movement.
My scenario is a continuation to the downside toward the $4,260 Demand Zone, especially if price breaks below $4,260 and loses the ascending structure. A clean breakdown of this level may trigger a broader bearish continuation. Manage your risk!
15/12/25 Weekly OutlookLast weeks high: $94,590.52
Last weeks low: $87,581.21
Midpoint: $91,085.87
A volatile yet directionless FOMC week comes to a close and a new week begins. As forecast the Fed cuts interest rates by 25bps, now at 3.75% (a 3-year low). Bitcoin reacted to the news with LTF volatility but in the end no direction as this cut had been forecast and priced in.
The weekly clearly capping any bullish move, multiple rejections from $94,500 with higher lows compressing price. Historically this compression pattern leads to an impulse move in a given direction. given what we have seen around the weekly high, if price cannot flip this level ($94,500) a continuation of the downtrend may be next as the bears are looking stronger as it stands. My key levels to look for are $84,000, $80,000 and $74,000. Should the weekly high be flipped and reclaimed $100,000 is the major test of resistance.
I am not sure if this week is too early to get our answer but I am planning for what the chart tells me. Until we get a confirmation on HTF direction the range is clear on the LTF.

EURUSD: Sellers Drive Pullback - 1.1670 Support in FocusHello everyone, here is my breakdown of the current EURUSD setup.
Market Analysis
EURUSD remains in a broader bearish structure, and the recent price action is unfolding within a clear downward context. After moving through a prolonged range phase, the pair broke lower and continued to respect the descending trend line, confirming sustained selling pressure. Price later formed a Triangle Support Line, where buyers attempted to reverse the trend, leading to a breakout above the trend line and a retest of the Support Zone around 1.1670. However, after this retest, EURUSD quickly reached the major 1.1760 Resistance, which has repeatedly acted as a strong reaction zone. From this level, a sharp rejection occurred, showing that sellers are still firmly active and protecting this resistance area.
Currently, the market is pulling back from the Resistance Zone and heading back toward the Support Zone, where the ascending structure meets previous breakout levels.
My Scenario & Strategy
My scenario is bearish as long as EURUSD remains below the 1.1760 Resistance and continues to move away from this rejection zone. I expect the price to pull back toward the 1.1670 Support, where the next reaction will determine short-term direction.
Therefore, a clean breakdown below the 1.1670 Support Zone would confirm further bearish continuation and open the path toward lower levels. However, if the pair tests the support and shows a strong bounce, a short-term recovery toward the trend line may occur — but the bearish outlook remains valid while price stays under the 1.1760 Resistance. For now, the market favors sellers, with the key objective being a move back into the Support Zone around 1.1670.
That's the setup I'm tracking. Thank you for your attention, and always manage your risk.

BTCUSD Holds Buyer Zone - Push Toward 96,700 LikelyHello traders! Here’s my technical outlook on BTC/USD based on the current market structure. After a prolonged decline, Bitcoin reversed from the Support Level and broke out of the downward channel, shifting momentum in favor of buyers. The price then moved into a consolidation Range, where accumulation formed before a confirmed Breakout pushed BTC higher. Since then, Bitcoin has been respecting the rising Triangle Support Line, forming higher highs and higher lows. Buyers consistently defend this structure, keeping the bullish trend intact despite local corrections. Currently, BTC is holding above the 90,500–88,800 Buyer Zone, which serves as the key demand area maintaining bullish pressure. As long as the price stays above this zone, the upward scenario remains valid. The market is now heading toward the major 96,700 Resistance Level, located inside the broader Seller Zone. A breakout above this level may open the door for further continuation, while rejection could trigger a pullback toward the Triangle Support Line. For now, the structure favors buyers, with 96,700 as the main upside target. Please share this idea with your friends and click Boost 🚀

XAUUSD — Strong Supply Rejection & Bearish Continuation ScenarioXAUUSD is currently reacting from a strong supply zone, where aggressive selling pressure has capped the recent bullish move. After a sharp UTA (Upthrust Action) and rejection from the highs, price failed to sustain above the premium area, signaling potential distribution and buyer exhaustion.
The market is now consolidating below supply with an unfilled FVG, which acts as short-term resistance. As long as price remains below this imbalance and supply zone, bearish continuation is favored. A breakdown below the intraday support opens the path toward the lower demand zone, which is marked as the primary downside target.
From a fundamental perspective, de-escalation in geopolitical tensions reduces safe-haven demand, adding further bearish pressure on gold. This aligns with the technical structure, supporting the idea of a corrective-to-bearish move in the near term.

BTCUSDT Long: Demand Strength Holds - Market Eyes 93,8K BreakoutHello, traders! The current BTCUSDT price action shows a constructive bullish structure as the market continues to respect the key Demand Zone and the rising Trend Line. After a series of reactions around demand, buyers have repeatedly defended this area, preventing further downside and maintaining the integrity of the broader upward trajectory. Earlier, the market traded inside a corrective Range, showing temporary consolidation before buyers stepped back in and pushed price away from the lower boundary. Even though BTCUSDT faced strong rejection from the Supply Zone near 93,800, the recent pullback retraced directly into a high-value demand region, where the Trend Line and horizontal support intersect. This confluence has already triggered bullish reactions in the past, signaling that buyers remain active and prepared to protect the current market structure. The presence of multiple breakout attempts and higher lows highlights sustained interest from long-side participants.
Currently, BTCUSDT is testing the Demand Zone again, holding firmly above the Trend Line while forming a potential launch point for another upward impulse. As long as buyers maintain control over this level, the market structure favors a continuation toward the upper Supply Zone at 93,800, which remains the primary upside target. A clean bullish move from demand would confirm continuation of the prevailing trend.
My scenario as long as price stays above the Demand Zone and respects the rising Trend Line, the expectation is for BTCUSDT to move higher toward the 93,800 Supply Zone. A strong reaction from demand could initiate a new bullish leg, and a confirmed breakout above 93,800 would open the path for further upside expansion. However, a decisive break below demand would invalidate this long scenario and signal deeper correction. Manage your risk!

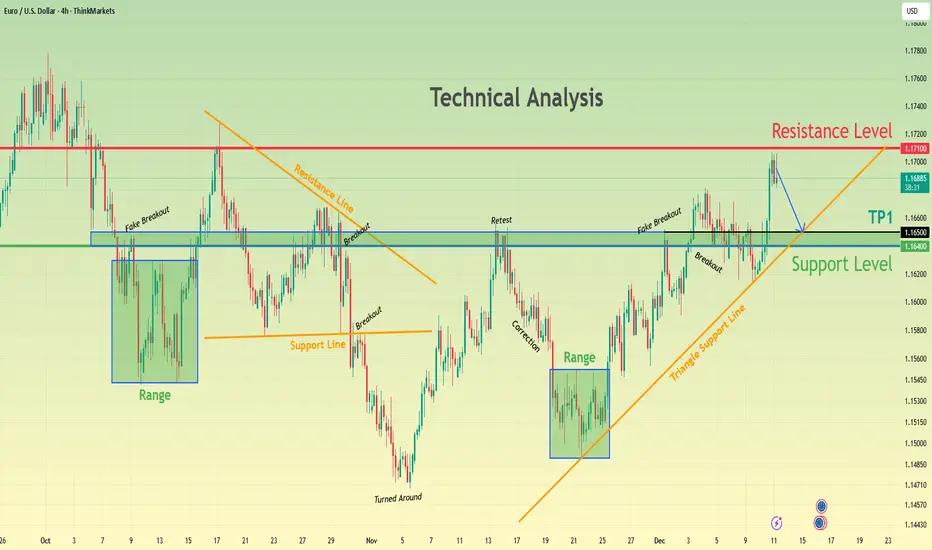
EURUSD Consolidates Below Resistance — Bears Aim for 1.1650Hello traders! Here’s my outlook on the current EURUSD setup. After a prolonged consolidation phase, the pair repeatedly respected the Support Level around 1.1640–1.1650, where buyers have consistently stepped in to defend the zone. This area has acted as a strong demand region, forming multiple ranges and triggering previous upward reversals. Each fake breakout below support confirmed that sellers failed to gain control, allowing price to rebound back into structure. Currently, EURUSD is trading within an ascending structure supported by the Triangle Support Line, which has guided price higher following the major turnaround. Along the way, several breakouts and retests validated bullish momentum as the pair pushed toward the key Resistance Level at 1.1710. This resistance remains the main barrier where price previously rejected and rotated lower. At this moment, EURUSD is approaching the Resistance Level again. If buyers maintain control and continue respecting the rising support line, the primary scenario is a pullback toward TP1 → 1.1650, where a major decision point awaits. This area has proven to be a reliable support level and aligns with previous retests, making it a critical zone for potential bullish continuation. A clean breakout above 1.1710 would open the door for a stronger upward move, signaling renewed bullish strength. However, if price breaks below the Triangle Support Line and falls under 1.1640, the bullish structure becomes invalid, and the market may return to deeper corrective levels. For now, the trend remains moderately bullish as long as price holds above support and stays within the rising structure. Please share this idea with your friends and click Boost 🚀
XRPUSDT — RANGE CONSOLIDATION WITH BREAKOUT POTENTIAL XRPUSDT is currently trading inside a well-defined range after a strong move from the demand zone, showing signs of consolidation and balance between buyers and sellers. Price is respecting the support area while forming higher reactions inside the structure, indicating gradual bullish pressure despite short-term pullbacks within the downside channel.
If price successfully breaks above the buyer zone and range high, bullish momentum is expected to accelerate, opening the path toward the upper supply zone targets. However, failure to hold support may lead to another dip toward the demand zone before any sustainable upside move. This setup favors patience and confirmation before entry.

COCOAUSD — Trendline Breakout & Bearish Retest SetupCocoa price has reacted aggressively from the Strong Supply Zone, where repeated rejections clearly indicate heavy selling pressure and exhaustion of buyers. After the bullish expansion through the UTA phase, price failed to sustain higher levels and moved into a range, signaling distribution and loss of bullish strength at the top.
The key confirmation came with a clean trendline breakout, marking a shift in market structure from bullish to bearish. This breakout shows that buyers are no longer able to defend the trend, and control is gradually shifting to sellers. Price is now expected to retest the broken trendline and range high, which may act as a strong resistance zone.
If the retest is respected, a continuation move toward the Seller Zone becomes highly probable, with extended downside targets aligned toward the Demand Zone Area, where liquidity rests. Overall, the supply rejection, failed continuation, range distribution, and structure break together support a bearish continuation scenario unless price reclaims the supply zone with strong acceptance.

Mastering the Morning Breakout: The New York 15m/30m ORB SetupThe first 15-30 minutes of the market are often pure chaos for novices, but for professionals, it is where the day's structure is built.
The **Opening Range Breakout (ORB)** works because it defines the "Initial Balance"—the battleground where buyers and sellers fight for control. Once price breaks this zone with conviction, it often signals the true trend for the rest of the session.
**The Problem:**
Most traders fail at the open because they chase volatility. They enter on wicks, get trapped by fake-outs, or miscalculate their levels manually.
**The Solution (Chart Breakdown):**
In this NQ example, we strip away the noise and focus on pure structure:
1. **Define the Battlefield:** We let the first 15 minutes pass, or 30 minutes if you wish to wait for more confirmation.
2. **Wait for range to form** Notice the breakout. We don't guess. We wait for a **Candle CLOSE** outside the box.
3. **The Trigger:** The "BULL/BEAR" label only appears when buyers have proven they can hold price above or below the range. This filters out the "wicks" that stop out early shorts.
4. **Precision Targets:** Instead of guessing where to take profit, we use the 1x and 2x measured moves based on the range's own volatility.
**Why this approach saves accounts:**
It forces objectivity. By automating the levels and waiting for the confirmed break, you remove the emotional "FOMO" that ruins morning sessions. You aren't predicting the move; you are executing on confirmed momentum.
*This setup is running on a free community tool. You can add it to your chart using the link below to automate your own morning levels.*

XAUUSD: Bulls Hold Structure - Targeting 4,300 Resistance RetestHello everyone, here is my analysis of the current XAUUSD setup.
Market Analysis
XAUUSD is trading within a broader ascending structure, supported by a well-defined trend line that continues to drive the market upward. Recent price action shows several successful breakouts from previous consolidation zones, confirming sustained bullish pressure. After an extended period of ranging, buyers regained control and pushed the market higher, respecting the overall upward trajectory.
Currently, price is moving within a narrowing formation defined by an upper resistance line and a lower support line. This developing wedge formation suggests that bullish momentum remains intact, but the market is consolidating before its next significant move. The 4,170 support zone continues to serve as a key demand area, where buyers previously stepped in and defended the bullish trend. On the other hand, the 4,300 resistance zone limits the upside and remains the primary barrier for buyers. Overall, the structure indicates that the market maintains a bullish bias as long as price stays above the support line and holds above the 4,170 support level.
My Scenario & Strategy
My scenario remains bullish as long as XAUUSD trades above the 4,170 support zone and continues to respect the rising support line within the current formation. I expect the price to attempt another move toward the 4,300 resistance zone, which aligns with the upper boundary of the wedge structure. A strong breakout above 4,300 would confirm bullish continuation and could open the path for further upward expansion.
However, if the price fails to hold the support line and breaks below the 4,170 level with clear momentum, the bullish scenario would be invalidated, potentially signaling the start of a deeper corrective phase. For now, the market structure favors a long bias, with focus on a potential movement toward the 4,300 resistance area.
That is the setup I am currently monitoring. Thank you for your attention, and as always — manage your risk!
